

Key Insights
The global Grease Proof Paper market is poised for significant expansion, projected to reach an estimated market size of USD 1,800 million by 2025, with a robust Compound Annual Growth Rate (CAGR) of 6.5% throughout the forecast period of 2025-2033. This growth is primarily propelled by the escalating demand for sustainable and eco-friendly packaging solutions across various industries. The increasing consumer awareness regarding the environmental impact of single-use plastics is a key driver, steering manufacturers and end-users towards biodegradable and compostable alternatives like greaseproof paper. Furthermore, the expanding food service industry, coupled with the burgeoning e-commerce sector, necessitates reliable and functional packaging that can maintain product integrity and presentation. The residential use segment, driven by home baking and meal preparation, is also contributing to market expansion, particularly in developed economies.
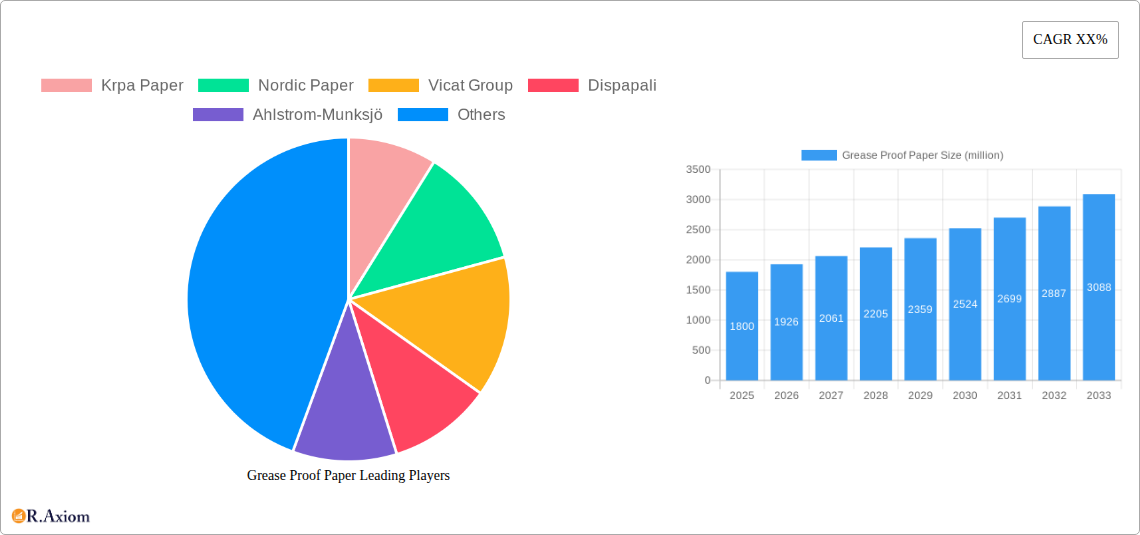
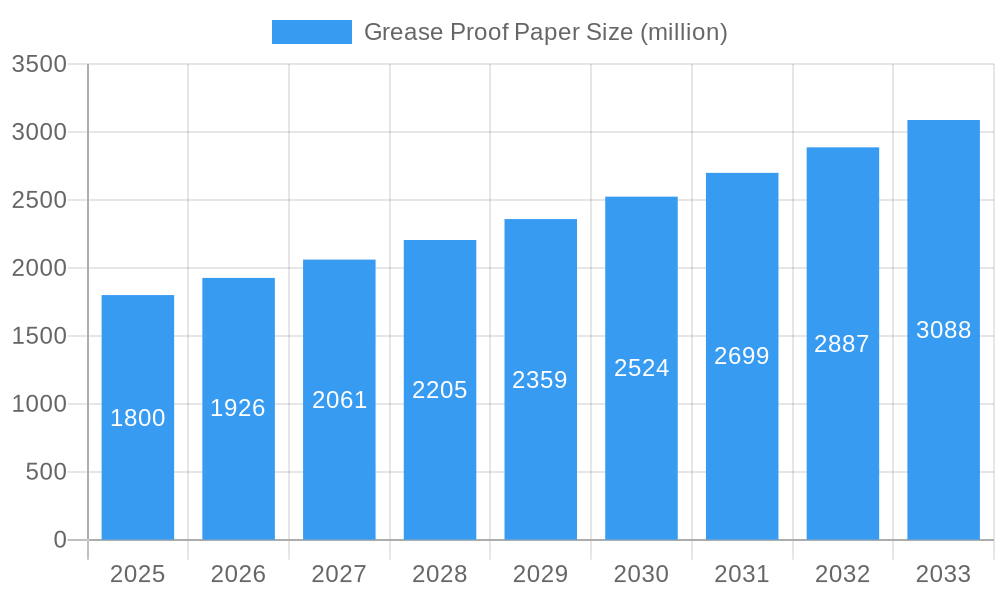
Grease Proof Paper Market Size (In Billion)
The market is segmented into Packaging Paper and Baking Paper applications, with both demonstrating healthy growth trajectories. Packaging Paper is expected to lead due to its extensive use in food packaging, protective liners, and specialty wrapping. The Baking Paper segment, while smaller, is experiencing consistent demand from both commercial bakeries and home consumers. Key market players like Krpa Paper, Nordic Paper, and Ahlstrom-Munksjö are actively investing in product innovation, focusing on enhanced barrier properties, increased sustainability credentials, and specialized functionalities to cater to evolving market needs. Geographically, the Asia Pacific region, driven by rapid industrialization and a large consumer base in countries like China and India, is anticipated to witness the fastest growth. However, North America and Europe remain significant markets, characterized by high adoption rates of sustainable packaging and a mature food processing industry. Restraints such as the availability of alternative barrier materials and fluctuating raw material prices are being addressed through technological advancements and strategic supply chain management by leading companies.
Grease Proof Paper Company Market Share
Grease Proof Paper Market Concentration & Innovation
The global Grease Proof Paper market exhibits a moderate concentration, with leading players such as Ahlstrom-Munksjö, Metsä Tissue, and Nordic Paper holding significant market share, estimated at over 200 million dollars collectively in 2025. Innovation is a key differentiator, driven by increasing demand for sustainable and high-performance grease-proof solutions. Regulatory frameworks are evolving, pushing manufacturers towards eco-friendly materials and production processes, with an estimated 50 million dollars invested annually in R&D for sustainable alternatives. Product substitutes, such as recyclable plastic films and advanced composite materials, pose a growing challenge, although grease proof paper maintains its dominance in specific applications due to cost-effectiveness and biodegradability. End-user trends are shifting towards a preference for convenience and hygiene, particularly in the food service and retail sectors, with residential use experiencing a growth rate of 5% annually. Mergers and acquisitions (M&A) activity, valued at approximately 150 million dollars in the last five years, is consolidating the market and fostering strategic partnerships to enhance product portfolios and expand geographical reach. Companies like Krpa Paper and Vicat Group are actively pursuing M&A to strengthen their competitive positions.
Grease Proof Paper Industry Trends & Insights
The grease proof paper industry is experiencing robust growth, projected to expand at a Compound Annual Growth Rate (CAGR) of approximately 7.5% from 2025 to 2033. This upward trajectory is primarily fueled by the escalating global demand for convenient and safe food packaging solutions. The increasing adoption of ready-to-eat meals, baked goods, and fast food services across both residential and commercial use segments directly correlates with the rising consumption of grease proof paper. Technological advancements are playing a crucial role in shaping the industry. Innovations in paper coating technologies and raw material sourcing are leading to the development of enhanced grease resistance, heat tolerance, and printability, thereby expanding the application spectrum of grease proof paper. The shift towards sustainable packaging is a significant market penetration driver, with consumers and regulatory bodies alike demanding eco-friendly alternatives to traditional plastic packaging. This has spurred significant investment in the development of compostable and recyclable grease proof papers, creating new market opportunities and driving innovation. The competitive landscape is characterized by a mix of established global players and regional manufacturers, each vying for market share through product differentiation, strategic partnerships, and efficient supply chain management. Companies like Ahlstrom-Munksjö and Nordic Paper are leading this charge with their continuous investment in advanced manufacturing processes and sustainable product development. The market penetration of grease proof paper is steadily increasing in developing economies as disposable incomes rise and urbanization accelerates, leading to greater demand for packaged food products. Furthermore, the e-commerce boom has indirectly benefited the grease proof paper market, as it is increasingly used for packaging food items for online delivery, ensuring product integrity and presentation. The industry is also witnessing a rise in customized solutions, catering to specific needs of different food industries, further driving market penetration and customer loyalty. The estimated market size for grease proof paper is projected to reach over 7,000 million dollars by 2033, underscoring the significant growth potential within this sector.
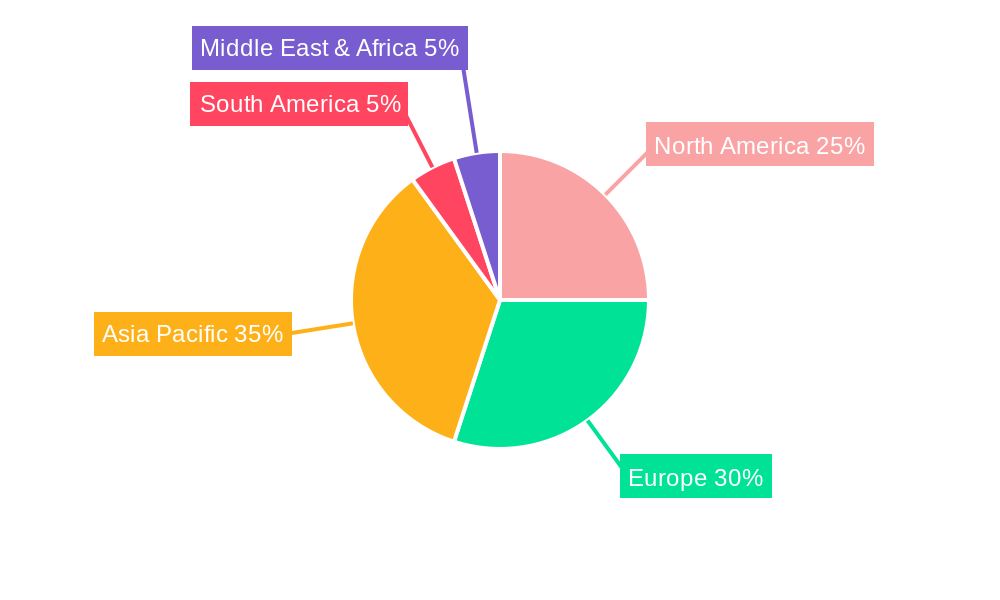
Dominant Markets & Segments in Grease Proof Paper
The grease proof paper market is currently dominated by the Asia-Pacific region, with an estimated market share of over 30% in 2025. This dominance is propelled by rapid industrialization, a burgeoning middle class with increasing disposable incomes, and the subsequent surge in demand for packaged food products. Countries like China and India are pivotal to this regional leadership, driven by extensive food processing industries and evolving consumer lifestyles. Within the application segment, Commercial Use holds a leading position, accounting for an estimated 60% of the global market in 2025. This segment encompasses bakeries, restaurants, fast-food chains, and food manufacturers who rely heavily on grease proof paper for a wide array of purposes, from baking and wrapping to food service disposables. The convenience, hygiene, and product protection offered by grease proof paper make it indispensable in these commercial settings. Economic policies supporting the food and beverage industry, coupled with significant investments in food infrastructure, further bolster the commercial use segment's dominance.
In terms of product types, Baking Paper emerges as the leading segment, estimated to capture over 45% of the market share in 2025. This is attributed to its widespread use in both domestic kitchens and commercial bakeries for preventing food from sticking to baking surfaces, ensuring even heat distribution, and facilitating easy cleanup. The increasing popularity of home baking and the consistent demand from the professional patisserie sector are key drivers for this segment.
Leading Region: Asia-Pacific
- Key Drivers: Rapid economic growth, expanding food processing sector, increasing urbanization, rising disposable incomes, growing demand for convenience foods, favorable government initiatives supporting manufacturing.
- Dominance Analysis: China and India are major contributors due to their large populations and significant food production capabilities. The widespread adoption of Western eating habits and the growth of the fast-food industry further solidify Asia-Pacific's leading position.
Dominant Application Segment: Commercial Use
- Key Drivers: High demand from food service establishments (restaurants, cafes, fast food), extensive use in bakeries and food manufacturing, requirement for hygiene and food safety, efficiency in food preparation and presentation.
- Dominance Analysis: The continuous growth of the global food service industry, coupled with the need for reliable and effective packaging solutions, makes commercial use the largest application segment.
Dominant Product Type: Baking Paper
- Key Drivers: Essential for preventing food adhesion in baking and cooking, ensures easy cleanup, promotes even cooking, increasing popularity of home baking and professional patisserie.
- Dominance Analysis: The versatility and effectiveness of baking paper in culinary applications, from simple cookies to elaborate cakes, cement its position as the leading product type within the grease proof paper market.
Grease Proof Paper Product Developments
Recent product developments in the grease proof paper market are centered on enhancing sustainability and functionality. Innovations include the introduction of compostable and biodegradable grease proof papers made from renewable resources, catering to the growing environmental consciousness. Furthermore, advancements in coating technologies are yielding papers with superior grease and moisture resistance, improved heat stability for high-temperature applications, and enhanced printability for better branding and consumer appeal. The development of specialized grease proof papers for specific food applications, such as those designed for frozen foods or oven-ready meals, provides a competitive edge for manufacturers like Simpac and Expera.
Report Scope & Segmentation Analysis
This report meticulously analyzes the global Grease Proof Paper market, segmenting it by Application and Type to provide granular insights.
Application: Residential Use This segment focuses on grease proof paper used in households for baking, cooking, and food storage. Projections indicate a steady growth driven by increasing home baking trends and the demand for convenient food preparation solutions. The market size for residential use is estimated to be over 2,500 million dollars by 2033, with a projected CAGR of approximately 6.8%. Competitive dynamics within this segment are influenced by brand recognition and product accessibility.
Application: Commercial Use This segment encompasses the extensive use of grease proof paper in food service establishments, bakeries, and food manufacturing industries. It represents the larger share of the market, driven by the need for hygiene, product protection, and operational efficiency. Market size for commercial use is projected to exceed 4,500 million dollars by 2033, with an estimated CAGR of 7.8%. Intense competition exists among suppliers to offer customized solutions and cost-effective options.
Type: Packaging Paper This category includes grease proof paper utilized for packaging various food items, ensuring they remain fresh and free from grease leakage during transit and display. Growth in this segment is linked to the expanding processed food industry and the rise of e-commerce. The market size for packaging paper is anticipated to reach over 3,000 million dollars by 2033, with a CAGR of approximately 7.2%. Key competitive factors include barrier properties and printability.
Type: Baking Paper This segment is dedicated to grease proof paper specifically designed for baking applications, preventing food from sticking and facilitating easy handling. Its strong position is supported by the consistent demand from both home bakers and professional kitchens. The market size for baking paper is projected to be over 3,800 million dollars by 2033, with a CAGR of roughly 7.5%. Competition is driven by quality, ease of use, and specialized features.
Key Drivers of Grease Proof Paper Growth
The grease proof paper market is propelled by several dynamic growth drivers. The increasing global demand for processed and convenience foods, fueled by urbanization and changing lifestyles, is a primary catalyst. Technological advancements in paper manufacturing, particularly in coating and material science, are leading to improved product performance and expanded applications, such as enhanced grease and heat resistance. The rising environmental consciousness among consumers and stricter regulations promoting sustainable packaging are driving the adoption of eco-friendly grease proof paper alternatives, including compostable and recyclable options. Furthermore, the growth of the food service industry, including fast-food chains and restaurants, directly translates to higher consumption of grease proof paper for packaging, wrapping, and food presentation. The expanding e-commerce sector for food products also contributes significantly by requiring robust and hygienic packaging.
Challenges in the Grease Proof Paper Sector
Despite its growth, the grease proof paper sector faces several challenges. Fluctuations in the prices of raw materials, such as wood pulp and chemicals used in coating processes, can impact manufacturing costs and profit margins. Stringent environmental regulations concerning forest management and chemical usage can necessitate significant investments in compliance and sustainable practices. The emergence of alternative packaging materials, including advanced plastic films and biodegradable composites, presents competitive pressure by offering varying levels of performance and sustainability claims. Supply chain disruptions, exacerbated by geopolitical factors and logistical complexities, can affect the availability and timely delivery of finished products. Moreover, intense price competition among manufacturers, particularly in saturated markets, can limit profitability.
Emerging Opportunities in Grease Proof Paper
The grease proof paper market is ripe with emerging opportunities. The growing demand for premium and artisanal food products is creating a niche for high-quality, aesthetically pleasing grease proof packaging that enhances brand perception. The expansion of the plant-based food sector, which often requires specialized packaging to maintain freshness and prevent leakage, presents a significant growth avenue. Opportunities also lie in developing innovative grease proof papers with advanced functionalities, such as antimicrobial properties or extended shelf-life capabilities. The untapped potential in emerging economies, with their rapidly developing food processing and retail sectors, offers substantial room for market penetration. Furthermore, collaborations with food manufacturers to develop bespoke grease proof solutions tailored to specific product needs can foster strong partnerships and market leadership.
Leading Players in the Grease Proof Paper Market
- Ahlstrom-Munksjö
- Metsä Tissue
- Nordic Paper
- Vicat Group
- Krpa Paper
- Dispapali
- Delfortgroup
- Expera
- Simpac
- Pudumjee Group
- Domtar
Key Developments in Grease Proof Paper Industry
- 2023 January: Ahlstrom-Munksjö launched a new range of bio-based grease proof papers, enhancing its sustainable product portfolio.
- 2023 April: Nordic Paper announced significant investment in capacity expansion for its high-performance grease proof papers to meet growing demand.
- 2023 July: Vicat Group acquired a regional producer of specialty papers, including grease proof varieties, to strengthen its market presence in Europe.
- 2024 February: Metsä Tissue introduced innovative printing technologies for grease proof papers, offering enhanced branding opportunities.
- 2024 May: Expera developed a new formulation for its grease proof paper, significantly improving its heat resistance for industrial baking applications.
- 2024 October: Simpac expanded its distribution network to cater to the increasing demand for grease proof packaging in Southeast Asia.
Strategic Outlook for Grease Proof Paper Market
The strategic outlook for the grease proof paper market remains highly positive, driven by a confluence of factors including sustained global demand for convenient food packaging, ongoing innovation in material science, and a strong push towards sustainable solutions. Manufacturers are poised to capitalize on the increasing preference for eco-friendly alternatives and the expanding reach of e-commerce and the food service industry. Strategic investments in research and development for biodegradable and compostable grease proof papers, alongside the expansion of production capacities in high-growth regions, will be crucial for market leadership. Furthermore, fostering strategic partnerships and exploring mergers and acquisitions will enable companies to broaden their product portfolios, enhance their technological capabilities, and secure a more dominant position in the evolving global market.
Grease Proof Paper Segmentation
-
1. Application
- 1.1. Residential Use
- 1.2. Commercial Use
-
2. Types
- 2.1. Packaging Paper
- 2.2. Baking Paper
Grease Proof Paper Segmentation By Geography
-
1. North America
- 1.1. United States
- 1.2. Canada
- 1.3. Mexico
-
2. South America
- 2.1. Brazil
- 2.2. Argentina
- 2.3. Rest of South America
-
3. Europe
- 3.1. United Kingdom
- 3.2. Germany
- 3.3. France
- 3.4. Italy
- 3.5. Spain
- 3.6. Russia
- 3.7. Benelux
- 3.8. Nordics
- 3.9. Rest of Europe
-
4. Middle East & Africa
- 4.1. Turkey
- 4.2. Israel
- 4.3. GCC
- 4.4. North Africa
- 4.5. South Africa
- 4.6. Rest of Middle East & Africa
-
5. Asia Pacific
- 5.1. China
- 5.2. India
- 5.3. Japan
- 5.4. South Korea
- 5.5. ASEAN
- 5.6. Oceania
- 5.7. Rest of Asia Pacific
Grease Proof Paper Regional Market Share
Geographic Coverage of Grease Proof Paper
Grease Proof Paper REPORT HIGHLIGHTS
| Aspects | Details |
|---|---|
| Study Period | 2020-2034 |
| Base Year | 2025 |
| Estimated Year | 2026 |
| Forecast Period | 2026-2034 |
| Historical Period | 2020-2025 |
| Growth Rate | CAGR of 5.8% from 2020-2034 |
| Segmentation |
|
Table of Contents
- 1. Introduction
- 1.1. Research Scope
- 1.2. Market Segmentation
- 1.3. Research Objective
- 1.4. Definitions and Assumptions
- 2. Executive Summary
- 2.1. Market Snapshot
- 3. Market Dynamics
- 3.1. Market Drivers
- 3.2. Market Restrains
- 3.3. Market Trends
- 3.4. Market Opportunities
- 4. Market Factor Analysis
- 4.1. Porters Five Forces
- 4.1.1. Bargaining Power of Suppliers
- 4.1.2. Bargaining Power of Buyers
- 4.1.3. Threat of New Entrants
- 4.1.4. Threat of Substitutes
- 4.1.5. Competitive Rivalry
- 4.2. PESTEL analysis
- 4.3. BCG Analysis
- 4.3.1. Stars (High Growth, High Market Share)
- 4.3.2. Cash Cows (Low Growth, High Market Share)
- 4.3.3. Question Mark (High Growth, Low Market Share)
- 4.3.4. Dogs (Low Growth, Low Market Share)
- 4.4. Ansoff Matrix Analysis
- 4.5. Supply Chain Analysis
- 4.6. Regulatory Landscape
- 4.7. Current Market Potential and Opportunity Assessment (TAM–SAM–SOM Framework)
- 4.8. RAX Analyst Note
- 4.1. Porters Five Forces
- 5. Market Analysis, Insights and Forecast 2021-2033
- 5.1. Market Analysis, Insights and Forecast - by Application
- 5.1.1. Residential Use
- 5.1.2. Commercial Use
- 5.2. Market Analysis, Insights and Forecast - by Types
- 5.2.1. Packaging Paper
- 5.2.2. Baking Paper
- 5.3. Market Analysis, Insights and Forecast - by Region
- 5.3.1. North America
- 5.3.2. South America
- 5.3.3. Europe
- 5.3.4. Middle East & Africa
- 5.3.5. Asia Pacific
- 5.1. Market Analysis, Insights and Forecast - by Application
- 6. Global Grease Proof Paper Analysis, Insights and Forecast, 2021-2033
- 6.1. Market Analysis, Insights and Forecast - by Application
- 6.1.1. Residential Use
- 6.1.2. Commercial Use
- 6.2. Market Analysis, Insights and Forecast - by Types
- 6.2.1. Packaging Paper
- 6.2.2. Baking Paper
- 6.1. Market Analysis, Insights and Forecast - by Application
- 7. North America Grease Proof Paper Analysis, Insights and Forecast, 2020-2032
- 7.1. Market Analysis, Insights and Forecast - by Application
- 7.1.1. Residential Use
- 7.1.2. Commercial Use
- 7.2. Market Analysis, Insights and Forecast - by Types
- 7.2.1. Packaging Paper
- 7.2.2. Baking Paper
- 7.1. Market Analysis, Insights and Forecast - by Application
- 8. South America Grease Proof Paper Analysis, Insights and Forecast, 2020-2032
- 8.1. Market Analysis, Insights and Forecast - by Application
- 8.1.1. Residential Use
- 8.1.2. Commercial Use
- 8.2. Market Analysis, Insights and Forecast - by Types
- 8.2.1. Packaging Paper
- 8.2.2. Baking Paper
- 8.1. Market Analysis, Insights and Forecast - by Application
- 9. Europe Grease Proof Paper Analysis, Insights and Forecast, 2020-2032
- 9.1. Market Analysis, Insights and Forecast - by Application
- 9.1.1. Residential Use
- 9.1.2. Commercial Use
- 9.2. Market Analysis, Insights and Forecast - by Types
- 9.2.1. Packaging Paper
- 9.2.2. Baking Paper
- 9.1. Market Analysis, Insights and Forecast - by Application
- 10. Middle East & Africa Grease Proof Paper Analysis, Insights and Forecast, 2020-2032
- 10.1. Market Analysis, Insights and Forecast - by Application
- 10.1.1. Residential Use
- 10.1.2. Commercial Use
- 10.2. Market Analysis, Insights and Forecast - by Types
- 10.2.1. Packaging Paper
- 10.2.2. Baking Paper
- 10.1. Market Analysis, Insights and Forecast - by Application
- 11. Asia Pacific Grease Proof Paper Analysis, Insights and Forecast, 2020-2032
- 11.1. Market Analysis, Insights and Forecast - by Application
- 11.1.1. Residential Use
- 11.1.2. Commercial Use
- 11.2. Market Analysis, Insights and Forecast - by Types
- 11.2.1. Packaging Paper
- 11.2.2. Baking Paper
- 11.1. Market Analysis, Insights and Forecast - by Application
- 12. Competitive Analysis
- 12.1. Company Profiles
- 12.1.1 Krpa Paper
- 12.1.1.1. Company Overview
- 12.1.1.2. Products
- 12.1.1.3. Company Financials
- 12.1.1.4. SWOT Analysis
- 12.1.2 Nordic Paper
- 12.1.2.1. Company Overview
- 12.1.2.2. Products
- 12.1.2.3. Company Financials
- 12.1.2.4. SWOT Analysis
- 12.1.3 Vicat Group
- 12.1.3.1. Company Overview
- 12.1.3.2. Products
- 12.1.3.3. Company Financials
- 12.1.3.4. SWOT Analysis
- 12.1.4 Dispapali
- 12.1.4.1. Company Overview
- 12.1.4.2. Products
- 12.1.4.3. Company Financials
- 12.1.4.4. SWOT Analysis
- 12.1.5 Ahlstrom-Munksjö
- 12.1.5.1. Company Overview
- 12.1.5.2. Products
- 12.1.5.3. Company Financials
- 12.1.5.4. SWOT Analysis
- 12.1.6 Delfortgroup
- 12.1.6.1. Company Overview
- 12.1.6.2. Products
- 12.1.6.3. Company Financials
- 12.1.6.4. SWOT Analysis
- 12.1.7 Expera
- 12.1.7.1. Company Overview
- 12.1.7.2. Products
- 12.1.7.3. Company Financials
- 12.1.7.4. SWOT Analysis
- 12.1.8 Simpac
- 12.1.8.1. Company Overview
- 12.1.8.2. Products
- 12.1.8.3. Company Financials
- 12.1.8.4. SWOT Analysis
- 12.1.9 Metsä Tissue
- 12.1.9.1. Company Overview
- 12.1.9.2. Products
- 12.1.9.3. Company Financials
- 12.1.9.4. SWOT Analysis
- 12.1.10 Pudumjee Group
- 12.1.10.1. Company Overview
- 12.1.10.2. Products
- 12.1.10.3. Company Financials
- 12.1.10.4. SWOT Analysis
- 12.1.11 Domtar
- 12.1.11.1. Company Overview
- 12.1.11.2. Products
- 12.1.11.3. Company Financials
- 12.1.11.4. SWOT Analysis
- 12.1.1 Krpa Paper
- 12.2. Market Entropy
- 12.2.1 Company's Key Areas Served
- 12.2.2 Recent Developments
- 12.3. Company Market Share Analysis 2025
- 12.3.1 Top 5 Companies Market Share Analysis
- 12.3.2 Top 3 Companies Market Share Analysis
- 12.4. List of Potential Customers
- 13. Research Methodology
List of Figures
- Figure 1: Global Grease Proof Paper Revenue Breakdown (undefined, %) by Region 2025 & 2033
- Figure 2: Global Grease Proof Paper Volume Breakdown (K, %) by Region 2025 & 2033
- Figure 3: North America Grease Proof Paper Revenue (undefined), by Application 2025 & 2033
- Figure 4: North America Grease Proof Paper Volume (K), by Application 2025 & 2033
- Figure 5: North America Grease Proof Paper Revenue Share (%), by Application 2025 & 2033
- Figure 6: North America Grease Proof Paper Volume Share (%), by Application 2025 & 2033
- Figure 7: North America Grease Proof Paper Revenue (undefined), by Types 2025 & 2033
- Figure 8: North America Grease Proof Paper Volume (K), by Types 2025 & 2033
- Figure 9: North America Grease Proof Paper Revenue Share (%), by Types 2025 & 2033
- Figure 10: North America Grease Proof Paper Volume Share (%), by Types 2025 & 2033
- Figure 11: North America Grease Proof Paper Revenue (undefined), by Country 2025 & 2033
- Figure 12: North America Grease Proof Paper Volume (K), by Country 2025 & 2033
- Figure 13: North America Grease Proof Paper Revenue Share (%), by Country 2025 & 2033
- Figure 14: North America Grease Proof Paper Volume Share (%), by Country 2025 & 2033
- Figure 15: South America Grease Proof Paper Revenue (undefined), by Application 2025 & 2033
- Figure 16: South America Grease Proof Paper Volume (K), by Application 2025 & 2033
- Figure 17: South America Grease Proof Paper Revenue Share (%), by Application 2025 & 2033
- Figure 18: South America Grease Proof Paper Volume Share (%), by Application 2025 & 2033
- Figure 19: South America Grease Proof Paper Revenue (undefined), by Types 2025 & 2033
- Figure 20: South America Grease Proof Paper Volume (K), by Types 2025 & 2033
- Figure 21: South America Grease Proof Paper Revenue Share (%), by Types 2025 & 2033
- Figure 22: South America Grease Proof Paper Volume Share (%), by Types 2025 & 2033
- Figure 23: South America Grease Proof Paper Revenue (undefined), by Country 2025 & 2033
- Figure 24: South America Grease Proof Paper Volume (K), by Country 2025 & 2033
- Figure 25: South America Grease Proof Paper Revenue Share (%), by Country 2025 & 2033
- Figure 26: South America Grease Proof Paper Volume Share (%), by Country 2025 & 2033
- Figure 27: Europe Grease Proof Paper Revenue (undefined), by Application 2025 & 2033
- Figure 28: Europe Grease Proof Paper Volume (K), by Application 2025 & 2033
- Figure 29: Europe Grease Proof Paper Revenue Share (%), by Application 2025 & 2033
- Figure 30: Europe Grease Proof Paper Volume Share (%), by Application 2025 & 2033
- Figure 31: Europe Grease Proof Paper Revenue (undefined), by Types 2025 & 2033
- Figure 32: Europe Grease Proof Paper Volume (K), by Types 2025 & 2033
- Figure 33: Europe Grease Proof Paper Revenue Share (%), by Types 2025 & 2033
- Figure 34: Europe Grease Proof Paper Volume Share (%), by Types 2025 & 2033
- Figure 35: Europe Grease Proof Paper Revenue (undefined), by Country 2025 & 2033
- Figure 36: Europe Grease Proof Paper Volume (K), by Country 2025 & 2033
- Figure 37: Europe Grease Proof Paper Revenue Share (%), by Country 2025 & 2033
- Figure 38: Europe Grease Proof Paper Volume Share (%), by Country 2025 & 2033
- Figure 39: Middle East & Africa Grease Proof Paper Revenue (undefined), by Application 2025 & 2033
- Figure 40: Middle East & Africa Grease Proof Paper Volume (K), by Application 2025 & 2033
- Figure 41: Middle East & Africa Grease Proof Paper Revenue Share (%), by Application 2025 & 2033
- Figure 42: Middle East & Africa Grease Proof Paper Volume Share (%), by Application 2025 & 2033
- Figure 43: Middle East & Africa Grease Proof Paper Revenue (undefined), by Types 2025 & 2033
- Figure 44: Middle East & Africa Grease Proof Paper Volume (K), by Types 2025 & 2033
- Figure 45: Middle East & Africa Grease Proof Paper Revenue Share (%), by Types 2025 & 2033
- Figure 46: Middle East & Africa Grease Proof Paper Volume Share (%), by Types 2025 & 2033
- Figure 47: Middle East & Africa Grease Proof Paper Revenue (undefined), by Country 2025 & 2033
- Figure 48: Middle East & Africa Grease Proof Paper Volume (K), by Country 2025 & 2033
- Figure 49: Middle East & Africa Grease Proof Paper Revenue Share (%), by Country 2025 & 2033
- Figure 50: Middle East & Africa Grease Proof Paper Volume Share (%), by Country 2025 & 2033
- Figure 51: Asia Pacific Grease Proof Paper Revenue (undefined), by Application 2025 & 2033
- Figure 52: Asia Pacific Grease Proof Paper Volume (K), by Application 2025 & 2033
- Figure 53: Asia Pacific Grease Proof Paper Revenue Share (%), by Application 2025 & 2033
- Figure 54: Asia Pacific Grease Proof Paper Volume Share (%), by Application 2025 & 2033
- Figure 55: Asia Pacific Grease Proof Paper Revenue (undefined), by Types 2025 & 2033
- Figure 56: Asia Pacific Grease Proof Paper Volume (K), by Types 2025 & 2033
- Figure 57: Asia Pacific Grease Proof Paper Revenue Share (%), by Types 2025 & 2033
- Figure 58: Asia Pacific Grease Proof Paper Volume Share (%), by Types 2025 & 2033
- Figure 59: Asia Pacific Grease Proof Paper Revenue (undefined), by Country 2025 & 2033
- Figure 60: Asia Pacific Grease Proof Paper Volume (K), by Country 2025 & 2033
- Figure 61: Asia Pacific Grease Proof Paper Revenue Share (%), by Country 2025 & 2033
- Figure 62: Asia Pacific Grease Proof Paper Volume Share (%), by Country 2025 & 2033
List of Tables
- Table 1: Global Grease Proof Paper Revenue undefined Forecast, by Application 2020 & 2033
- Table 2: Global Grease Proof Paper Volume K Forecast, by Application 2020 & 2033
- Table 3: Global Grease Proof Paper Revenue undefined Forecast, by Types 2020 & 2033
- Table 4: Global Grease Proof Paper Volume K Forecast, by Types 2020 & 2033
- Table 5: Global Grease Proof Paper Revenue undefined Forecast, by Region 2020 & 2033
- Table 6: Global Grease Proof Paper Volume K Forecast, by Region 2020 & 2033
- Table 7: Global Grease Proof Paper Revenue undefined Forecast, by Application 2020 & 2033
- Table 8: Global Grease Proof Paper Volume K Forecast, by Application 2020 & 2033
- Table 9: Global Grease Proof Paper Revenue undefined Forecast, by Types 2020 & 2033
- Table 10: Global Grease Proof Paper Volume K Forecast, by Types 2020 & 2033
- Table 11: Global Grease Proof Paper Revenue undefined Forecast, by Country 2020 & 2033
- Table 12: Global Grease Proof Paper Volume K Forecast, by Country 2020 & 2033
- Table 13: United States Grease Proof Paper Revenue (undefined) Forecast, by Application 2020 & 2033
- Table 14: United States Grease Proof Paper Volume (K) Forecast, by Application 2020 & 2033
- Table 15: Canada Grease Proof Paper Revenue (undefined) Forecast, by Application 2020 & 2033
- Table 16: Canada Grease Proof Paper Volume (K) Forecast, by Application 2020 & 2033
- Table 17: Mexico Grease Proof Paper Revenue (undefined) Forecast, by Application 2020 & 2033
- Table 18: Mexico Grease Proof Paper Volume (K) Forecast, by Application 2020 & 2033
- Table 19: Global Grease Proof Paper Revenue undefined Forecast, by Application 2020 & 2033
- Table 20: Global Grease Proof Paper Volume K Forecast, by Application 2020 & 2033
- Table 21: Global Grease Proof Paper Revenue undefined Forecast, by Types 2020 & 2033
- Table 22: Global Grease Proof Paper Volume K Forecast, by Types 2020 & 2033
- Table 23: Global Grease Proof Paper Revenue undefined Forecast, by Country 2020 & 2033
- Table 24: Global Grease Proof Paper Volume K Forecast, by Country 2020 & 2033
- Table 25: Brazil Grease Proof Paper Revenue (undefined) Forecast, by Application 2020 & 2033
- Table 26: Brazil Grease Proof Paper Volume (K) Forecast, by Application 2020 & 2033
- Table 27: Argentina Grease Proof Paper Revenue (undefined) Forecast, by Application 2020 & 2033
- Table 28: Argentina Grease Proof Paper Volume (K) Forecast, by Application 2020 & 2033
- Table 29: Rest of South America Grease Proof Paper Revenue (undefined) Forecast, by Application 2020 & 2033
- Table 30: Rest of South America Grease Proof Paper Volume (K) Forecast, by Application 2020 & 2033
- Table 31: Global Grease Proof Paper Revenue undefined Forecast, by Application 2020 & 2033
- Table 32: Global Grease Proof Paper Volume K Forecast, by Application 2020 & 2033
- Table 33: Global Grease Proof Paper Revenue undefined Forecast, by Types 2020 & 2033
- Table 34: Global Grease Proof Paper Volume K Forecast, by Types 2020 & 2033
- Table 35: Global Grease Proof Paper Revenue undefined Forecast, by Country 2020 & 2033
- Table 36: Global Grease Proof Paper Volume K Forecast, by Country 2020 & 2033
- Table 37: United Kingdom Grease Proof Paper Revenue (undefined) Forecast, by Application 2020 & 2033
- Table 38: United Kingdom Grease Proof Paper Volume (K) Forecast, by Application 2020 & 2033
- Table 39: Germany Grease Proof Paper Revenue (undefined) Forecast, by Application 2020 & 2033
- Table 40: Germany Grease Proof Paper Volume (K) Forecast, by Application 2020 & 2033
- Table 41: France Grease Proof Paper Revenue (undefined) Forecast, by Application 2020 & 2033
- Table 42: France Grease Proof Paper Volume (K) Forecast, by Application 2020 & 2033
- Table 43: Italy Grease Proof Paper Revenue (undefined) Forecast, by Application 2020 & 2033
- Table 44: Italy Grease Proof Paper Volume (K) Forecast, by Application 2020 & 2033
- Table 45: Spain Grease Proof Paper Revenue (undefined) Forecast, by Application 2020 & 2033
- Table 46: Spain Grease Proof Paper Volume (K) Forecast, by Application 2020 & 2033
- Table 47: Russia Grease Proof Paper Revenue (undefined) Forecast, by Application 2020 & 2033
- Table 48: Russia Grease Proof Paper Volume (K) Forecast, by Application 2020 & 2033
- Table 49: Benelux Grease Proof Paper Revenue (undefined) Forecast, by Application 2020 & 2033
- Table 50: Benelux Grease Proof Paper Volume (K) Forecast, by Application 2020 & 2033
- Table 51: Nordics Grease Proof Paper Revenue (undefined) Forecast, by Application 2020 & 2033
- Table 52: Nordics Grease Proof Paper Volume (K) Forecast, by Application 2020 & 2033
- Table 53: Rest of Europe Grease Proof Paper Revenue (undefined) Forecast, by Application 2020 & 2033
- Table 54: Rest of Europe Grease Proof Paper Volume (K) Forecast, by Application 2020 & 2033
- Table 55: Global Grease Proof Paper Revenue undefined Forecast, by Application 2020 & 2033
- Table 56: Global Grease Proof Paper Volume K Forecast, by Application 2020 & 2033
- Table 57: Global Grease Proof Paper Revenue undefined Forecast, by Types 2020 & 2033
- Table 58: Global Grease Proof Paper Volume K Forecast, by Types 2020 & 2033
- Table 59: Global Grease Proof Paper Revenue undefined Forecast, by Country 2020 & 2033
- Table 60: Global Grease Proof Paper Volume K Forecast, by Country 2020 & 2033
- Table 61: Turkey Grease Proof Paper Revenue (undefined) Forecast, by Application 2020 & 2033
- Table 62: Turkey Grease Proof Paper Volume (K) Forecast, by Application 2020 & 2033
- Table 63: Israel Grease Proof Paper Revenue (undefined) Forecast, by Application 2020 & 2033
- Table 64: Israel Grease Proof Paper Volume (K) Forecast, by Application 2020 & 2033
- Table 65: GCC Grease Proof Paper Revenue (undefined) Forecast, by Application 2020 & 2033
- Table 66: GCC Grease Proof Paper Volume (K) Forecast, by Application 2020 & 2033
- Table 67: North Africa Grease Proof Paper Revenue (undefined) Forecast, by Application 2020 & 2033
- Table 68: North Africa Grease Proof Paper Volume (K) Forecast, by Application 2020 & 2033
- Table 69: South Africa Grease Proof Paper Revenue (undefined) Forecast, by Application 2020 & 2033
- Table 70: South Africa Grease Proof Paper Volume (K) Forecast, by Application 2020 & 2033
- Table 71: Rest of Middle East & Africa Grease Proof Paper Revenue (undefined) Forecast, by Application 2020 & 2033
- Table 72: Rest of Middle East & Africa Grease Proof Paper Volume (K) Forecast, by Application 2020 & 2033
- Table 73: Global Grease Proof Paper Revenue undefined Forecast, by Application 2020 & 2033
- Table 74: Global Grease Proof Paper Volume K Forecast, by Application 2020 & 2033
- Table 75: Global Grease Proof Paper Revenue undefined Forecast, by Types 2020 & 2033
- Table 76: Global Grease Proof Paper Volume K Forecast, by Types 2020 & 2033
- Table 77: Global Grease Proof Paper Revenue undefined Forecast, by Country 2020 & 2033
- Table 78: Global Grease Proof Paper Volume K Forecast, by Country 2020 & 2033
- Table 79: China Grease Proof Paper Revenue (undefined) Forecast, by Application 2020 & 2033
- Table 80: China Grease Proof Paper Volume (K) Forecast, by Application 2020 & 2033
- Table 81: India Grease Proof Paper Revenue (undefined) Forecast, by Application 2020 & 2033
- Table 82: India Grease Proof Paper Volume (K) Forecast, by Application 2020 & 2033
- Table 83: Japan Grease Proof Paper Revenue (undefined) Forecast, by Application 2020 & 2033
- Table 84: Japan Grease Proof Paper Volume (K) Forecast, by Application 2020 & 2033
- Table 85: South Korea Grease Proof Paper Revenue (undefined) Forecast, by Application 2020 & 2033
- Table 86: South Korea Grease Proof Paper Volume (K) Forecast, by Application 2020 & 2033
- Table 87: ASEAN Grease Proof Paper Revenue (undefined) Forecast, by Application 2020 & 2033
- Table 88: ASEAN Grease Proof Paper Volume (K) Forecast, by Application 2020 & 2033
- Table 89: Oceania Grease Proof Paper Revenue (undefined) Forecast, by Application 2020 & 2033
- Table 90: Oceania Grease Proof Paper Volume (K) Forecast, by Application 2020 & 2033
- Table 91: Rest of Asia Pacific Grease Proof Paper Revenue (undefined) Forecast, by Application 2020 & 2033
- Table 92: Rest of Asia Pacific Grease Proof Paper Volume (K) Forecast, by Application 2020 & 2033
Frequently Asked Questions
1. What is the projected Compound Annual Growth Rate (CAGR) of the Grease Proof Paper?
The projected CAGR is approximately 5.8%.
2. Which companies are prominent players in the Grease Proof Paper?
Key companies in the market include Krpa Paper, Nordic Paper, Vicat Group, Dispapali, Ahlstrom-Munksjö, Delfortgroup, Expera, Simpac, Metsä Tissue, Pudumjee Group, Domtar.
3. What are the main segments of the Grease Proof Paper?
The market segments include Application, Types.
4. Can you provide details about the market size?
The market size is estimated to be USD XXX N/A as of 2022.
5. What are some drivers contributing to market growth?
N/A
6. What are the notable trends driving market growth?
N/A
7. Are there any restraints impacting market growth?
N/A
8. Can you provide examples of recent developments in the market?
N/A
9. What pricing options are available for accessing the report?
Pricing options include single-user, multi-user, and enterprise licenses priced at USD 3350.00, USD 5025.00, and USD 6700.00 respectively.
10. Is the market size provided in terms of value or volume?
The market size is provided in terms of value, measured in N/A and volume, measured in K.
11. Are there any specific market keywords associated with the report?
Yes, the market keyword associated with the report is "Grease Proof Paper," which aids in identifying and referencing the specific market segment covered.
12. How do I determine which pricing option suits my needs best?
The pricing options vary based on user requirements and access needs. Individual users may opt for single-user licenses, while businesses requiring broader access may choose multi-user or enterprise licenses for cost-effective access to the report.
13. Are there any additional resources or data provided in the Grease Proof Paper report?
While the report offers comprehensive insights, it's advisable to review the specific contents or supplementary materials provided to ascertain if additional resources or data are available.
14. How can I stay updated on further developments or reports in the Grease Proof Paper?
To stay informed about further developments, trends, and reports in the Grease Proof Paper, consider subscribing to industry newsletters, following relevant companies and organizations, or regularly checking reputable industry news sources and publications.
Methodology
Step 1 - Identification of Relevant Samples Size from Population Database


Step 2 - Approaches for Defining Global Market Size (Value, Volume* & Price*)

Note*: In applicable scenarios
Step 3 - Data Sources
Primary Research
- Web Analytics
- Survey Reports
- Research Institute
- Latest Research Reports
- Opinion Leaders
Secondary Research
- Annual Reports
- White Paper
- Latest Press Release
- Industry Association
- Paid Database
- Investor Presentations

Step 4 - Data Triangulation
Involves using different sources of information in order to increase the validity of a study
These sources are likely to be stakeholders in a program - participants, other researchers, program staff, other community members, and so on.
Then we put all data in single framework & apply various statistical tools to find out the dynamic on the market.
During the analysis stage, feedback from the stakeholder groups would be compared to determine areas of agreement as well as areas of divergence