

Key Insights
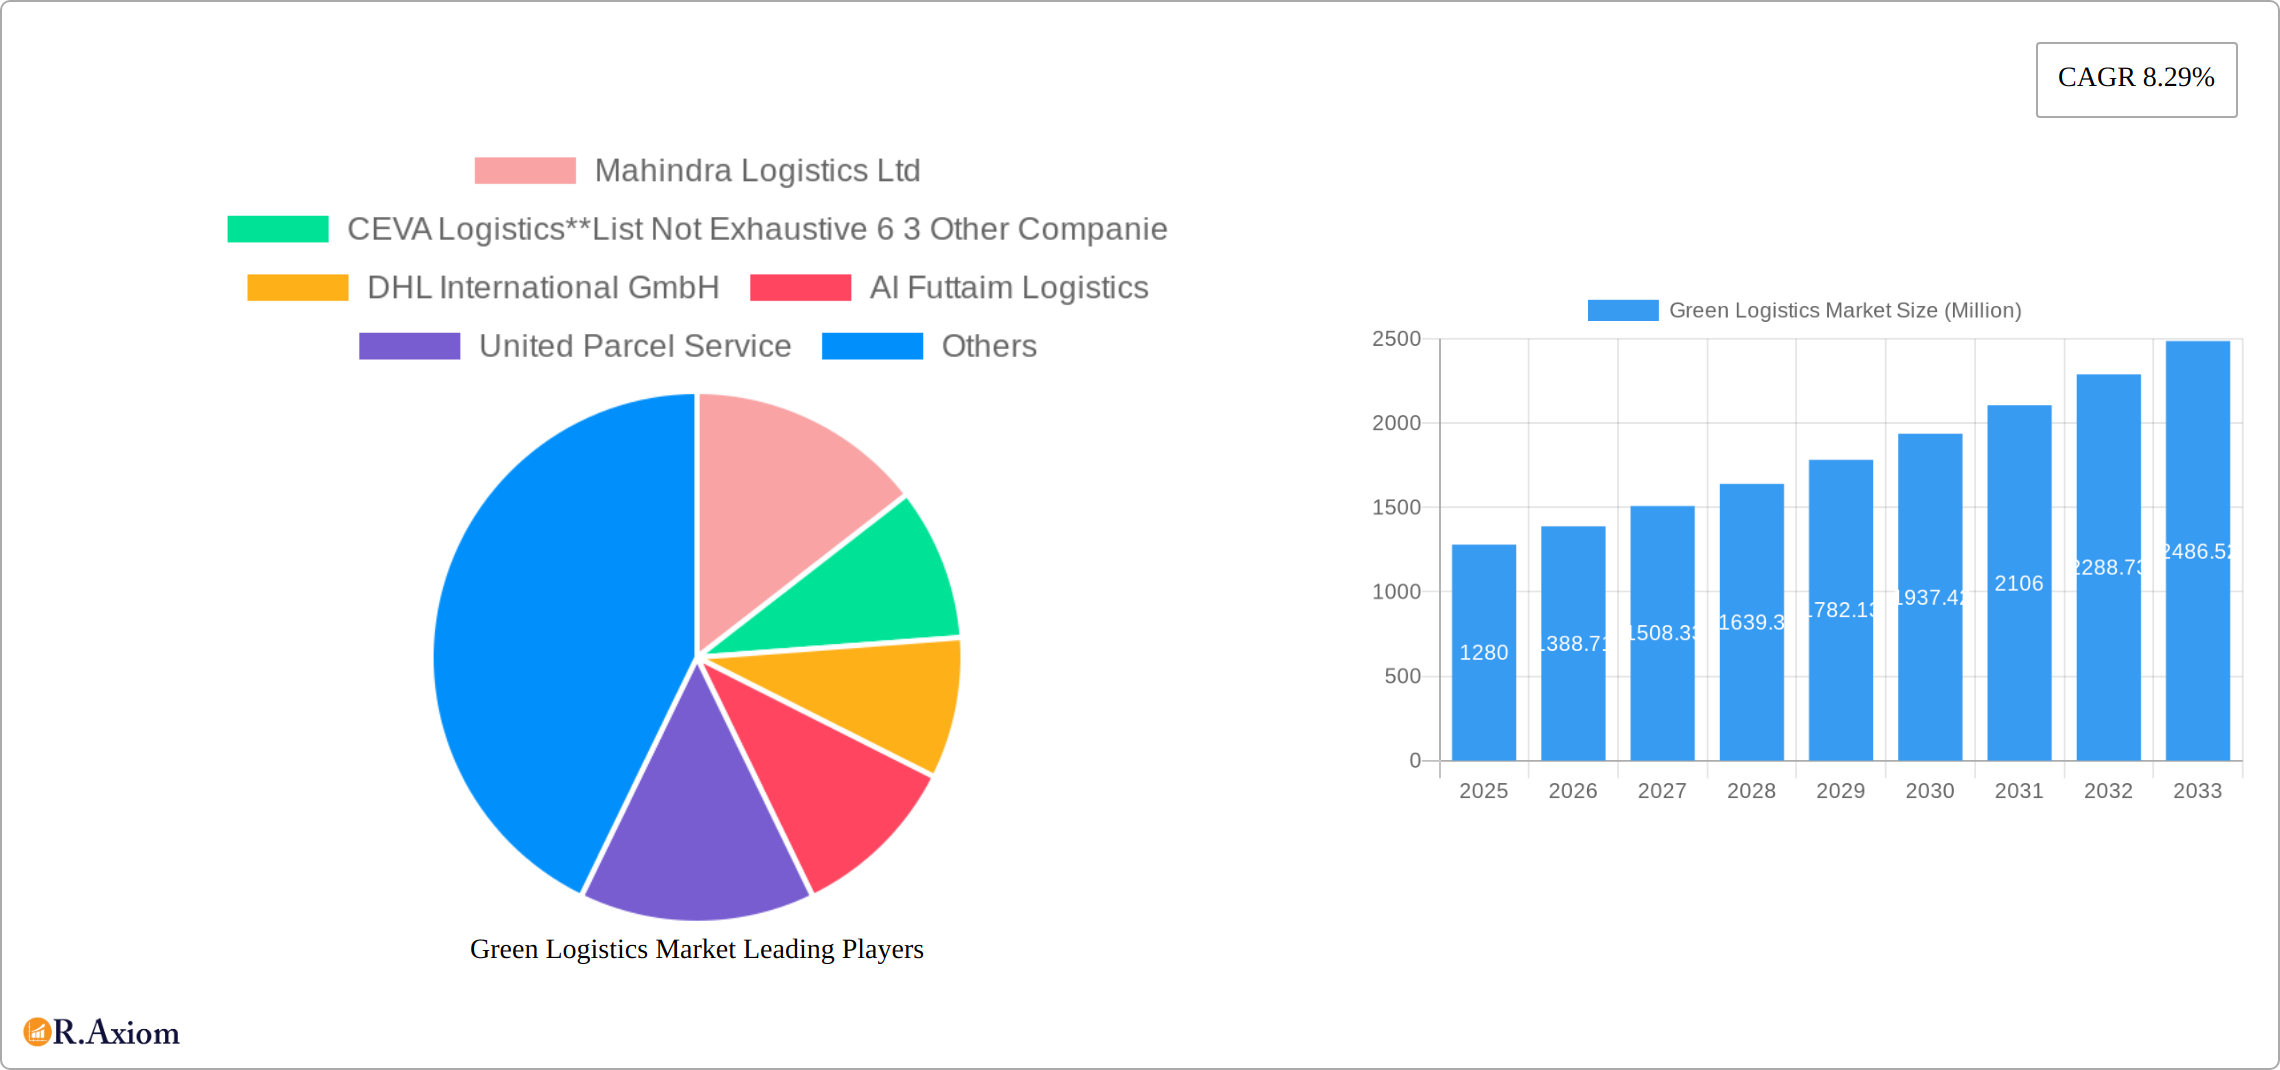
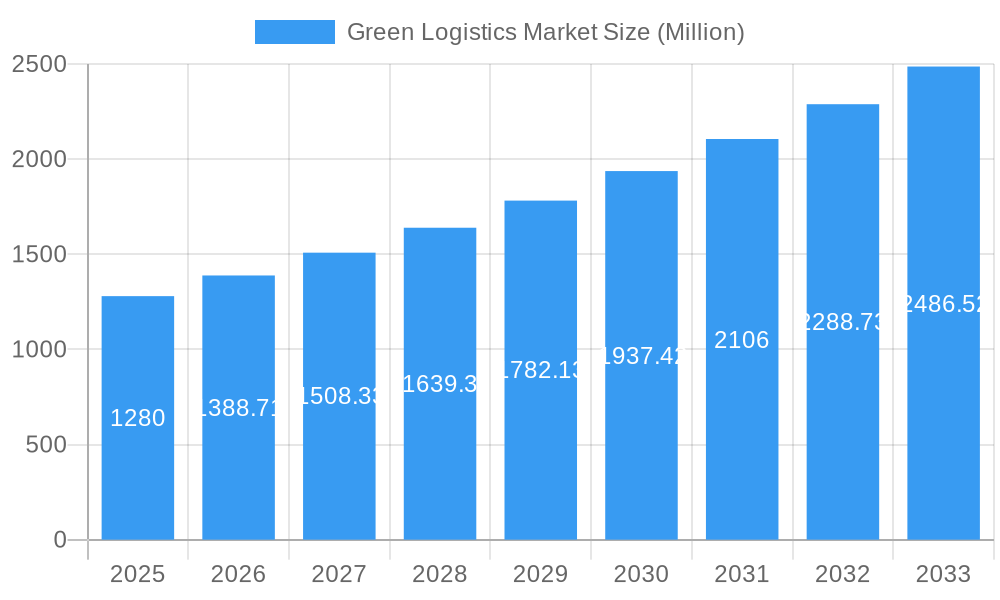
The global green logistics market, valued at $1.28 billion in 2025, is projected to experience robust growth, driven by increasing environmental concerns, stringent government regulations, and the rising adoption of sustainable practices across various industries. The Compound Annual Growth Rate (CAGR) of 8.29% from 2025 to 2033 signifies a significant market expansion, fueled by the growing demand for eco-friendly transportation and warehousing solutions. Key drivers include the escalating costs associated with carbon emissions, the push for corporate social responsibility (CSR) initiatives, and advancements in green technologies such as electric vehicles, alternative fuels, and optimized route planning software. Market segmentation reveals significant opportunities across end-user sectors like healthcare, manufacturing, and e-commerce, each prioritizing sustainability for operational efficiency and brand image. The warehousing and distribution segments within the business type category represent substantial market shares, reflecting the increasing need for green solutions throughout the entire supply chain. Furthermore, the shift towards roadways distribution, while still dominant, is gradually being complemented by increased adoption of seaways distribution for long-haul movements, aligning with broader sustainability goals. While challenges remain, such as the higher initial investment costs associated with green technologies and the need for wider infrastructure development, the overall market trajectory indicates a promising future for environmentally conscious logistics solutions.
Green Logistics Market Market Size (In Billion)
The competitive landscape is characterized by a mix of established global players like DHL, UPS, and Ceva Logistics, alongside regional and specialized companies. These companies are strategically investing in research and development, partnerships, and acquisitions to expand their green logistics offerings and capture market share. Regional variations exist, with North America and Europe currently leading the market, driven by strong regulatory frameworks and corporate sustainability initiatives. However, the Asia-Pacific region is poised for significant growth, fueled by rapid economic development and rising environmental awareness. Future growth will depend on continued technological innovation, favorable government policies, and a sustained commitment from businesses to embrace sustainable practices throughout their supply chain operations. The long-term outlook remains positive, with significant potential for market expansion as the global focus on sustainability intensifies.
Green Logistics Market Company Market Share
Green Logistics Market: A Comprehensive Report, 2019-2033
This comprehensive report provides a detailed analysis of the Green Logistics Market from 2019 to 2033, offering invaluable insights for industry stakeholders. The study covers market size, segmentation, key players, growth drivers, challenges, and emerging opportunities, equipping readers with a robust understanding of this dynamic sector. The report uses 2025 as the base year and forecasts market trends until 2033, drawing on historical data from 2019-2024. The market is segmented by end-user, business type, and mode of operation, providing a granular view of its composition and future trajectory. Expected market value (in Million) is provided throughout the report where available; otherwise, 'xx' indicates data unavailable at this time.
Green Logistics Market Concentration & Innovation
This section analyzes the competitive landscape of the Green Logistics Market, examining market concentration, innovation drivers, regulatory frameworks, product substitutes, end-user trends, and mergers and acquisitions (M&A) activities. The market exhibits a moderately concentrated structure, with several key players holding significant market share. For example, DHL International GmbH and United Parcel Service (UPS) are estimated to hold xx% and xx% respectively of the global market in 2025. However, several smaller companies are also making significant contributions, driving innovation and increasing competition.
- Market Share: DHL International GmbH (xx%), United Parcel Service (xx%), Mahindra Logistics Ltd (xx%), CEVA Logistics (xx%), others (xx%).
- M&A Activity: The Green Logistics Market has witnessed significant M&A activity in recent years, with deal values totaling xx Million in 2024. These transactions reflect the increasing consolidation within the sector and the pursuit of economies of scale. Specific examples include [mention any available M&A deals with values if available, otherwise use "xx Million"]. Such deals significantly shape the competitive landscape and market share distribution.
- Innovation Drivers: Government regulations promoting sustainable practices, consumer demand for eco-friendly solutions, and technological advancements in areas such as electric vehicles and alternative fuels are major innovation drivers.
- Regulatory Frameworks: Stringent environmental regulations in several regions are driving the adoption of green logistics solutions, creating both opportunities and challenges for market players.
- Product Substitutes: While direct substitutes are limited, the use of traditional logistics methods represents a key substitute. The competitiveness of green options relies on reducing the price differential compared to traditional solutions.
- End-User Trends: The increasing demand for sustainable supply chains across various end-user industries, including healthcare, e-commerce, and manufacturing, is fueling the growth of the Green Logistics Market.
Green Logistics Market Industry Trends & Insights
The Green Logistics Market is experiencing significant growth, driven by several key factors. The increasing awareness of environmental concerns, coupled with stricter regulations on carbon emissions, is pushing businesses to adopt more sustainable practices. Technological advancements, such as the development of electric vehicles and alternative fuels, are also contributing to market expansion. The market is expected to grow at a CAGR of xx% during the forecast period (2025-2033), reaching a market value of xx Million by 2033. Market penetration of green logistics solutions remains relatively low, presenting substantial growth potential. However, challenges such as high initial investment costs for green technologies and the need for robust infrastructure to support the transition are hindering wider adoption. Competitive dynamics are characterized by a mix of established players and emerging startups, leading to both collaboration and competition. Consumer preferences are shifting towards brands that prioritize sustainability, putting pressure on companies to adopt green logistics solutions.
Dominant Markets & Segments in Green Logistics Market
The Green Logistics Market is geographically diverse, with significant growth opportunities across different regions and segments.
- By End-User: The Retail and E-commerce segment is projected to be the dominant end-user segment, driven by the rapid growth of online shopping and the increasing demand for fast and sustainable delivery services. The healthcare segment also demonstrates significant growth potential due to the need for timely and reliable transportation of temperature-sensitive pharmaceutical products.
- By Business Type: The warehousing segment holds a substantial market share due to the increasing demand for environmentally friendly warehousing solutions, focusing on energy efficiency and reduced carbon footprints. Value-added services are gaining traction, offering specialized solutions for sustainable packaging and supply chain optimization.
- By Mode of Operation: Roadways distribution is currently the most dominant mode of operation; however, the seaways distribution segment shows significant growth potential, driven by the increasing adoption of eco-friendly shipping methods.
- Key Drivers: Government incentives and supportive policies, increasing investment in green infrastructure, and technological advancements play a significant role in segment dominance.
Regional Dominance: [Insert analysis of regional dominance, identifying leading regions and countries based on market size and growth projections, supported by factors like economic strength, infrastructure development, and government policies].
Green Logistics Market Product Developments
Recent product innovations in the Green Logistics Market focus on optimizing efficiency and reducing environmental impact. This includes the development of electric and hybrid vehicles, alternative fuel options (e.g., biofuels, hydrogen), improved route optimization software that minimizes fuel consumption and emissions, and the implementation of sustainable packaging solutions. These developments are designed to enhance the competitiveness of green logistics solutions by offering cost savings and improved environmental performance. Technological trends indicate a move towards automation, data-driven decision-making, and the integration of renewable energy sources into logistics operations.
Report Scope & Segmentation Analysis
This report provides a comprehensive analysis of the Green Logistics Market, segmented by:
- By End-User: Healthcare, Manufacturing, Automotive, Banking and Financial Services, Retail and E-commerce, Others (Growth projections and market sizes for each segment are detailed in the full report). Competitive dynamics vary across segments, reflecting the specific needs and priorities of each industry.
- By Business Type: Warehousing, Distribution, Value-Added Services (Growth projections and market sizes for each segment are provided in the full report). The competitive landscape in each business type is influenced by factors such as technological capabilities, service offerings, and operational efficiency.
- By Mode of Operation: Storage, Roadways Distribution, Seaways Distribution, Others (Growth projections and market sizes for each segment are provided in the full report). The mode of operation significantly impacts the environmental footprint of logistics activities, driving innovation in each area.
Key Drivers of Green Logistics Market Growth
The ascent of the Green Logistics Market is propelled by a confluence of potent forces. Foremost among these is the escalating global awareness of environmental degradation, coupled with increasingly stringent governmental regulations and international accords aimed at curbing carbon emissions. This has compelled industries worldwide to re-evaluate and overhaul their logistical footprints, prioritizing sustainability. Technological innovation plays a pivotal role, with continuous advancements in areas such as electric and hydrogen-powered vehicles, biofuels, and sophisticated route optimization software making greener alternatives more accessible and cost-effective. Furthermore, a significant shift in consumer behavior, characterized by a heightened preference for products and services from eco-conscious brands, is exerting considerable pressure on businesses to adopt sustainable supply chain practices. Beyond environmental imperatives, the economic advantages of green logistics are becoming increasingly evident, with substantial long-term cost savings realized through reduced fuel expenditures, optimized energy consumption, and streamlined operational efficiencies.
Challenges in the Green Logistics Market Sector
Despite its promising trajectory, the Green Logistics Market confronts several formidable hurdles. A primary impediment is the substantial upfront capital investment required for the adoption of advanced green technologies and infrastructure, which can present a significant barrier, particularly for small and medium-sized enterprises (SMEs). The existing logistical infrastructure in many regions is not yet adequately equipped to support widespread adoption of sustainable solutions, necessitating substantial upgrades and new developments. Moreover, the established dominance of traditional, less sustainable logistics providers often results in intense price competition, forcing green logistics solutions to demonstrate clear cost-effectiveness to gain traction. The complexity of global supply chains also presents challenges in standardizing and implementing green practices uniformly across all touchpoints. Finally, a lack of comprehensive and standardized metrics for measuring the environmental impact of logistics can make it difficult for businesses to effectively track progress and communicate their sustainability efforts.
Emerging Opportunities in Green Logistics Market
The dynamic Green Logistics Market is rife with exciting new opportunities for innovation and expansion. The booming e-commerce sector, with its ever-increasing demand for efficient and timely last-mile deliveries, presents a prime area for the deployment of electric vans, cargo bikes, and micro-fulfillment centers within urban environments, significantly reducing congestion and emissions. The integration of cutting-edge technologies like Artificial Intelligence (AI) and the Internet of Things (IoT) is unlocking new possibilities for predictive maintenance, real-time monitoring of fleet performance, and intelligent route planning, all contributing to enhanced efficiency and reduced environmental impact. The burgeoning field of circular economy logistics, focusing on reverse logistics for product returns, recycling, and refurbishment, offers a significant avenue for sustainability. Furthermore, the development of innovative carbon capture and utilization technologies within logistics operations, alongside the growth of carbon credit markets specifically for transportation, provides businesses with new pathways to offset their environmental footprint and generate value from their sustainability initiatives.
Leading Players in the Green Logistics Market
- Mahindra Logistics Ltd
- CEVA Logistics
- DHL International GmbH
- AI Futtaim Logistics
- United Parcel Service
- Yusen Logistics Co Ltd
- GEODIS
- XPO Logistics
- Agility Public Warehousing Company K S C P
- Bollore Logistics
- Bowling Green Logistics
Key Developments in Green Logistics Market Industry
- 2023 Q4: UPS announces a major expansion of its electric vehicle fleet, aiming for 10,000 EVs by 2025. - Impact: Significant reduction in carbon emissions for last-mile deliveries and increased market presence of electric delivery vehicles.
- 2024 Q1: Maersk launches a new series of methanol-powered container ships, marking a significant step towards decarbonizing ocean freight. - Impact: Sets a new industry standard for sustainable maritime shipping and influences fuel sourcing strategies.
- 2024 Q2: Amazon invests heavily in renewable energy sources to power its fulfillment centers and transportation networks. - Impact: Enhances the sustainability of its vast e-commerce operations and drives demand for green energy in logistics.
- 2024 Q3: The European Union introduces stricter emissions standards for commercial vehicles, accelerating the transition to cleaner technologies. - Impact: Stimulates innovation and investment in zero-emission vehicles and related infrastructure within the EU market.
- Continue adding key developments with year/month and their impact
Strategic Outlook for Green Logistics Market
The Green Logistics Market is on an undeniable upward trajectory, fueled by a powerful combination of increasing environmental consciousness, robust governmental support, and relentless technological advancement. The global imperative to transition towards a low-carbon economy is fundamentally reshaping industrial operations, creating vast opportunities for companies to pioneer and implement groundbreaking green logistics solutions. The growing emphasis on Environmental, Social, and Governance (ESG) factors in investment decisions further amplifies the attractiveness of sustainable logistics. Businesses that proactively embrace innovation, strategically invest in eco-friendly technologies, optimize their supply chain networks for efficiency and sustainability, and keenly adapt to evolving regulatory landscapes and consumer expectations are exceptionally well-positioned to not only capture a substantial share of this expanding market but also to lead the industry towards a more responsible and resilient future.
Green Logistics Market Segmentation
-
1. End User
- 1.1. Healthcare
- 1.2. Manufacturing
- 1.3. Automotive
- 1.4. Banking and Financial services
- 1.5. Retail and E-commerce
- 1.6. Others
-
2. Business Type
- 2.1. Warehousing
- 2.2. Distribution
- 2.3. Value-Added Services
-
3. Mode of Operation
- 3.1. Storage
- 3.2. Roadways Distribution
- 3.3. Seaways Distribution
- 3.4. Others
Green Logistics Market Segmentation By Geography
-
1. North America
- 1.1. US
- 1.2. Canada
- 1.3. Mexico
-
2. Europe
- 2.1. Germany
- 2.2. UK
- 2.3. France
- 2.4. Russia
- 2.5. Spain
- 2.6. Rest of Europe
-
3. Asia Pacific
- 3.1. India
- 3.2. China
- 3.3. Japan
- 3.4. South Korea
- 3.5. Rest of Asia Pacific
-
4. LAMEA
- 4.1. Latin America
- 4.2. Middle East
- 4.3. Africa
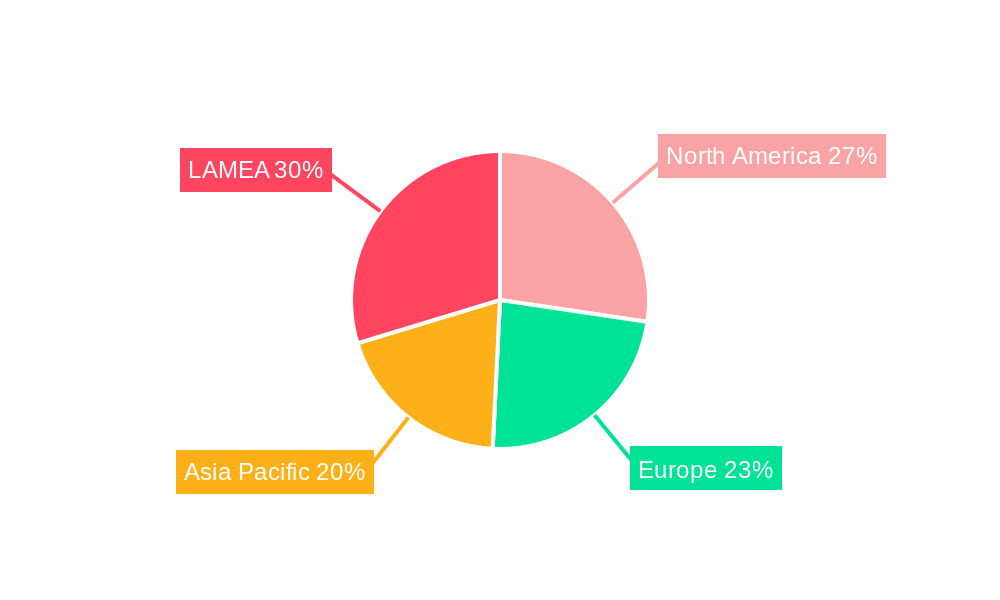
Green Logistics Market Regional Market Share
Geographic Coverage of Green Logistics Market
Green Logistics Market REPORT HIGHLIGHTS
| Aspects | Details |
|---|---|
| Study Period | 2020-2034 |
| Base Year | 2025 |
| Estimated Year | 2026 |
| Forecast Period | 2026-2034 |
| Historical Period | 2020-2025 |
| Growth Rate | CAGR of 8.29% from 2020-2034 |
| Segmentation |
|
Table of Contents
- 1. Introduction
- 1.1. Research Scope
- 1.2. Market Segmentation
- 1.3. Research Objective
- 1.4. Definitions and Assumptions
- 2. Executive Summary
- 2.1. Market Snapshot
- 3. Market Dynamics
- 3.1. Market Drivers
- 3.2. Market Restrains
- 3.3. Market Trends
- 3.4. Market Opportunities
- 4. Market Factor Analysis
- 4.1. Porters Five Forces
- 4.1.1. Bargaining Power of Suppliers
- 4.1.2. Bargaining Power of Buyers
- 4.1.3. Threat of New Entrants
- 4.1.4. Threat of Substitutes
- 4.1.5. Competitive Rivalry
- 4.2. PESTEL analysis
- 4.3. BCG Analysis
- 4.3.1. Stars (High Growth, High Market Share)
- 4.3.2. Cash Cows (Low Growth, High Market Share)
- 4.3.3. Question Mark (High Growth, Low Market Share)
- 4.3.4. Dogs (Low Growth, Low Market Share)
- 4.4. Ansoff Matrix Analysis
- 4.5. Supply Chain Analysis
- 4.6. Regulatory Landscape
- 4.7. Current Market Potential and Opportunity Assessment (TAM–SAM–SOM Framework)
- 4.8. RAX Analyst Note
- 4.1. Porters Five Forces
- 5. Market Analysis, Insights and Forecast 2021-2033
- 5.1. Market Analysis, Insights and Forecast - by End User
- 5.1.1. Healthcare
- 5.1.2. Manufacturing
- 5.1.3. Automotive
- 5.1.4. Banking and Financial services
- 5.1.5. Retail and E-commerce
- 5.1.6. Others
- 5.2. Market Analysis, Insights and Forecast - by Business Type
- 5.2.1. Warehousing
- 5.2.2. Distribution
- 5.2.3. Value-Added Services
- 5.3. Market Analysis, Insights and Forecast - by Mode of Operation
- 5.3.1. Storage
- 5.3.2. Roadways Distribution
- 5.3.3. Seaways Distribution
- 5.3.4. Others
- 5.4. Market Analysis, Insights and Forecast - by Region
- 5.4.1. North America
- 5.4.2. Europe
- 5.4.3. Asia Pacific
- 5.4.4. LAMEA
- 5.1. Market Analysis, Insights and Forecast - by End User
- 6. Green Logistics Market Analysis, Insights and Forecast, 2021-2033
- 6.1. Market Analysis, Insights and Forecast - by End User
- 6.1.1. Healthcare
- 6.1.2. Manufacturing
- 6.1.3. Automotive
- 6.1.4. Banking and Financial services
- 6.1.5. Retail and E-commerce
- 6.1.6. Others
- 6.2. Market Analysis, Insights and Forecast - by Business Type
- 6.2.1. Warehousing
- 6.2.2. Distribution
- 6.2.3. Value-Added Services
- 6.3. Market Analysis, Insights and Forecast - by Mode of Operation
- 6.3.1. Storage
- 6.3.2. Roadways Distribution
- 6.3.3. Seaways Distribution
- 6.3.4. Others
- 6.1. Market Analysis, Insights and Forecast - by End User
- 7. North America Green Logistics Market Analysis, Insights and Forecast, 2020-2032
- 7.1. Market Analysis, Insights and Forecast - by End User
- 7.1.1. Healthcare
- 7.1.2. Manufacturing
- 7.1.3. Automotive
- 7.1.4. Banking and Financial services
- 7.1.5. Retail and E-commerce
- 7.1.6. Others
- 7.2. Market Analysis, Insights and Forecast - by Business Type
- 7.2.1. Warehousing
- 7.2.2. Distribution
- 7.2.3. Value-Added Services
- 7.3. Market Analysis, Insights and Forecast - by Mode of Operation
- 7.3.1. Storage
- 7.3.2. Roadways Distribution
- 7.3.3. Seaways Distribution
- 7.3.4. Others
- 7.1. Market Analysis, Insights and Forecast - by End User
- 8. Europe Green Logistics Market Analysis, Insights and Forecast, 2020-2032
- 8.1. Market Analysis, Insights and Forecast - by End User
- 8.1.1. Healthcare
- 8.1.2. Manufacturing
- 8.1.3. Automotive
- 8.1.4. Banking and Financial services
- 8.1.5. Retail and E-commerce
- 8.1.6. Others
- 8.2. Market Analysis, Insights and Forecast - by Business Type
- 8.2.1. Warehousing
- 8.2.2. Distribution
- 8.2.3. Value-Added Services
- 8.3. Market Analysis, Insights and Forecast - by Mode of Operation
- 8.3.1. Storage
- 8.3.2. Roadways Distribution
- 8.3.3. Seaways Distribution
- 8.3.4. Others
- 8.1. Market Analysis, Insights and Forecast - by End User
- 9. Asia Pacific Green Logistics Market Analysis, Insights and Forecast, 2020-2032
- 9.1. Market Analysis, Insights and Forecast - by End User
- 9.1.1. Healthcare
- 9.1.2. Manufacturing
- 9.1.3. Automotive
- 9.1.4. Banking and Financial services
- 9.1.5. Retail and E-commerce
- 9.1.6. Others
- 9.2. Market Analysis, Insights and Forecast - by Business Type
- 9.2.1. Warehousing
- 9.2.2. Distribution
- 9.2.3. Value-Added Services
- 9.3. Market Analysis, Insights and Forecast - by Mode of Operation
- 9.3.1. Storage
- 9.3.2. Roadways Distribution
- 9.3.3. Seaways Distribution
- 9.3.4. Others
- 9.1. Market Analysis, Insights and Forecast - by End User
- 10. LAMEA Green Logistics Market Analysis, Insights and Forecast, 2020-2032
- 10.1. Market Analysis, Insights and Forecast - by End User
- 10.1.1. Healthcare
- 10.1.2. Manufacturing
- 10.1.3. Automotive
- 10.1.4. Banking and Financial services
- 10.1.5. Retail and E-commerce
- 10.1.6. Others
- 10.2. Market Analysis, Insights and Forecast - by Business Type
- 10.2.1. Warehousing
- 10.2.2. Distribution
- 10.2.3. Value-Added Services
- 10.3. Market Analysis, Insights and Forecast - by Mode of Operation
- 10.3.1. Storage
- 10.3.2. Roadways Distribution
- 10.3.3. Seaways Distribution
- 10.3.4. Others
- 10.1. Market Analysis, Insights and Forecast - by End User
- 11. Competitive Analysis
- 11.1. Company Profiles
- 11.1.1 Mahindra Logistics Ltd
- 11.1.1.1. Company Overview
- 11.1.1.2. Products
- 11.1.1.3. Company Financials
- 11.1.1.4. SWOT Analysis
- 11.1.2 CEVA Logistics**List Not Exhaustive 6 3 Other Companie
- 11.1.2.1. Company Overview
- 11.1.2.2. Products
- 11.1.2.3. Company Financials
- 11.1.2.4. SWOT Analysis
- 11.1.3 DHL International GmbH
- 11.1.3.1. Company Overview
- 11.1.3.2. Products
- 11.1.3.3. Company Financials
- 11.1.3.4. SWOT Analysis
- 11.1.4 AI Futtaim Logistics
- 11.1.4.1. Company Overview
- 11.1.4.2. Products
- 11.1.4.3. Company Financials
- 11.1.4.4. SWOT Analysis
- 11.1.5 United Parcel Service
- 11.1.5.1. Company Overview
- 11.1.5.2. Products
- 11.1.5.3. Company Financials
- 11.1.5.4. SWOT Analysis
- 11.1.6 Yusen Logistics Co Ltd
- 11.1.6.1. Company Overview
- 11.1.6.2. Products
- 11.1.6.3. Company Financials
- 11.1.6.4. SWOT Analysis
- 11.1.7 GEODIS
- 11.1.7.1. Company Overview
- 11.1.7.2. Products
- 11.1.7.3. Company Financials
- 11.1.7.4. SWOT Analysis
- 11.1.8 XPO Logistics
- 11.1.8.1. Company Overview
- 11.1.8.2. Products
- 11.1.8.3. Company Financials
- 11.1.8.4. SWOT Analysis
- 11.1.9 Agility Public Warehousing Company K S C P
- 11.1.9.1. Company Overview
- 11.1.9.2. Products
- 11.1.9.3. Company Financials
- 11.1.9.4. SWOT Analysis
- 11.1.10 Bollore Logistics
- 11.1.10.1. Company Overview
- 11.1.10.2. Products
- 11.1.10.3. Company Financials
- 11.1.10.4. SWOT Analysis
- 11.1.11 Bowling Green Logistics
- 11.1.11.1. Company Overview
- 11.1.11.2. Products
- 11.1.11.3. Company Financials
- 11.1.11.4. SWOT Analysis
- 11.1.1 Mahindra Logistics Ltd
- 11.2. Market Entropy
- 11.2.1 Company's Key Areas Served
- 11.2.2 Recent Developments
- 11.3. Company Market Share Analysis 2025
- 11.3.1 Top 5 Companies Market Share Analysis
- 11.3.2 Top 3 Companies Market Share Analysis
- 11.4. List of Potential Customers
- 12. Research Methodology
List of Figures
- Figure 1: Green Logistics Market Revenue Breakdown (Million, %) by Product 2025 & 2033
- Figure 2: Green Logistics Market Share (%) by Company 2025
List of Tables
- Table 1: Green Logistics Market Revenue Million Forecast, by End User 2020 & 2033
- Table 2: Green Logistics Market Revenue Million Forecast, by Business Type 2020 & 2033
- Table 3: Green Logistics Market Revenue Million Forecast, by Mode of Operation 2020 & 2033
- Table 4: Green Logistics Market Revenue Million Forecast, by Region 2020 & 2033
- Table 5: Green Logistics Market Revenue Million Forecast, by End User 2020 & 2033
- Table 6: Green Logistics Market Revenue Million Forecast, by Business Type 2020 & 2033
- Table 7: Green Logistics Market Revenue Million Forecast, by Mode of Operation 2020 & 2033
- Table 8: Green Logistics Market Revenue Million Forecast, by Country 2020 & 2033
- Table 9: US Green Logistics Market Revenue (Million) Forecast, by Application 2020 & 2033
- Table 10: Canada Green Logistics Market Revenue (Million) Forecast, by Application 2020 & 2033
- Table 11: Mexico Green Logistics Market Revenue (Million) Forecast, by Application 2020 & 2033
- Table 12: Green Logistics Market Revenue Million Forecast, by End User 2020 & 2033
- Table 13: Green Logistics Market Revenue Million Forecast, by Business Type 2020 & 2033
- Table 14: Green Logistics Market Revenue Million Forecast, by Mode of Operation 2020 & 2033
- Table 15: Green Logistics Market Revenue Million Forecast, by Country 2020 & 2033
- Table 16: Germany Green Logistics Market Revenue (Million) Forecast, by Application 2020 & 2033
- Table 17: UK Green Logistics Market Revenue (Million) Forecast, by Application 2020 & 2033
- Table 18: France Green Logistics Market Revenue (Million) Forecast, by Application 2020 & 2033
- Table 19: Russia Green Logistics Market Revenue (Million) Forecast, by Application 2020 & 2033
- Table 20: Spain Green Logistics Market Revenue (Million) Forecast, by Application 2020 & 2033
- Table 21: Rest of Europe Green Logistics Market Revenue (Million) Forecast, by Application 2020 & 2033
- Table 22: Green Logistics Market Revenue Million Forecast, by End User 2020 & 2033
- Table 23: Green Logistics Market Revenue Million Forecast, by Business Type 2020 & 2033
- Table 24: Green Logistics Market Revenue Million Forecast, by Mode of Operation 2020 & 2033
- Table 25: Green Logistics Market Revenue Million Forecast, by Country 2020 & 2033
- Table 26: India Green Logistics Market Revenue (Million) Forecast, by Application 2020 & 2033
- Table 27: China Green Logistics Market Revenue (Million) Forecast, by Application 2020 & 2033
- Table 28: Japan Green Logistics Market Revenue (Million) Forecast, by Application 2020 & 2033
- Table 29: South Korea Green Logistics Market Revenue (Million) Forecast, by Application 2020 & 2033
- Table 30: Rest of Asia Pacific Green Logistics Market Revenue (Million) Forecast, by Application 2020 & 2033
- Table 31: Green Logistics Market Revenue Million Forecast, by End User 2020 & 2033
- Table 32: Green Logistics Market Revenue Million Forecast, by Business Type 2020 & 2033
- Table 33: Green Logistics Market Revenue Million Forecast, by Mode of Operation 2020 & 2033
- Table 34: Green Logistics Market Revenue Million Forecast, by Country 2020 & 2033
- Table 35: Latin America Green Logistics Market Revenue (Million) Forecast, by Application 2020 & 2033
- Table 36: Middle East Green Logistics Market Revenue (Million) Forecast, by Application 2020 & 2033
- Table 37: Africa Green Logistics Market Revenue (Million) Forecast, by Application 2020 & 2033
Frequently Asked Questions
1. What is the projected Compound Annual Growth Rate (CAGR) of the Green Logistics Market?
The projected CAGR is approximately 8.29%.
2. Which companies are prominent players in the Green Logistics Market?
Key companies in the market include Mahindra Logistics Ltd, CEVA Logistics**List Not Exhaustive 6 3 Other Companie, DHL International GmbH, AI Futtaim Logistics, United Parcel Service, Yusen Logistics Co Ltd, GEODIS, XPO Logistics, Agility Public Warehousing Company K S C P, Bollore Logistics, Bowling Green Logistics.
3. What are the main segments of the Green Logistics Market?
The market segments include End User, Business Type, Mode of Operation.
4. Can you provide details about the market size?
The market size is estimated to be USD 1.28 Million as of 2022.
5. What are some drivers contributing to market growth?
Growing adoption of EVs in the logistics industry; Increase in adoption of artificial intelligence (AI) in the global logistics industry.
6. What are the notable trends driving market growth?
The Demand for Green Warehouses is Rising.
7. Are there any restraints impacting market growth?
Dependency on fossil fuels. majority for transportation; The high costs of implementing green procurement practices discourage potential investors.
8. Can you provide examples of recent developments in the market?
N/A
9. What pricing options are available for accessing the report?
Pricing options include single-user, multi-user, and enterprise licenses priced at USD 3800, USD 4500, and USD 5800 respectively.
10. Is the market size provided in terms of value or volume?
The market size is provided in terms of value, measured in Million.
11. Are there any specific market keywords associated with the report?
Yes, the market keyword associated with the report is "Green Logistics Market," which aids in identifying and referencing the specific market segment covered.
12. How do I determine which pricing option suits my needs best?
The pricing options vary based on user requirements and access needs. Individual users may opt for single-user licenses, while businesses requiring broader access may choose multi-user or enterprise licenses for cost-effective access to the report.
13. Are there any additional resources or data provided in the Green Logistics Market report?
While the report offers comprehensive insights, it's advisable to review the specific contents or supplementary materials provided to ascertain if additional resources or data are available.
14. How can I stay updated on further developments or reports in the Green Logistics Market?
To stay informed about further developments, trends, and reports in the Green Logistics Market, consider subscribing to industry newsletters, following relevant companies and organizations, or regularly checking reputable industry news sources and publications.
Methodology
Step 1 - Identification of Relevant Samples Size from Population Database


Step 2 - Approaches for Defining Global Market Size (Value, Volume* & Price*)

Note*: In applicable scenarios
Step 3 - Data Sources
Primary Research
- Web Analytics
- Survey Reports
- Research Institute
- Latest Research Reports
- Opinion Leaders
Secondary Research
- Annual Reports
- White Paper
- Latest Press Release
- Industry Association
- Paid Database
- Investor Presentations

Step 4 - Data Triangulation
Involves using different sources of information in order to increase the validity of a study
These sources are likely to be stakeholders in a program - participants, other researchers, program staff, other community members, and so on.
Then we put all data in single framework & apply various statistical tools to find out the dynamic on the market.
During the analysis stage, feedback from the stakeholder groups would be compared to determine areas of agreement as well as areas of divergence