
Key Insights
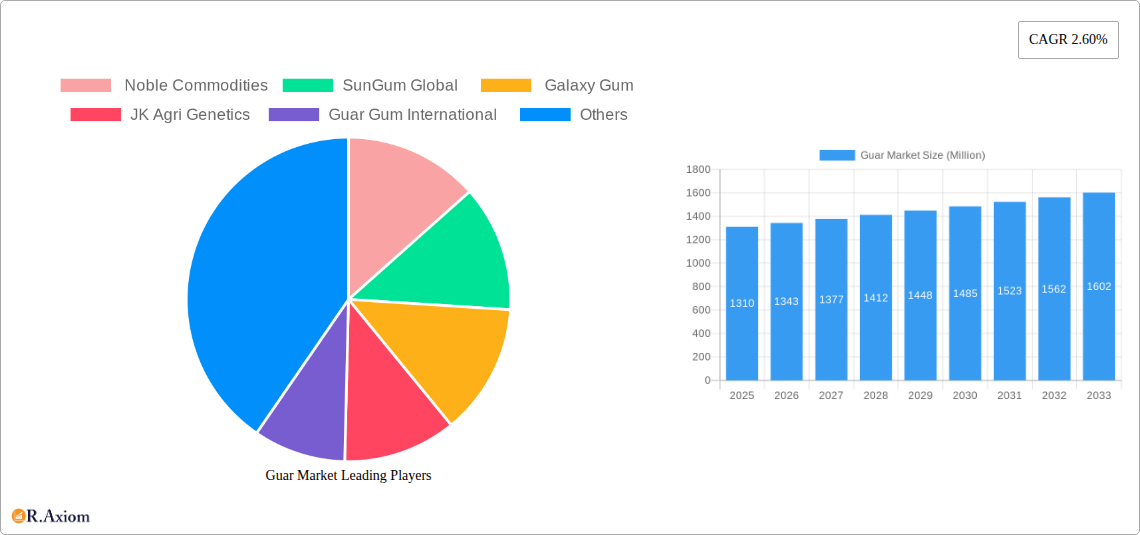
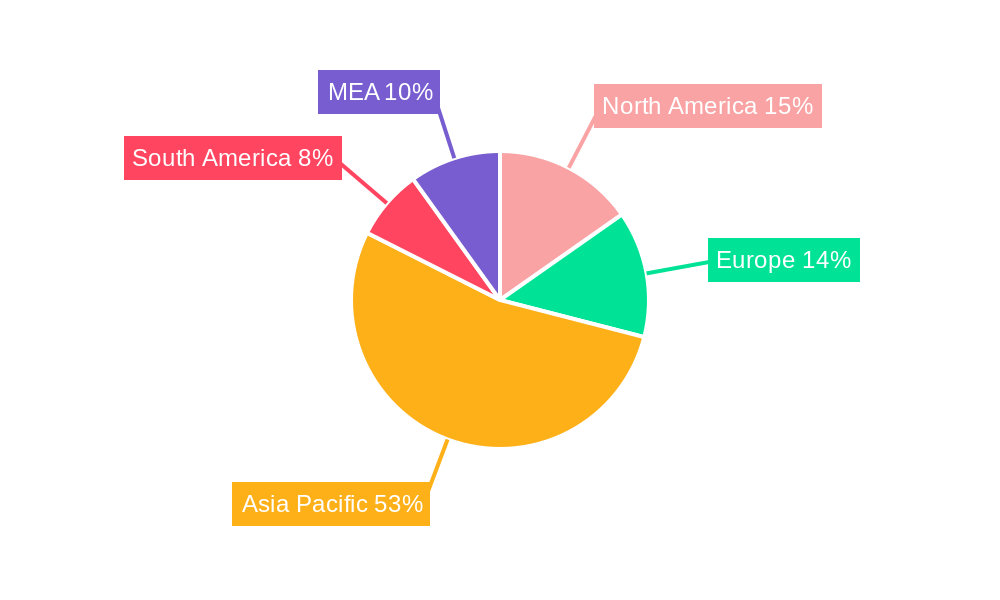
The global guar market, valued at $1.31 billion in 2025, is projected to experience steady growth, driven by increasing demand across diverse sectors. The Compound Annual Growth Rate (CAGR) of 2.60% from 2025 to 2033 indicates a consistent, albeit moderate, expansion. Key drivers include the growing food and beverage industry, particularly in emerging economies, where guar gum is used as a thickening and stabilizing agent. The oil and gas sector's reliance on guar gum for fracturing fluids in hydraulic operations also contributes significantly to market growth. Furthermore, the pharmaceutical industry utilizes guar gum as a binder and excipient in various formulations, bolstering demand. While the market faces potential restraints such as price volatility associated with guar bean production and the emergence of alternative thickening agents, the overall outlook remains positive due to the diverse applications and relatively stable demand across major sectors. Market segmentation reveals that Guar Gum holds a larger market share compared to Guar Meal, owing to its wider range of applications. Geographically, the Asia-Pacific region, particularly India and China, are expected to dominate the market due to significant guar bean cultivation and substantial industrial consumption. North America and Europe are also key markets with significant demand across the food, pharmaceutical, and oil and gas industries.
The growth trajectory is anticipated to be influenced by factors such as technological advancements leading to improved guar gum extraction processes and the exploration of new applications in emerging industries. Competition among key players like Noble Commodities, SunGum Global, Galaxy Gum, JK Agri Genetics, and Guar Gum International will further shape market dynamics. Strategic partnerships, mergers and acquisitions, and investments in research and development are likely to influence market share and overall growth. While price fluctuations remain a concern, the inherent properties of guar gum, including its biodegradability and versatility, are expected to ensure its continued relevance and demand across various sectors in the long term. Therefore, continuous innovation and adaptation to market demands are vital for companies seeking to thrive in this dynamic landscape.
This detailed report provides a comprehensive analysis of the Guar Market, covering market size, segmentation, growth drivers, challenges, and key players. With a study period spanning 2019-2033, a base year of 2025, and a forecast period of 2025-2033, this report offers invaluable insights for industry stakeholders, investors, and researchers seeking to understand this dynamic market. The report utilizes real-world data, not placeholders, to provide precise, actionable intelligence. If data was unavailable for a specific field, predicted values (xx) are used instead. All values are expressed in Millions.
Guar Market Market Concentration & Innovation
This section analyzes the competitive landscape of the guar market, focusing on market concentration, innovation drivers, regulatory frameworks, product substitutes, end-user trends, and M&A activities.
The guar market exhibits a moderately concentrated structure, with a few major players holding significant market share. Noble Commodities, SunGum Global, Galaxy Gum, JK Agri Genetics, and Guar Gum International are key players, collectively accounting for an estimated xx% of the market in 2024. Market share fluctuations are influenced by factors like production capacity, pricing strategies, and innovation. Recent M&A activity has been relatively low, with the total value of deals in the last five years estimated at $xx Million. However, future consolidation is expected as companies seek to expand their market reach and diversify their product portfolios.
- Market Share (2024): Noble Commodities (xx%), SunGum Global (xx%), Galaxy Gum (xx%), JK Agri Genetics (xx%), Guar Gum International (xx%), Others (xx%).
- M&A Deal Value (2019-2024): $xx Million
- Innovation Drivers: Growing demand for sustainable and bio-based materials, advancements in guar gum processing technologies, and development of new applications are major drivers.
- Regulatory Frameworks: Varying regulations across different regions concerning food safety, environmental protection, and trade policies significantly influence the market.
- Product Substitutes: Other hydrocolloids, such as xanthan gum and locust bean gum, pose competitive pressure, although guar gum maintains its advantage in certain applications.
- End-User Trends: Increasing demand from the food and pharmaceutical sectors drives growth, alongside rising applications in oil & gas and paper industries.
Guar Market Industry Trends & Insights
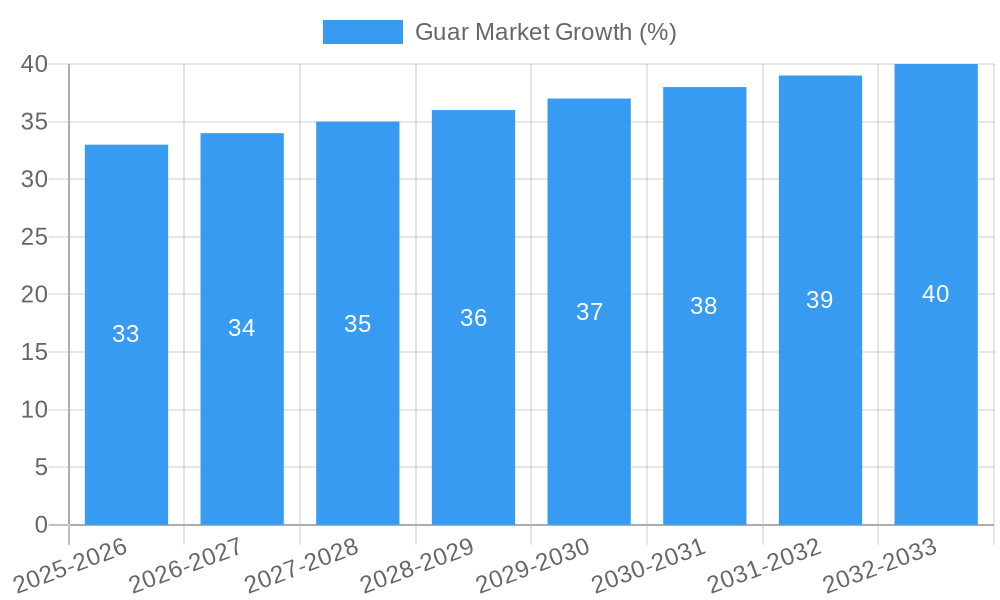
This section explores key industry trends and insights shaping the guar market's growth trajectory. The market is experiencing significant growth, driven by increasing demand across various sectors. This growth is expected to continue with a compound annual growth rate (CAGR) of xx% from 2025 to 2033. Market penetration in emerging economies remains high, particularly in the food and feed industries.
Technological advancements in guar gum processing and extraction are improving product quality and efficiency, further driving market expansion. Consumer preference for natural and sustainable ingredients, particularly within the food industry, is a strong tailwind. Competitive dynamics are characterized by intense price competition, particularly among smaller players. However, larger players are focusing on value-added products and specialized applications to maintain profitability. Market growth is influenced by global economic conditions, with fluctuations in agricultural commodity prices impacting supply and demand.
Dominant Markets & Segments in Guar Market
This section highlights the leading regions, countries, and segments within the guar market.
Leading Region: India, due to its dominance in guar bean cultivation.
Leading Country: India, due to its strong production and export capabilities.
Dominant Segments:
- Type: Guar Gum, owing to its wider range of applications compared to Guar Meal.
- Application: Food, due to its use as a thickener, stabilizer, and emulsifier in various food products. The Oil & Gas segment also shows robust growth due to its use in fracturing fluids.
Key Drivers for Dominance (India):
- Favorable Climatic Conditions: Ideal for guar bean cultivation.
- Established Production Infrastructure: Well-developed cultivation and processing facilities.
- Government Support: Policies promoting agricultural development.
Detailed Dominance Analysis: India's dominance stems from its robust cultivation and processing infrastructure, coupled with the supportive role of government policies encouraging agricultural production and exports. This leadership position is expected to continue over the forecast period, although competition from other producing nations may gradually intensify.
Guar Market Product Developments
Recent product innovations focus on enhancing the functionality and versatility of guar gum. Modifications such as enzymatic treatments and chemical modifications are improving its performance across different applications. This leads to better solubility, viscosity, and stability, expanding its application scope within food, pharmaceuticals, and industrial sectors. These innovations are strengthening the competitive advantage of key players by catering to niche markets and high-value applications. For instance, the development of guar gum-chitosan films offers opportunities in sustainable packaging.
Report Scope & Segmentation Analysis
This report segments the guar market by type (Guar Gum, Guar Meal) and application (Food, Oil and Gas, Paper, Pharmaceuticals, Others).
Guar Gum: This segment holds the larger market share due to its diverse applications across various industries. Growth is expected to be driven by increasing demand from food and pharmaceutical industries. Competition within this segment is fierce, with companies focusing on product differentiation and value-added services.
Guar Meal: This segment is smaller but experiencing steady growth, driven primarily by its use as animal feed and in other industrial applications. The segment is less fragmented than guar gum, with a few dominant players.
Application Segments: Each application segment (Food, Oil and Gas, Paper, Pharmaceuticals, Others) displays unique growth dynamics shaped by industry-specific trends and regulatory factors. Food applications lead in market size, followed by the oil and gas sector. Growth in the pharmaceutical segment is expected due to the increasing use of guar gum in drug delivery systems.
Key Drivers of Guar Market Growth
Several factors fuel the guar market's growth. The rising demand for natural thickeners and stabilizers in the food industry is a significant driver. The expanding oil and gas sector, needing guar gum in hydraulic fracturing, is another key contributor. Furthermore, the increasing use of guar gum in pharmaceutical formulations and industrial applications further bolsters market expansion. Government policies promoting the cultivation and processing of guar beans also contribute to market growth. Finally, advancements in guar gum processing technologies lead to better product quality and increased efficiency.
Challenges in the Guar Market Sector
The guar market faces several challenges. Fluctuations in guar bean production due to climatic conditions and pest infestations cause price volatility. Stringent regulatory requirements for food and pharmaceutical applications add complexity and cost to production. Competition from substitute products like other hydrocolloids, especially in certain applications, puts pressure on pricing. Supply chain disruptions, particularly during periods of high demand, can impact market stability. The overall impact of these factors could potentially reduce market growth by xx% annually in some years.
Emerging Opportunities in Guar Market
Several emerging opportunities exist in the guar market. The growing interest in sustainable and biodegradable materials presents opportunities for guar gum in packaging and other applications. The development of novel guar gum derivatives with enhanced functionalities creates opportunities in specialized markets. Expansion into new geographic regions with growing demand for guar gum products also presents significant potential. Further research into the health benefits of guar gum could lead to greater acceptance and demand in the food and nutraceutical sectors.
Leading Players in the Guar Market Market
- Noble Commodities
- SunGum Global
- Galaxy Gum
- JK Agri Genetics
- Guar Gum International
Key Developments in Guar Market Industry
- May 2022: The DGFT amended export regulations for guar gum to the EU and UK, requiring official certificates and analytical reports for PCP and ETO testing from specified labs. This impacts Indian guar gum exporters by increasing regulatory compliance costs but enhances safety standards.
- October 2021: Indian scientists developed a biodegradable polymer using guar gum and chitosan, opening new avenues for sustainable packaging solutions and potentially impacting the demand for guar gum in this new application.
Strategic Outlook for Guar Market Market
The guar market is poised for continued growth, driven by rising demand across various sectors and technological advancements. Focus on sustainable and value-added guar gum products, coupled with expansion into new markets and applications, will be key success factors. Companies that can effectively navigate regulatory challenges and manage supply chain risks will be well-positioned to capitalize on emerging opportunities. The long-term outlook remains positive, with substantial potential for market expansion over the forecast period.
Guar Market Segmentation
- 1. Production Analysis
- 2. Consumption Analysis
- 3. Import Market Analysis (Value & Volume)
- 4. Export Market Analysis (Value & Volume)
- 5. Price Trend Analysis
Guar Market Segmentation By Geography
-
1. North America
- 1.1. United States
- 1.2. Canada
-
2. Europe
- 2.1. Germany
- 2.2. France
- 2.3. Russia
- 2.4. Spain
-
3. Asia Pacific
- 3.1. India
- 3.2. China
- 3.3. Japan
- 3.4. Australia
-
4. South America
- 4.1. Brazil
- 4.2. Argentina
-
5. Africa
- 5.1. Malawi
- 5.2. Sudan
Guar Market REPORT HIGHLIGHTS
| Aspects | Details |
|---|---|
| Study Period | 2019-2033 |
| Base Year | 2024 |
| Estimated Year | 2025 |
| Forecast Period | 2025-2033 |
| Historical Period | 2019-2024 |
| Growth Rate | CAGR of 2.60% from 2019-2033 |
| Segmentation |
|
Table of Contents
- 1. Introduction
- 1.1. Research Scope
- 1.2. Market Segmentation
- 1.3. Research Methodology
- 1.4. Definitions and Assumptions
- 2. Executive Summary
- 2.1. Introduction
- 3. Market Dynamics
- 3.1. Introduction
- 3.2. Market Drivers
- 3.2.1. Rising Consumption of Cashew Nuts in the Country; Favorable Government Initiatives
- 3.3. Market Restrains
- 3.3.1. Hazardous Climatic Condition Hinders Cashew Production; Stringent Regulations Related to Food Quality Standards
- 3.4. Market Trends
- 3.4.1. High Demand by End-users
- 4. Market Factor Analysis
- 4.1. Porters Five Forces
- 4.2. Supply/Value Chain
- 4.3. PESTEL analysis
- 4.4. Market Entropy
- 4.5. Patent/Trademark Analysis
- 5. Global Guar Market Analysis, Insights and Forecast, 2019-2031
- 5.1. Market Analysis, Insights and Forecast - by Production Analysis
- 5.2. Market Analysis, Insights and Forecast - by Consumption Analysis
- 5.3. Market Analysis, Insights and Forecast - by Import Market Analysis (Value & Volume)
- 5.4. Market Analysis, Insights and Forecast - by Export Market Analysis (Value & Volume)
- 5.5. Market Analysis, Insights and Forecast - by Price Trend Analysis
- 5.6. Market Analysis, Insights and Forecast - by Region
- 5.6.1. North America
- 5.6.2. Europe
- 5.6.3. Asia Pacific
- 5.6.4. South America
- 5.6.5. Africa
- 5.1. Market Analysis, Insights and Forecast - by Production Analysis
- 6. North America Guar Market Analysis, Insights and Forecast, 2019-2031
- 6.1. Market Analysis, Insights and Forecast - by Production Analysis
- 6.2. Market Analysis, Insights and Forecast - by Consumption Analysis
- 6.3. Market Analysis, Insights and Forecast - by Import Market Analysis (Value & Volume)
- 6.4. Market Analysis, Insights and Forecast - by Export Market Analysis (Value & Volume)
- 6.5. Market Analysis, Insights and Forecast - by Price Trend Analysis
- 6.1. Market Analysis, Insights and Forecast - by Production Analysis
- 7. Europe Guar Market Analysis, Insights and Forecast, 2019-2031
- 7.1. Market Analysis, Insights and Forecast - by Production Analysis
- 7.2. Market Analysis, Insights and Forecast - by Consumption Analysis
- 7.3. Market Analysis, Insights and Forecast - by Import Market Analysis (Value & Volume)
- 7.4. Market Analysis, Insights and Forecast - by Export Market Analysis (Value & Volume)
- 7.5. Market Analysis, Insights and Forecast - by Price Trend Analysis
- 7.1. Market Analysis, Insights and Forecast - by Production Analysis
- 8. Asia Pacific Guar Market Analysis, Insights and Forecast, 2019-2031
- 8.1. Market Analysis, Insights and Forecast - by Production Analysis
- 8.2. Market Analysis, Insights and Forecast - by Consumption Analysis
- 8.3. Market Analysis, Insights and Forecast - by Import Market Analysis (Value & Volume)
- 8.4. Market Analysis, Insights and Forecast - by Export Market Analysis (Value & Volume)
- 8.5. Market Analysis, Insights and Forecast - by Price Trend Analysis
- 8.1. Market Analysis, Insights and Forecast - by Production Analysis
- 9. South America Guar Market Analysis, Insights and Forecast, 2019-2031
- 9.1. Market Analysis, Insights and Forecast - by Production Analysis
- 9.2. Market Analysis, Insights and Forecast - by Consumption Analysis
- 9.3. Market Analysis, Insights and Forecast - by Import Market Analysis (Value & Volume)
- 9.4. Market Analysis, Insights and Forecast - by Export Market Analysis (Value & Volume)
- 9.5. Market Analysis, Insights and Forecast - by Price Trend Analysis
- 9.1. Market Analysis, Insights and Forecast - by Production Analysis
- 10. Africa Guar Market Analysis, Insights and Forecast, 2019-2031
- 10.1. Market Analysis, Insights and Forecast - by Production Analysis
- 10.2. Market Analysis, Insights and Forecast - by Consumption Analysis
- 10.3. Market Analysis, Insights and Forecast - by Import Market Analysis (Value & Volume)
- 10.4. Market Analysis, Insights and Forecast - by Export Market Analysis (Value & Volume)
- 10.5. Market Analysis, Insights and Forecast - by Price Trend Analysis
- 10.1. Market Analysis, Insights and Forecast - by Production Analysis
- 11. South America Guar Market Analysis, Insights and Forecast, 2019-2031
- 11.1. Market Analysis, Insights and Forecast - By Country/Sub-region
- 11.1.1 Brazil
- 11.1.2 Argentina
- 11.1.3 Rest of South America
- 12. North America Guar Market Analysis, Insights and Forecast, 2019-2031
- 12.1. Market Analysis, Insights and Forecast - By Country/Sub-region
- 12.1.1 United States
- 12.1.2 Canada
- 12.1.3 Mexico
- 13. Asia Pacific Guar Market Analysis, Insights and Forecast, 2019-2031
- 13.1. Market Analysis, Insights and Forecast - By Country/Sub-region
- 13.1.1 China
- 13.1.2 Japan
- 13.1.3 India
- 13.1.4 South Korea
- 13.1.5 Taiwan
- 13.1.6 Australia
- 13.1.7 Rest of Asia-Pacific
- 14. Europe Guar Market Analysis, Insights and Forecast, 2019-2031
- 14.1. Market Analysis, Insights and Forecast - By Country/Sub-region
- 14.1.1 Germany
- 14.1.2 France
- 14.1.3 Italy
- 14.1.4 United Kingdom
- 14.1.5 Netherlands
- 14.1.6 Rest of Europe
- 15. MEA Guar Market Analysis, Insights and Forecast, 2019-2031
- 15.1. Market Analysis, Insights and Forecast - By Country/Sub-region
- 15.1.1 Middle East
- 15.1.2 Africa
- 16. Competitive Analysis
- 16.1. Global Market Share Analysis 2024
- 16.2. Company Profiles
- 16.2.1 Noble Commodities
- 16.2.1.1. Overview
- 16.2.1.2. Products
- 16.2.1.3. SWOT Analysis
- 16.2.1.4. Recent Developments
- 16.2.1.5. Financials (Based on Availability)
- 16.2.2 SunGum Global
- 16.2.2.1. Overview
- 16.2.2.2. Products
- 16.2.2.3. SWOT Analysis
- 16.2.2.4. Recent Developments
- 16.2.2.5. Financials (Based on Availability)
- 16.2.3 Galaxy Gum
- 16.2.3.1. Overview
- 16.2.3.2. Products
- 16.2.3.3. SWOT Analysis
- 16.2.3.4. Recent Developments
- 16.2.3.5. Financials (Based on Availability)
- 16.2.4 JK Agri Genetics
- 16.2.4.1. Overview
- 16.2.4.2. Products
- 16.2.4.3. SWOT Analysis
- 16.2.4.4. Recent Developments
- 16.2.4.5. Financials (Based on Availability)
- 16.2.5 Guar Gum International
- 16.2.5.1. Overview
- 16.2.5.2. Products
- 16.2.5.3. SWOT Analysis
- 16.2.5.4. Recent Developments
- 16.2.5.5. Financials (Based on Availability)
- 16.2.1 Noble Commodities
List of Figures
- Figure 1: Global Guar Market Revenue Breakdown (Million, %) by Region 2024 & 2032
- Figure 2: Global Guar Market Volume Breakdown (Kiloton, %) by Region 2024 & 2032
- Figure 3: South America Guar Market Revenue (Million), by Country 2024 & 2032
- Figure 4: South America Guar Market Volume (Kiloton), by Country 2024 & 2032
- Figure 5: South America Guar Market Revenue Share (%), by Country 2024 & 2032
- Figure 6: South America Guar Market Volume Share (%), by Country 2024 & 2032
- Figure 7: North America Guar Market Revenue (Million), by Country 2024 & 2032
- Figure 8: North America Guar Market Volume (Kiloton), by Country 2024 & 2032
- Figure 9: North America Guar Market Revenue Share (%), by Country 2024 & 2032
- Figure 10: North America Guar Market Volume Share (%), by Country 2024 & 2032
- Figure 11: Asia Pacific Guar Market Revenue (Million), by Country 2024 & 2032
- Figure 12: Asia Pacific Guar Market Volume (Kiloton), by Country 2024 & 2032
- Figure 13: Asia Pacific Guar Market Revenue Share (%), by Country 2024 & 2032
- Figure 14: Asia Pacific Guar Market Volume Share (%), by Country 2024 & 2032
- Figure 15: Europe Guar Market Revenue (Million), by Country 2024 & 2032
- Figure 16: Europe Guar Market Volume (Kiloton), by Country 2024 & 2032
- Figure 17: Europe Guar Market Revenue Share (%), by Country 2024 & 2032
- Figure 18: Europe Guar Market Volume Share (%), by Country 2024 & 2032
- Figure 19: MEA Guar Market Revenue (Million), by Country 2024 & 2032
- Figure 20: MEA Guar Market Volume (Kiloton), by Country 2024 & 2032
- Figure 21: MEA Guar Market Revenue Share (%), by Country 2024 & 2032
- Figure 22: MEA Guar Market Volume Share (%), by Country 2024 & 2032
- Figure 23: North America Guar Market Revenue (Million), by Production Analysis 2024 & 2032
- Figure 24: North America Guar Market Volume (Kiloton), by Production Analysis 2024 & 2032
- Figure 25: North America Guar Market Revenue Share (%), by Production Analysis 2024 & 2032
- Figure 26: North America Guar Market Volume Share (%), by Production Analysis 2024 & 2032
- Figure 27: North America Guar Market Revenue (Million), by Consumption Analysis 2024 & 2032
- Figure 28: North America Guar Market Volume (Kiloton), by Consumption Analysis 2024 & 2032
- Figure 29: North America Guar Market Revenue Share (%), by Consumption Analysis 2024 & 2032
- Figure 30: North America Guar Market Volume Share (%), by Consumption Analysis 2024 & 2032
- Figure 31: North America Guar Market Revenue (Million), by Import Market Analysis (Value & Volume) 2024 & 2032
- Figure 32: North America Guar Market Volume (Kiloton), by Import Market Analysis (Value & Volume) 2024 & 2032
- Figure 33: North America Guar Market Revenue Share (%), by Import Market Analysis (Value & Volume) 2024 & 2032
- Figure 34: North America Guar Market Volume Share (%), by Import Market Analysis (Value & Volume) 2024 & 2032
- Figure 35: North America Guar Market Revenue (Million), by Export Market Analysis (Value & Volume) 2024 & 2032
- Figure 36: North America Guar Market Volume (Kiloton), by Export Market Analysis (Value & Volume) 2024 & 2032
- Figure 37: North America Guar Market Revenue Share (%), by Export Market Analysis (Value & Volume) 2024 & 2032
- Figure 38: North America Guar Market Volume Share (%), by Export Market Analysis (Value & Volume) 2024 & 2032
- Figure 39: North America Guar Market Revenue (Million), by Price Trend Analysis 2024 & 2032
- Figure 40: North America Guar Market Volume (Kiloton), by Price Trend Analysis 2024 & 2032
- Figure 41: North America Guar Market Revenue Share (%), by Price Trend Analysis 2024 & 2032
- Figure 42: North America Guar Market Volume Share (%), by Price Trend Analysis 2024 & 2032
- Figure 43: North America Guar Market Revenue (Million), by Country 2024 & 2032
- Figure 44: North America Guar Market Volume (Kiloton), by Country 2024 & 2032
- Figure 45: North America Guar Market Revenue Share (%), by Country 2024 & 2032
- Figure 46: North America Guar Market Volume Share (%), by Country 2024 & 2032
- Figure 47: Europe Guar Market Revenue (Million), by Production Analysis 2024 & 2032
- Figure 48: Europe Guar Market Volume (Kiloton), by Production Analysis 2024 & 2032
- Figure 49: Europe Guar Market Revenue Share (%), by Production Analysis 2024 & 2032
- Figure 50: Europe Guar Market Volume Share (%), by Production Analysis 2024 & 2032
- Figure 51: Europe Guar Market Revenue (Million), by Consumption Analysis 2024 & 2032
- Figure 52: Europe Guar Market Volume (Kiloton), by Consumption Analysis 2024 & 2032
- Figure 53: Europe Guar Market Revenue Share (%), by Consumption Analysis 2024 & 2032
- Figure 54: Europe Guar Market Volume Share (%), by Consumption Analysis 2024 & 2032
- Figure 55: Europe Guar Market Revenue (Million), by Import Market Analysis (Value & Volume) 2024 & 2032
- Figure 56: Europe Guar Market Volume (Kiloton), by Import Market Analysis (Value & Volume) 2024 & 2032
- Figure 57: Europe Guar Market Revenue Share (%), by Import Market Analysis (Value & Volume) 2024 & 2032
- Figure 58: Europe Guar Market Volume Share (%), by Import Market Analysis (Value & Volume) 2024 & 2032
- Figure 59: Europe Guar Market Revenue (Million), by Export Market Analysis (Value & Volume) 2024 & 2032
- Figure 60: Europe Guar Market Volume (Kiloton), by Export Market Analysis (Value & Volume) 2024 & 2032
- Figure 61: Europe Guar Market Revenue Share (%), by Export Market Analysis (Value & Volume) 2024 & 2032
- Figure 62: Europe Guar Market Volume Share (%), by Export Market Analysis (Value & Volume) 2024 & 2032
- Figure 63: Europe Guar Market Revenue (Million), by Price Trend Analysis 2024 & 2032
- Figure 64: Europe Guar Market Volume (Kiloton), by Price Trend Analysis 2024 & 2032
- Figure 65: Europe Guar Market Revenue Share (%), by Price Trend Analysis 2024 & 2032
- Figure 66: Europe Guar Market Volume Share (%), by Price Trend Analysis 2024 & 2032
- Figure 67: Europe Guar Market Revenue (Million), by Country 2024 & 2032
- Figure 68: Europe Guar Market Volume (Kiloton), by Country 2024 & 2032
- Figure 69: Europe Guar Market Revenue Share (%), by Country 2024 & 2032
- Figure 70: Europe Guar Market Volume Share (%), by Country 2024 & 2032
- Figure 71: Asia Pacific Guar Market Revenue (Million), by Production Analysis 2024 & 2032
- Figure 72: Asia Pacific Guar Market Volume (Kiloton), by Production Analysis 2024 & 2032
- Figure 73: Asia Pacific Guar Market Revenue Share (%), by Production Analysis 2024 & 2032
- Figure 74: Asia Pacific Guar Market Volume Share (%), by Production Analysis 2024 & 2032
- Figure 75: Asia Pacific Guar Market Revenue (Million), by Consumption Analysis 2024 & 2032
- Figure 76: Asia Pacific Guar Market Volume (Kiloton), by Consumption Analysis 2024 & 2032
- Figure 77: Asia Pacific Guar Market Revenue Share (%), by Consumption Analysis 2024 & 2032
- Figure 78: Asia Pacific Guar Market Volume Share (%), by Consumption Analysis 2024 & 2032
- Figure 79: Asia Pacific Guar Market Revenue (Million), by Import Market Analysis (Value & Volume) 2024 & 2032
- Figure 80: Asia Pacific Guar Market Volume (Kiloton), by Import Market Analysis (Value & Volume) 2024 & 2032
- Figure 81: Asia Pacific Guar Market Revenue Share (%), by Import Market Analysis (Value & Volume) 2024 & 2032
- Figure 82: Asia Pacific Guar Market Volume Share (%), by Import Market Analysis (Value & Volume) 2024 & 2032
- Figure 83: Asia Pacific Guar Market Revenue (Million), by Export Market Analysis (Value & Volume) 2024 & 2032
- Figure 84: Asia Pacific Guar Market Volume (Kiloton), by Export Market Analysis (Value & Volume) 2024 & 2032
- Figure 85: Asia Pacific Guar Market Revenue Share (%), by Export Market Analysis (Value & Volume) 2024 & 2032
- Figure 86: Asia Pacific Guar Market Volume Share (%), by Export Market Analysis (Value & Volume) 2024 & 2032
- Figure 87: Asia Pacific Guar Market Revenue (Million), by Price Trend Analysis 2024 & 2032
- Figure 88: Asia Pacific Guar Market Volume (Kiloton), by Price Trend Analysis 2024 & 2032
- Figure 89: Asia Pacific Guar Market Revenue Share (%), by Price Trend Analysis 2024 & 2032
- Figure 90: Asia Pacific Guar Market Volume Share (%), by Price Trend Analysis 2024 & 2032
- Figure 91: Asia Pacific Guar Market Revenue (Million), by Country 2024 & 2032
- Figure 92: Asia Pacific Guar Market Volume (Kiloton), by Country 2024 & 2032
- Figure 93: Asia Pacific Guar Market Revenue Share (%), by Country 2024 & 2032
- Figure 94: Asia Pacific Guar Market Volume Share (%), by Country 2024 & 2032
- Figure 95: South America Guar Market Revenue (Million), by Production Analysis 2024 & 2032
- Figure 96: South America Guar Market Volume (Kiloton), by Production Analysis 2024 & 2032
- Figure 97: South America Guar Market Revenue Share (%), by Production Analysis 2024 & 2032
- Figure 98: South America Guar Market Volume Share (%), by Production Analysis 2024 & 2032
- Figure 99: South America Guar Market Revenue (Million), by Consumption Analysis 2024 & 2032
- Figure 100: South America Guar Market Volume (Kiloton), by Consumption Analysis 2024 & 2032
- Figure 101: South America Guar Market Revenue Share (%), by Consumption Analysis 2024 & 2032
- Figure 102: South America Guar Market Volume Share (%), by Consumption Analysis 2024 & 2032
- Figure 103: South America Guar Market Revenue (Million), by Import Market Analysis (Value & Volume) 2024 & 2032
- Figure 104: South America Guar Market Volume (Kiloton), by Import Market Analysis (Value & Volume) 2024 & 2032
- Figure 105: South America Guar Market Revenue Share (%), by Import Market Analysis (Value & Volume) 2024 & 2032
- Figure 106: South America Guar Market Volume Share (%), by Import Market Analysis (Value & Volume) 2024 & 2032
- Figure 107: South America Guar Market Revenue (Million), by Export Market Analysis (Value & Volume) 2024 & 2032
- Figure 108: South America Guar Market Volume (Kiloton), by Export Market Analysis (Value & Volume) 2024 & 2032
- Figure 109: South America Guar Market Revenue Share (%), by Export Market Analysis (Value & Volume) 2024 & 2032
- Figure 110: South America Guar Market Volume Share (%), by Export Market Analysis (Value & Volume) 2024 & 2032
- Figure 111: South America Guar Market Revenue (Million), by Price Trend Analysis 2024 & 2032
- Figure 112: South America Guar Market Volume (Kiloton), by Price Trend Analysis 2024 & 2032
- Figure 113: South America Guar Market Revenue Share (%), by Price Trend Analysis 2024 & 2032
- Figure 114: South America Guar Market Volume Share (%), by Price Trend Analysis 2024 & 2032
- Figure 115: South America Guar Market Revenue (Million), by Country 2024 & 2032
- Figure 116: South America Guar Market Volume (Kiloton), by Country 2024 & 2032
- Figure 117: South America Guar Market Revenue Share (%), by Country 2024 & 2032
- Figure 118: South America Guar Market Volume Share (%), by Country 2024 & 2032
- Figure 119: Africa Guar Market Revenue (Million), by Production Analysis 2024 & 2032
- Figure 120: Africa Guar Market Volume (Kiloton), by Production Analysis 2024 & 2032
- Figure 121: Africa Guar Market Revenue Share (%), by Production Analysis 2024 & 2032
- Figure 122: Africa Guar Market Volume Share (%), by Production Analysis 2024 & 2032
- Figure 123: Africa Guar Market Revenue (Million), by Consumption Analysis 2024 & 2032
- Figure 124: Africa Guar Market Volume (Kiloton), by Consumption Analysis 2024 & 2032
- Figure 125: Africa Guar Market Revenue Share (%), by Consumption Analysis 2024 & 2032
- Figure 126: Africa Guar Market Volume Share (%), by Consumption Analysis 2024 & 2032
- Figure 127: Africa Guar Market Revenue (Million), by Import Market Analysis (Value & Volume) 2024 & 2032
- Figure 128: Africa Guar Market Volume (Kiloton), by Import Market Analysis (Value & Volume) 2024 & 2032
- Figure 129: Africa Guar Market Revenue Share (%), by Import Market Analysis (Value & Volume) 2024 & 2032
- Figure 130: Africa Guar Market Volume Share (%), by Import Market Analysis (Value & Volume) 2024 & 2032
- Figure 131: Africa Guar Market Revenue (Million), by Export Market Analysis (Value & Volume) 2024 & 2032
- Figure 132: Africa Guar Market Volume (Kiloton), by Export Market Analysis (Value & Volume) 2024 & 2032
- Figure 133: Africa Guar Market Revenue Share (%), by Export Market Analysis (Value & Volume) 2024 & 2032
- Figure 134: Africa Guar Market Volume Share (%), by Export Market Analysis (Value & Volume) 2024 & 2032
- Figure 135: Africa Guar Market Revenue (Million), by Price Trend Analysis 2024 & 2032
- Figure 136: Africa Guar Market Volume (Kiloton), by Price Trend Analysis 2024 & 2032
- Figure 137: Africa Guar Market Revenue Share (%), by Price Trend Analysis 2024 & 2032
- Figure 138: Africa Guar Market Volume Share (%), by Price Trend Analysis 2024 & 2032
- Figure 139: Africa Guar Market Revenue (Million), by Country 2024 & 2032
- Figure 140: Africa Guar Market Volume (Kiloton), by Country 2024 & 2032
- Figure 141: Africa Guar Market Revenue Share (%), by Country 2024 & 2032
- Figure 142: Africa Guar Market Volume Share (%), by Country 2024 & 2032
List of Tables
- Table 1: Global Guar Market Revenue Million Forecast, by Region 2019 & 2032
- Table 2: Global Guar Market Volume Kiloton Forecast, by Region 2019 & 2032
- Table 3: Global Guar Market Revenue Million Forecast, by Production Analysis 2019 & 2032
- Table 4: Global Guar Market Volume Kiloton Forecast, by Production Analysis 2019 & 2032
- Table 5: Global Guar Market Revenue Million Forecast, by Consumption Analysis 2019 & 2032
- Table 6: Global Guar Market Volume Kiloton Forecast, by Consumption Analysis 2019 & 2032
- Table 7: Global Guar Market Revenue Million Forecast, by Import Market Analysis (Value & Volume) 2019 & 2032
- Table 8: Global Guar Market Volume Kiloton Forecast, by Import Market Analysis (Value & Volume) 2019 & 2032
- Table 9: Global Guar Market Revenue Million Forecast, by Export Market Analysis (Value & Volume) 2019 & 2032
- Table 10: Global Guar Market Volume Kiloton Forecast, by Export Market Analysis (Value & Volume) 2019 & 2032
- Table 11: Global Guar Market Revenue Million Forecast, by Price Trend Analysis 2019 & 2032
- Table 12: Global Guar Market Volume Kiloton Forecast, by Price Trend Analysis 2019 & 2032
- Table 13: Global Guar Market Revenue Million Forecast, by Region 2019 & 2032
- Table 14: Global Guar Market Volume Kiloton Forecast, by Region 2019 & 2032
- Table 15: Global Guar Market Revenue Million Forecast, by Country 2019 & 2032
- Table 16: Global Guar Market Volume Kiloton Forecast, by Country 2019 & 2032
- Table 17: Brazil Guar Market Revenue (Million) Forecast, by Application 2019 & 2032
- Table 18: Brazil Guar Market Volume (Kiloton) Forecast, by Application 2019 & 2032
- Table 19: Argentina Guar Market Revenue (Million) Forecast, by Application 2019 & 2032
- Table 20: Argentina Guar Market Volume (Kiloton) Forecast, by Application 2019 & 2032
- Table 21: Rest of South America Guar Market Revenue (Million) Forecast, by Application 2019 & 2032
- Table 22: Rest of South America Guar Market Volume (Kiloton) Forecast, by Application 2019 & 2032
- Table 23: Global Guar Market Revenue Million Forecast, by Country 2019 & 2032
- Table 24: Global Guar Market Volume Kiloton Forecast, by Country 2019 & 2032
- Table 25: United States Guar Market Revenue (Million) Forecast, by Application 2019 & 2032
- Table 26: United States Guar Market Volume (Kiloton) Forecast, by Application 2019 & 2032
- Table 27: Canada Guar Market Revenue (Million) Forecast, by Application 2019 & 2032
- Table 28: Canada Guar Market Volume (Kiloton) Forecast, by Application 2019 & 2032
- Table 29: Mexico Guar Market Revenue (Million) Forecast, by Application 2019 & 2032
- Table 30: Mexico Guar Market Volume (Kiloton) Forecast, by Application 2019 & 2032
- Table 31: Global Guar Market Revenue Million Forecast, by Country 2019 & 2032
- Table 32: Global Guar Market Volume Kiloton Forecast, by Country 2019 & 2032
- Table 33: China Guar Market Revenue (Million) Forecast, by Application 2019 & 2032
- Table 34: China Guar Market Volume (Kiloton) Forecast, by Application 2019 & 2032
- Table 35: Japan Guar Market Revenue (Million) Forecast, by Application 2019 & 2032
- Table 36: Japan Guar Market Volume (Kiloton) Forecast, by Application 2019 & 2032
- Table 37: India Guar Market Revenue (Million) Forecast, by Application 2019 & 2032
- Table 38: India Guar Market Volume (Kiloton) Forecast, by Application 2019 & 2032
- Table 39: South Korea Guar Market Revenue (Million) Forecast, by Application 2019 & 2032
- Table 40: South Korea Guar Market Volume (Kiloton) Forecast, by Application 2019 & 2032
- Table 41: Taiwan Guar Market Revenue (Million) Forecast, by Application 2019 & 2032
- Table 42: Taiwan Guar Market Volume (Kiloton) Forecast, by Application 2019 & 2032
- Table 43: Australia Guar Market Revenue (Million) Forecast, by Application 2019 & 2032
- Table 44: Australia Guar Market Volume (Kiloton) Forecast, by Application 2019 & 2032
- Table 45: Rest of Asia-Pacific Guar Market Revenue (Million) Forecast, by Application 2019 & 2032
- Table 46: Rest of Asia-Pacific Guar Market Volume (Kiloton) Forecast, by Application 2019 & 2032
- Table 47: Global Guar Market Revenue Million Forecast, by Country 2019 & 2032
- Table 48: Global Guar Market Volume Kiloton Forecast, by Country 2019 & 2032
- Table 49: Germany Guar Market Revenue (Million) Forecast, by Application 2019 & 2032
- Table 50: Germany Guar Market Volume (Kiloton) Forecast, by Application 2019 & 2032
- Table 51: France Guar Market Revenue (Million) Forecast, by Application 2019 & 2032
- Table 52: France Guar Market Volume (Kiloton) Forecast, by Application 2019 & 2032
- Table 53: Italy Guar Market Revenue (Million) Forecast, by Application 2019 & 2032
- Table 54: Italy Guar Market Volume (Kiloton) Forecast, by Application 2019 & 2032
- Table 55: United Kingdom Guar Market Revenue (Million) Forecast, by Application 2019 & 2032
- Table 56: United Kingdom Guar Market Volume (Kiloton) Forecast, by Application 2019 & 2032
- Table 57: Netherlands Guar Market Revenue (Million) Forecast, by Application 2019 & 2032
- Table 58: Netherlands Guar Market Volume (Kiloton) Forecast, by Application 2019 & 2032
- Table 59: Rest of Europe Guar Market Revenue (Million) Forecast, by Application 2019 & 2032
- Table 60: Rest of Europe Guar Market Volume (Kiloton) Forecast, by Application 2019 & 2032
- Table 61: Global Guar Market Revenue Million Forecast, by Country 2019 & 2032
- Table 62: Global Guar Market Volume Kiloton Forecast, by Country 2019 & 2032
- Table 63: Middle East Guar Market Revenue (Million) Forecast, by Application 2019 & 2032
- Table 64: Middle East Guar Market Volume (Kiloton) Forecast, by Application 2019 & 2032
- Table 65: Africa Guar Market Revenue (Million) Forecast, by Application 2019 & 2032
- Table 66: Africa Guar Market Volume (Kiloton) Forecast, by Application 2019 & 2032
- Table 67: Global Guar Market Revenue Million Forecast, by Production Analysis 2019 & 2032
- Table 68: Global Guar Market Volume Kiloton Forecast, by Production Analysis 2019 & 2032
- Table 69: Global Guar Market Revenue Million Forecast, by Consumption Analysis 2019 & 2032
- Table 70: Global Guar Market Volume Kiloton Forecast, by Consumption Analysis 2019 & 2032
- Table 71: Global Guar Market Revenue Million Forecast, by Import Market Analysis (Value & Volume) 2019 & 2032
- Table 72: Global Guar Market Volume Kiloton Forecast, by Import Market Analysis (Value & Volume) 2019 & 2032
- Table 73: Global Guar Market Revenue Million Forecast, by Export Market Analysis (Value & Volume) 2019 & 2032
- Table 74: Global Guar Market Volume Kiloton Forecast, by Export Market Analysis (Value & Volume) 2019 & 2032
- Table 75: Global Guar Market Revenue Million Forecast, by Price Trend Analysis 2019 & 2032
- Table 76: Global Guar Market Volume Kiloton Forecast, by Price Trend Analysis 2019 & 2032
- Table 77: Global Guar Market Revenue Million Forecast, by Country 2019 & 2032
- Table 78: Global Guar Market Volume Kiloton Forecast, by Country 2019 & 2032
- Table 79: United States Guar Market Revenue (Million) Forecast, by Application 2019 & 2032
- Table 80: United States Guar Market Volume (Kiloton) Forecast, by Application 2019 & 2032
- Table 81: Canada Guar Market Revenue (Million) Forecast, by Application 2019 & 2032
- Table 82: Canada Guar Market Volume (Kiloton) Forecast, by Application 2019 & 2032
- Table 83: Global Guar Market Revenue Million Forecast, by Production Analysis 2019 & 2032
- Table 84: Global Guar Market Volume Kiloton Forecast, by Production Analysis 2019 & 2032
- Table 85: Global Guar Market Revenue Million Forecast, by Consumption Analysis 2019 & 2032
- Table 86: Global Guar Market Volume Kiloton Forecast, by Consumption Analysis 2019 & 2032
- Table 87: Global Guar Market Revenue Million Forecast, by Import Market Analysis (Value & Volume) 2019 & 2032
- Table 88: Global Guar Market Volume Kiloton Forecast, by Import Market Analysis (Value & Volume) 2019 & 2032
- Table 89: Global Guar Market Revenue Million Forecast, by Export Market Analysis (Value & Volume) 2019 & 2032
- Table 90: Global Guar Market Volume Kiloton Forecast, by Export Market Analysis (Value & Volume) 2019 & 2032
- Table 91: Global Guar Market Revenue Million Forecast, by Price Trend Analysis 2019 & 2032
- Table 92: Global Guar Market Volume Kiloton Forecast, by Price Trend Analysis 2019 & 2032
- Table 93: Global Guar Market Revenue Million Forecast, by Country 2019 & 2032
- Table 94: Global Guar Market Volume Kiloton Forecast, by Country 2019 & 2032
- Table 95: Germany Guar Market Revenue (Million) Forecast, by Application 2019 & 2032
- Table 96: Germany Guar Market Volume (Kiloton) Forecast, by Application 2019 & 2032
- Table 97: France Guar Market Revenue (Million) Forecast, by Application 2019 & 2032
- Table 98: France Guar Market Volume (Kiloton) Forecast, by Application 2019 & 2032
- Table 99: Russia Guar Market Revenue (Million) Forecast, by Application 2019 & 2032
- Table 100: Russia Guar Market Volume (Kiloton) Forecast, by Application 2019 & 2032
- Table 101: Spain Guar Market Revenue (Million) Forecast, by Application 2019 & 2032
- Table 102: Spain Guar Market Volume (Kiloton) Forecast, by Application 2019 & 2032
- Table 103: Global Guar Market Revenue Million Forecast, by Production Analysis 2019 & 2032
- Table 104: Global Guar Market Volume Kiloton Forecast, by Production Analysis 2019 & 2032
- Table 105: Global Guar Market Revenue Million Forecast, by Consumption Analysis 2019 & 2032
- Table 106: Global Guar Market Volume Kiloton Forecast, by Consumption Analysis 2019 & 2032
- Table 107: Global Guar Market Revenue Million Forecast, by Import Market Analysis (Value & Volume) 2019 & 2032
- Table 108: Global Guar Market Volume Kiloton Forecast, by Import Market Analysis (Value & Volume) 2019 & 2032
- Table 109: Global Guar Market Revenue Million Forecast, by Export Market Analysis (Value & Volume) 2019 & 2032
- Table 110: Global Guar Market Volume Kiloton Forecast, by Export Market Analysis (Value & Volume) 2019 & 2032
- Table 111: Global Guar Market Revenue Million Forecast, by Price Trend Analysis 2019 & 2032
- Table 112: Global Guar Market Volume Kiloton Forecast, by Price Trend Analysis 2019 & 2032
- Table 113: Global Guar Market Revenue Million Forecast, by Country 2019 & 2032
- Table 114: Global Guar Market Volume Kiloton Forecast, by Country 2019 & 2032
- Table 115: India Guar Market Revenue (Million) Forecast, by Application 2019 & 2032
- Table 116: India Guar Market Volume (Kiloton) Forecast, by Application 2019 & 2032
- Table 117: China Guar Market Revenue (Million) Forecast, by Application 2019 & 2032
- Table 118: China Guar Market Volume (Kiloton) Forecast, by Application 2019 & 2032
- Table 119: Japan Guar Market Revenue (Million) Forecast, by Application 2019 & 2032
- Table 120: Japan Guar Market Volume (Kiloton) Forecast, by Application 2019 & 2032
- Table 121: Australia Guar Market Revenue (Million) Forecast, by Application 2019 & 2032
- Table 122: Australia Guar Market Volume (Kiloton) Forecast, by Application 2019 & 2032
- Table 123: Global Guar Market Revenue Million Forecast, by Production Analysis 2019 & 2032
- Table 124: Global Guar Market Volume Kiloton Forecast, by Production Analysis 2019 & 2032
- Table 125: Global Guar Market Revenue Million Forecast, by Consumption Analysis 2019 & 2032
- Table 126: Global Guar Market Volume Kiloton Forecast, by Consumption Analysis 2019 & 2032
- Table 127: Global Guar Market Revenue Million Forecast, by Import Market Analysis (Value & Volume) 2019 & 2032
- Table 128: Global Guar Market Volume Kiloton Forecast, by Import Market Analysis (Value & Volume) 2019 & 2032
- Table 129: Global Guar Market Revenue Million Forecast, by Export Market Analysis (Value & Volume) 2019 & 2032
- Table 130: Global Guar Market Volume Kiloton Forecast, by Export Market Analysis (Value & Volume) 2019 & 2032
- Table 131: Global Guar Market Revenue Million Forecast, by Price Trend Analysis 2019 & 2032
- Table 132: Global Guar Market Volume Kiloton Forecast, by Price Trend Analysis 2019 & 2032
- Table 133: Global Guar Market Revenue Million Forecast, by Country 2019 & 2032
- Table 134: Global Guar Market Volume Kiloton Forecast, by Country 2019 & 2032
- Table 135: Brazil Guar Market Revenue (Million) Forecast, by Application 2019 & 2032
- Table 136: Brazil Guar Market Volume (Kiloton) Forecast, by Application 2019 & 2032
- Table 137: Argentina Guar Market Revenue (Million) Forecast, by Application 2019 & 2032
- Table 138: Argentina Guar Market Volume (Kiloton) Forecast, by Application 2019 & 2032
- Table 139: Global Guar Market Revenue Million Forecast, by Production Analysis 2019 & 2032
- Table 140: Global Guar Market Volume Kiloton Forecast, by Production Analysis 2019 & 2032
- Table 141: Global Guar Market Revenue Million Forecast, by Consumption Analysis 2019 & 2032
- Table 142: Global Guar Market Volume Kiloton Forecast, by Consumption Analysis 2019 & 2032
- Table 143: Global Guar Market Revenue Million Forecast, by Import Market Analysis (Value & Volume) 2019 & 2032
- Table 144: Global Guar Market Volume Kiloton Forecast, by Import Market Analysis (Value & Volume) 2019 & 2032
- Table 145: Global Guar Market Revenue Million Forecast, by Export Market Analysis (Value & Volume) 2019 & 2032
- Table 146: Global Guar Market Volume Kiloton Forecast, by Export Market Analysis (Value & Volume) 2019 & 2032
- Table 147: Global Guar Market Revenue Million Forecast, by Price Trend Analysis 2019 & 2032
- Table 148: Global Guar Market Volume Kiloton Forecast, by Price Trend Analysis 2019 & 2032
- Table 149: Global Guar Market Revenue Million Forecast, by Country 2019 & 2032
- Table 150: Global Guar Market Volume Kiloton Forecast, by Country 2019 & 2032
- Table 151: Malawi Guar Market Revenue (Million) Forecast, by Application 2019 & 2032
- Table 152: Malawi Guar Market Volume (Kiloton) Forecast, by Application 2019 & 2032
- Table 153: Sudan Guar Market Revenue (Million) Forecast, by Application 2019 & 2032
- Table 154: Sudan Guar Market Volume (Kiloton) Forecast, by Application 2019 & 2032
Frequently Asked Questions
1. What is the projected Compound Annual Growth Rate (CAGR) of the Guar Market?
The projected CAGR is approximately 2.60%.
2. Which companies are prominent players in the Guar Market?
Key companies in the market include Noble Commodities, SunGum Global , Galaxy Gum , JK Agri Genetics , Guar Gum International .
3. What are the main segments of the Guar Market?
The market segments include Production Analysis, Consumption Analysis, Import Market Analysis (Value & Volume), Export Market Analysis (Value & Volume), Price Trend Analysis.
4. Can you provide details about the market size?
The market size is estimated to be USD 1.31 Million as of 2022.
5. What are some drivers contributing to market growth?
Rising Consumption of Cashew Nuts in the Country; Favorable Government Initiatives.
6. What are the notable trends driving market growth?
High Demand by End-users.
7. Are there any restraints impacting market growth?
Hazardous Climatic Condition Hinders Cashew Production; Stringent Regulations Related to Food Quality Standards.
8. Can you provide examples of recent developments in the market?
May 2022: The Directorate General of Foreign Trade (DGFT), on May 9, 2022, issued an amendment to the notification dated September 29, 2017, for the export of guar gum to the European Union and the United Kingdom. The export originating from India should get an official certificate and the original analytical report of testing of pentachlorophenol (PCP) and ethylene oxide (ETO) from Vimta Labs, Hyderabad. In addition to Vimta Labs, Hyderabad, Export Inspection Agency (EIA) Chennai has also been authorized to issue the analytical report of testing of PCP.
9. What pricing options are available for accessing the report?
Pricing options include single-user, multi-user, and enterprise licenses priced at USD 4750, USD 5250, and USD 8750 respectively.
10. Is the market size provided in terms of value or volume?
The market size is provided in terms of value, measured in Million and volume, measured in Kiloton.
11. Are there any specific market keywords associated with the report?
Yes, the market keyword associated with the report is "Guar Market," which aids in identifying and referencing the specific market segment covered.
12. How do I determine which pricing option suits my needs best?
The pricing options vary based on user requirements and access needs. Individual users may opt for single-user licenses, while businesses requiring broader access may choose multi-user or enterprise licenses for cost-effective access to the report.
13. Are there any additional resources or data provided in the Guar Market report?
While the report offers comprehensive insights, it's advisable to review the specific contents or supplementary materials provided to ascertain if additional resources or data are available.
14. How can I stay updated on further developments or reports in the Guar Market?
To stay informed about further developments, trends, and reports in the Guar Market, consider subscribing to industry newsletters, following relevant companies and organizations, or regularly checking reputable industry news sources and publications.
Methodology
Step 1 - Identification of Relevant Samples Size from Population Database


Step 2 - Approaches for Defining Global Market Size (Value, Volume* & Price*)

Note*: In applicable scenarios
Step 3 - Data Sources
Primary Research
- Web Analytics
- Survey Reports
- Research Institute
- Latest Research Reports
- Opinion Leaders
Secondary Research
- Annual Reports
- White Paper
- Latest Press Release
- Industry Association
- Paid Database
- Investor Presentations

Step 4 - Data Triangulation
Involves using different sources of information in order to increase the validity of a study
These sources are likely to be stakeholders in a program - participants, other researchers, program staff, other community members, and so on.
Then we put all data in single framework & apply various statistical tools to find out the dynamic on the market.
During the analysis stage, feedback from the stakeholder groups would be compared to determine areas of agreement as well as areas of divergence


