

Key Insights
The global hair loss products market is experiencing robust growth, driven by increasing awareness of hair loss solutions, rising disposable incomes, and a growing trend towards self-care and aesthetic enhancements. The market's expansion is fueled by a diverse range of product categories, including topical treatments (minoxidil, finasteride), hair growth supplements (biotin, vitamins), shampoos and conditioners, and hair restoration procedures (hair transplants, laser therapy). The market is highly competitive, with major players like L'Oreal, Unilever, and Johnson & Johnson competing alongside smaller, specialized brands focusing on niche segments. Technological advancements in hair loss treatment, such as the development of more effective and minimally invasive procedures, contribute significantly to the market's upward trajectory. The increasing prevalence of hair loss in younger demographics, attributed partly to lifestyle factors and stress, further fuels market demand. However, challenges remain, including the high cost of certain treatments, potential side effects, and the varying effectiveness of products across individuals.
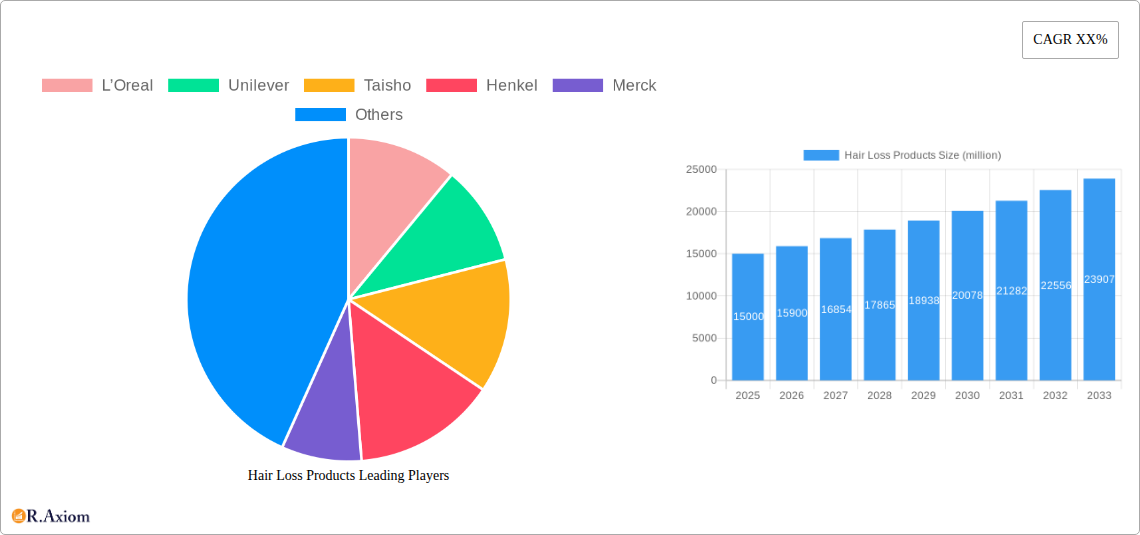
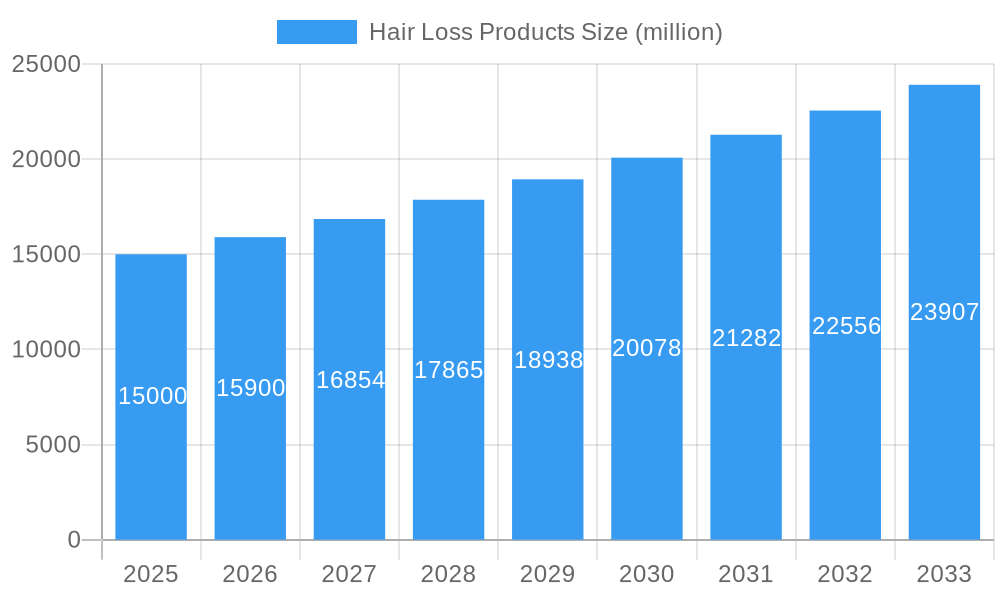
Hair Loss Products Market Size (In Billion)
Despite these challenges, the market presents significant opportunities for innovation and growth. The rising demand for natural and organic hair loss products creates a space for companies to capitalize on the increasing consumer preference for clean beauty and sustainable solutions. Furthermore, the potential for personalized hair loss treatments, tailored to specific genetic and lifestyle factors, presents a promising avenue for future development. The market is geographically diverse, with North America and Europe currently holding a significant share, but emerging markets in Asia and Latin America are expected to witness rapid growth due to increasing awareness and disposable incomes within these regions. Competition is expected to intensify as more companies enter the market, necessitating continuous innovation and strategic marketing efforts to capture market share. A clear understanding of consumer preferences and demographic trends will be critical for companies seeking long-term success in this dynamic market.
Hair Loss Products Company Market Share
Hair Loss Products Market Report: 2019-2033 - A Comprehensive Analysis of a Multi-Billion Dollar Industry
This in-depth report provides a comprehensive analysis of the global hair loss products market, offering invaluable insights for industry stakeholders, investors, and businesses seeking to capitalize on this rapidly evolving sector. The report covers the period from 2019 to 2033, with a focus on the estimated year 2025 and a forecast period extending to 2033. The market is valued in millions of USD. The report analyzes market trends, competitive dynamics, leading players, and future growth opportunities, with a detailed examination of key segments and geographic markets. The study period includes historical data from 2019-2024, offering a robust foundation for forecasting future market performance.
Hair Loss Products Market Concentration & Innovation
The global hair loss products market exhibits a moderately concentrated landscape, with a few major players dominating significant market share. L’Oréal, Unilever, and Johnson & Johnson Consumer Inc. hold substantial positions, benefiting from established brand recognition and extensive distribution networks. However, the market also features numerous smaller players, including specialized niche brands, fostering innovation and competition. Market share data for 2025 estimates L'Oreal at xx%, Unilever at xx%, and Johnson & Johnson Consumer Inc. at xx%, with the remaining share distributed among other players.
Innovation Drivers: Significant investment in R&D by major players drives the introduction of innovative products featuring advanced formulations and delivery systems. This includes the development of products using natural ingredients, technological advancements in topical treatments, and the exploration of novel active ingredients.
Regulatory Frameworks: Varying regulatory landscapes across different regions impact product development and market access. Stringent regulations regarding ingredient safety and efficacy contribute to higher R&D costs.
Product Substitutes: The market faces competition from alternative treatments like hair transplants and other medical interventions. The effectiveness and cost-effectiveness of these alternatives influence market growth.
End-User Trends: Increasing awareness of hair loss issues and a growing preference for convenient and effective solutions fuel market growth. The demand for natural and organic products is also steadily rising.
M&A Activities: Consolidation within the industry is evident through various mergers and acquisitions, with deals valued at approximately $xx million in the past five years (2019-2024). These activities aim to enhance market share, expand product portfolios, and access new technologies.
Hair Loss Products Industry Trends & Insights
The global hair loss products market is experiencing robust growth, driven by multiple factors. The market is projected to achieve a Compound Annual Growth Rate (CAGR) of xx% during the forecast period (2025-2033). This growth is attributed to rising awareness about hair loss, increasing disposable incomes, and expanding e-commerce channels.
Technological disruptions, particularly in the form of advanced formulations and personalized treatments, are transforming the market. Consumer preferences are shifting towards natural, organic, and ethically sourced products. Competitive dynamics are characterized by intense competition among established players and the emergence of innovative startups. Market penetration for key product categories (e.g., topical treatments, hair fibers) is showing a steady increase, with projections reaching xx% by 2033.
Dominant Markets & Segments in Hair Loss Products
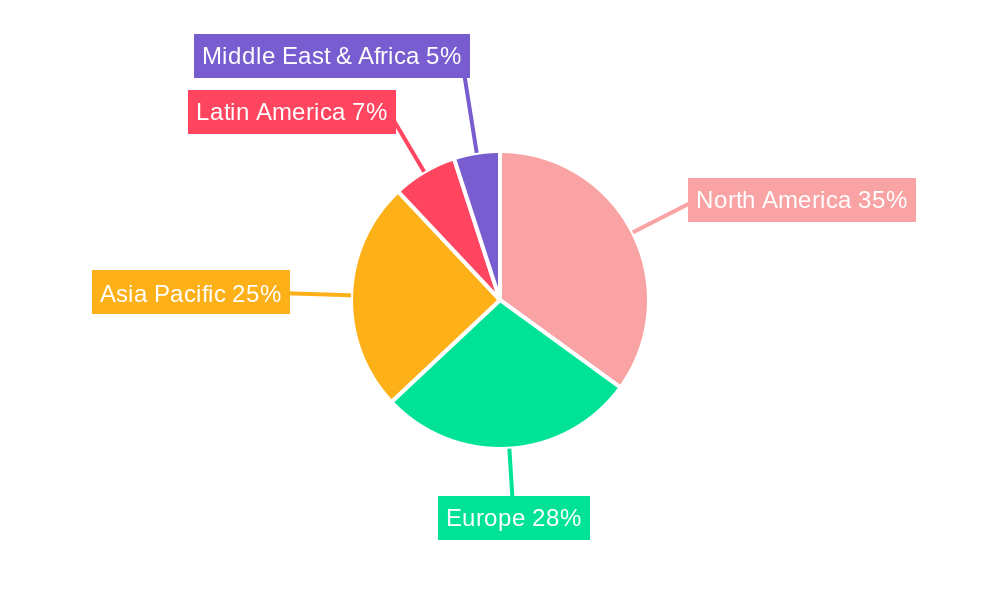
The North American market holds a dominant position in the global hair loss products market, owing to high consumer spending, strong regulatory frameworks, and a relatively high prevalence of hair loss. Within North America, the United States holds the largest market share.
- Key Drivers in North America:
- High disposable incomes and increased healthcare spending.
- Strong regulatory environment supporting product innovation and safety.
- Extensive distribution networks for hair loss products.
- High awareness and acceptance of hair loss treatments.
The dominance of North America is primarily due to high consumer awareness, a strong regulatory environment that promotes product innovation, a well-established distribution network, and the prevalence of hair loss in this region.
Hair Loss Products Product Developments
Recent product innovations include advanced formulations incorporating natural ingredients, targeted treatments for specific hair loss types, and convenient delivery systems. There's a growing emphasis on personalized treatments tailored to individual needs and hair types. These developments are driven by technological advancements in dermatology, biotechnology, and materials science. The successful market fit of these new products depends on effective marketing, consumer education, and positive clinical results.
Report Scope & Segmentation Analysis
This report segments the hair loss products market by product type (topical treatments, oral medications, hair fibers, hair systems), distribution channel (online, offline), and geography (North America, Europe, Asia-Pacific, Rest of World). Each segment presents distinct growth projections, market sizes, and competitive landscapes. For instance, the topical treatments segment is projected to exhibit the highest CAGR, while the online channel is expected to witness rapid expansion.
Key Drivers of Hair Loss Products Growth
Key growth drivers include rising awareness and acceptance of hair loss treatments, increasing disposable incomes, particularly in emerging economies, and the growing popularity of convenient and effective hair loss solutions. Advancements in technology leading to more effective products, coupled with supportive regulatory frameworks, are further accelerating market expansion.
Challenges in the Hair Loss Products Sector
The industry faces challenges such as stringent regulatory approvals, fluctuating raw material prices impacting production costs, and intense competition from existing and emerging players. The complexity of hair loss and the varying efficacy of treatments can also create challenges for market penetration. These factors collectively contribute to xx% of overall market constraints.
Emerging Opportunities in Hair Loss Products
Emerging opportunities include personalized hair loss solutions, the growing acceptance of natural and organic products, and the expansion into new and underpenetrated markets. Technological advancements in hair regeneration therapies and the development of advanced diagnostics also present significant growth potential.
Leading Players in the Hair Loss Products Market
- L’Oréal
- Unilever
- Taisho
- Henkel
- Merck
- Shiseido
- Johnson & Johnson Consumer Inc.
- Rohto
- Lifes2Good
- Gerolymatos International
- Toppik
- Nanogen
- Oxford BioLabs Ltd.
- Ultrax Labs
- Avalon Natural Products
- Bayer
- Pharma Medico
- Kirkland Signature
- Phyto Ales Group
- Amplixin
- Kerafiber
- Phyto
- Keranique
- DS Healthcare Group
- Kaminomoto
- Softto
- Bawang
- Zhang Guang 101
Key Developments in Hair Loss Products Industry
- 2022 Q4: L’Oréal launched a new line of hair loss products incorporating a novel active ingredient.
- 2023 Q1: Unilever acquired a smaller hair loss products company, expanding its product portfolio.
- 2023 Q3: A significant clinical trial demonstrating the efficacy of a new topical treatment was published, impacting market sentiment.
- 2024 Q2: New regulatory guidelines regarding the use of specific ingredients in hair loss products were implemented. (Further details on specific developments with dates will be provided in the full report.)
Strategic Outlook for Hair Loss Products Market
The hair loss products market is poised for continued growth, driven by technological advancements, rising consumer awareness, and increasing disposable incomes globally. The focus on personalized treatments, natural ingredients, and effective marketing strategies will determine the success of market players. The market presents significant opportunities for innovation and expansion, particularly in emerging markets.
Hair Loss Products Segmentation
-
1. Application
- 1.1. Men
- 1.2. Women
-
2. Types
- 2.1. Hair Loss and Growth Devices
- 2.2. Shampoos and Conditioners
- 2.3. Medicine Product
- 2.4. Others
Hair Loss Products Segmentation By Geography
-
1. North America
- 1.1. United States
- 1.2. Canada
- 1.3. Mexico
-
2. South America
- 2.1. Brazil
- 2.2. Argentina
- 2.3. Rest of South America
-
3. Europe
- 3.1. United Kingdom
- 3.2. Germany
- 3.3. France
- 3.4. Italy
- 3.5. Spain
- 3.6. Russia
- 3.7. Benelux
- 3.8. Nordics
- 3.9. Rest of Europe
-
4. Middle East & Africa
- 4.1. Turkey
- 4.2. Israel
- 4.3. GCC
- 4.4. North Africa
- 4.5. South Africa
- 4.6. Rest of Middle East & Africa
-
5. Asia Pacific
- 5.1. China
- 5.2. India
- 5.3. Japan
- 5.4. South Korea
- 5.5. ASEAN
- 5.6. Oceania
- 5.7. Rest of Asia Pacific
Hair Loss Products Regional Market Share
Geographic Coverage of Hair Loss Products
Hair Loss Products REPORT HIGHLIGHTS
| Aspects | Details |
|---|---|
| Study Period | 2020-2034 |
| Base Year | 2025 |
| Estimated Year | 2026 |
| Forecast Period | 2026-2034 |
| Historical Period | 2020-2025 |
| Growth Rate | CAGR of 6.2% from 2020-2034 |
| Segmentation |
|
Table of Contents
- 1. Introduction
- 1.1. Research Scope
- 1.2. Market Segmentation
- 1.3. Research Objective
- 1.4. Definitions and Assumptions
- 2. Executive Summary
- 2.1. Market Snapshot
- 3. Market Dynamics
- 3.1. Market Drivers
- 3.2. Market Restrains
- 3.3. Market Trends
- 3.4. Market Opportunities
- 4. Market Factor Analysis
- 4.1. Porters Five Forces
- 4.1.1. Bargaining Power of Suppliers
- 4.1.2. Bargaining Power of Buyers
- 4.1.3. Threat of New Entrants
- 4.1.4. Threat of Substitutes
- 4.1.5. Competitive Rivalry
- 4.2. PESTEL analysis
- 4.3. BCG Analysis
- 4.3.1. Stars (High Growth, High Market Share)
- 4.3.2. Cash Cows (Low Growth, High Market Share)
- 4.3.3. Question Mark (High Growth, Low Market Share)
- 4.3.4. Dogs (Low Growth, Low Market Share)
- 4.4. Ansoff Matrix Analysis
- 4.5. Supply Chain Analysis
- 4.6. Regulatory Landscape
- 4.7. Current Market Potential and Opportunity Assessment (TAM–SAM–SOM Framework)
- 4.8. RAX Analyst Note
- 4.1. Porters Five Forces
- 5. Market Analysis, Insights and Forecast 2021-2033
- 5.1. Market Analysis, Insights and Forecast - by Application
- 5.1.1. Men
- 5.1.2. Women
- 5.2. Market Analysis, Insights and Forecast - by Types
- 5.2.1. Hair Loss and Growth Devices
- 5.2.2. Shampoos and Conditioners
- 5.2.3. Medicine Product
- 5.2.4. Others
- 5.3. Market Analysis, Insights and Forecast - by Region
- 5.3.1. North America
- 5.3.2. South America
- 5.3.3. Europe
- 5.3.4. Middle East & Africa
- 5.3.5. Asia Pacific
- 5.1. Market Analysis, Insights and Forecast - by Application
- 6. Global Hair Loss Products Analysis, Insights and Forecast, 2021-2033
- 6.1. Market Analysis, Insights and Forecast - by Application
- 6.1.1. Men
- 6.1.2. Women
- 6.2. Market Analysis, Insights and Forecast - by Types
- 6.2.1. Hair Loss and Growth Devices
- 6.2.2. Shampoos and Conditioners
- 6.2.3. Medicine Product
- 6.2.4. Others
- 6.1. Market Analysis, Insights and Forecast - by Application
- 7. North America Hair Loss Products Analysis, Insights and Forecast, 2020-2032
- 7.1. Market Analysis, Insights and Forecast - by Application
- 7.1.1. Men
- 7.1.2. Women
- 7.2. Market Analysis, Insights and Forecast - by Types
- 7.2.1. Hair Loss and Growth Devices
- 7.2.2. Shampoos and Conditioners
- 7.2.3. Medicine Product
- 7.2.4. Others
- 7.1. Market Analysis, Insights and Forecast - by Application
- 8. South America Hair Loss Products Analysis, Insights and Forecast, 2020-2032
- 8.1. Market Analysis, Insights and Forecast - by Application
- 8.1.1. Men
- 8.1.2. Women
- 8.2. Market Analysis, Insights and Forecast - by Types
- 8.2.1. Hair Loss and Growth Devices
- 8.2.2. Shampoos and Conditioners
- 8.2.3. Medicine Product
- 8.2.4. Others
- 8.1. Market Analysis, Insights and Forecast - by Application
- 9. Europe Hair Loss Products Analysis, Insights and Forecast, 2020-2032
- 9.1. Market Analysis, Insights and Forecast - by Application
- 9.1.1. Men
- 9.1.2. Women
- 9.2. Market Analysis, Insights and Forecast - by Types
- 9.2.1. Hair Loss and Growth Devices
- 9.2.2. Shampoos and Conditioners
- 9.2.3. Medicine Product
- 9.2.4. Others
- 9.1. Market Analysis, Insights and Forecast - by Application
- 10. Middle East & Africa Hair Loss Products Analysis, Insights and Forecast, 2020-2032
- 10.1. Market Analysis, Insights and Forecast - by Application
- 10.1.1. Men
- 10.1.2. Women
- 10.2. Market Analysis, Insights and Forecast - by Types
- 10.2.1. Hair Loss and Growth Devices
- 10.2.2. Shampoos and Conditioners
- 10.2.3. Medicine Product
- 10.2.4. Others
- 10.1. Market Analysis, Insights and Forecast - by Application
- 11. Asia Pacific Hair Loss Products Analysis, Insights and Forecast, 2020-2032
- 11.1. Market Analysis, Insights and Forecast - by Application
- 11.1.1. Men
- 11.1.2. Women
- 11.2. Market Analysis, Insights and Forecast - by Types
- 11.2.1. Hair Loss and Growth Devices
- 11.2.2. Shampoos and Conditioners
- 11.2.3. Medicine Product
- 11.2.4. Others
- 11.1. Market Analysis, Insights and Forecast - by Application
- 12. Competitive Analysis
- 12.1. Company Profiles
- 12.1.1 L’Oreal
- 12.1.1.1. Company Overview
- 12.1.1.2. Products
- 12.1.1.3. Company Financials
- 12.1.1.4. SWOT Analysis
- 12.1.2 Unilever
- 12.1.2.1. Company Overview
- 12.1.2.2. Products
- 12.1.2.3. Company Financials
- 12.1.2.4. SWOT Analysis
- 12.1.3 Taisho
- 12.1.3.1. Company Overview
- 12.1.3.2. Products
- 12.1.3.3. Company Financials
- 12.1.3.4. SWOT Analysis
- 12.1.4 Henkel
- 12.1.4.1. Company Overview
- 12.1.4.2. Products
- 12.1.4.3. Company Financials
- 12.1.4.4. SWOT Analysis
- 12.1.5 Merck
- 12.1.5.1. Company Overview
- 12.1.5.2. Products
- 12.1.5.3. Company Financials
- 12.1.5.4. SWOT Analysis
- 12.1.6 Shiseido
- 12.1.6.1. Company Overview
- 12.1.6.2. Products
- 12.1.6.3. Company Financials
- 12.1.6.4. SWOT Analysis
- 12.1.7 Johnson & Johnson Consumer Inc.
- 12.1.7.1. Company Overview
- 12.1.7.2. Products
- 12.1.7.3. Company Financials
- 12.1.7.4. SWOT Analysis
- 12.1.8 Rohto
- 12.1.8.1. Company Overview
- 12.1.8.2. Products
- 12.1.8.3. Company Financials
- 12.1.8.4. SWOT Analysis
- 12.1.9 Lifes2Good
- 12.1.9.1. Company Overview
- 12.1.9.2. Products
- 12.1.9.3. Company Financials
- 12.1.9.4. SWOT Analysis
- 12.1.10 Gerolymatos International
- 12.1.10.1. Company Overview
- 12.1.10.2. Products
- 12.1.10.3. Company Financials
- 12.1.10.4. SWOT Analysis
- 12.1.11 Toppik
- 12.1.11.1. Company Overview
- 12.1.11.2. Products
- 12.1.11.3. Company Financials
- 12.1.11.4. SWOT Analysis
- 12.1.12 Nanogen
- 12.1.12.1. Company Overview
- 12.1.12.2. Products
- 12.1.12.3. Company Financials
- 12.1.12.4. SWOT Analysis
- 12.1.13 Oxford BioLabs Ltd.
- 12.1.13.1. Company Overview
- 12.1.13.2. Products
- 12.1.13.3. Company Financials
- 12.1.13.4. SWOT Analysis
- 12.1.14 Ultrax Labs
- 12.1.14.1. Company Overview
- 12.1.14.2. Products
- 12.1.14.3. Company Financials
- 12.1.14.4. SWOT Analysis
- 12.1.15 Avalon Natural Products
- 12.1.15.1. Company Overview
- 12.1.15.2. Products
- 12.1.15.3. Company Financials
- 12.1.15.4. SWOT Analysis
- 12.1.16 Bayer
- 12.1.16.1. Company Overview
- 12.1.16.2. Products
- 12.1.16.3. Company Financials
- 12.1.16.4. SWOT Analysis
- 12.1.17 Pharma Medico
- 12.1.17.1. Company Overview
- 12.1.17.2. Products
- 12.1.17.3. Company Financials
- 12.1.17.4. SWOT Analysis
- 12.1.18 Kirkland Signature
- 12.1.18.1. Company Overview
- 12.1.18.2. Products
- 12.1.18.3. Company Financials
- 12.1.18.4. SWOT Analysis
- 12.1.19 Phyto Ales Group
- 12.1.19.1. Company Overview
- 12.1.19.2. Products
- 12.1.19.3. Company Financials
- 12.1.19.4. SWOT Analysis
- 12.1.20 Amplixin
- 12.1.20.1. Company Overview
- 12.1.20.2. Products
- 12.1.20.3. Company Financials
- 12.1.20.4. SWOT Analysis
- 12.1.21 Kerafiber
- 12.1.21.1. Company Overview
- 12.1.21.2. Products
- 12.1.21.3. Company Financials
- 12.1.21.4. SWOT Analysis
- 12.1.22 Phyto
- 12.1.22.1. Company Overview
- 12.1.22.2. Products
- 12.1.22.3. Company Financials
- 12.1.22.4. SWOT Analysis
- 12.1.23 Keranique
- 12.1.23.1. Company Overview
- 12.1.23.2. Products
- 12.1.23.3. Company Financials
- 12.1.23.4. SWOT Analysis
- 12.1.24 DS Healthcare Group
- 12.1.24.1. Company Overview
- 12.1.24.2. Products
- 12.1.24.3. Company Financials
- 12.1.24.4. SWOT Analysis
- 12.1.25 Kaminomoto
- 12.1.25.1. Company Overview
- 12.1.25.2. Products
- 12.1.25.3. Company Financials
- 12.1.25.4. SWOT Analysis
- 12.1.26 Softto
- 12.1.26.1. Company Overview
- 12.1.26.2. Products
- 12.1.26.3. Company Financials
- 12.1.26.4. SWOT Analysis
- 12.1.27 Bawang
- 12.1.27.1. Company Overview
- 12.1.27.2. Products
- 12.1.27.3. Company Financials
- 12.1.27.4. SWOT Analysis
- 12.1.28 Zhang Guang 101
- 12.1.28.1. Company Overview
- 12.1.28.2. Products
- 12.1.28.3. Company Financials
- 12.1.28.4. SWOT Analysis
- 12.1.1 L’Oreal
- 12.2. Market Entropy
- 12.2.1 Company's Key Areas Served
- 12.2.2 Recent Developments
- 12.3. Company Market Share Analysis 2025
- 12.3.1 Top 5 Companies Market Share Analysis
- 12.3.2 Top 3 Companies Market Share Analysis
- 12.4. List of Potential Customers
- 13. Research Methodology
List of Figures
- Figure 1: Global Hair Loss Products Revenue Breakdown (undefined, %) by Region 2025 & 2033
- Figure 2: Global Hair Loss Products Volume Breakdown (K, %) by Region 2025 & 2033
- Figure 3: North America Hair Loss Products Revenue (undefined), by Application 2025 & 2033
- Figure 4: North America Hair Loss Products Volume (K), by Application 2025 & 2033
- Figure 5: North America Hair Loss Products Revenue Share (%), by Application 2025 & 2033
- Figure 6: North America Hair Loss Products Volume Share (%), by Application 2025 & 2033
- Figure 7: North America Hair Loss Products Revenue (undefined), by Types 2025 & 2033
- Figure 8: North America Hair Loss Products Volume (K), by Types 2025 & 2033
- Figure 9: North America Hair Loss Products Revenue Share (%), by Types 2025 & 2033
- Figure 10: North America Hair Loss Products Volume Share (%), by Types 2025 & 2033
- Figure 11: North America Hair Loss Products Revenue (undefined), by Country 2025 & 2033
- Figure 12: North America Hair Loss Products Volume (K), by Country 2025 & 2033
- Figure 13: North America Hair Loss Products Revenue Share (%), by Country 2025 & 2033
- Figure 14: North America Hair Loss Products Volume Share (%), by Country 2025 & 2033
- Figure 15: South America Hair Loss Products Revenue (undefined), by Application 2025 & 2033
- Figure 16: South America Hair Loss Products Volume (K), by Application 2025 & 2033
- Figure 17: South America Hair Loss Products Revenue Share (%), by Application 2025 & 2033
- Figure 18: South America Hair Loss Products Volume Share (%), by Application 2025 & 2033
- Figure 19: South America Hair Loss Products Revenue (undefined), by Types 2025 & 2033
- Figure 20: South America Hair Loss Products Volume (K), by Types 2025 & 2033
- Figure 21: South America Hair Loss Products Revenue Share (%), by Types 2025 & 2033
- Figure 22: South America Hair Loss Products Volume Share (%), by Types 2025 & 2033
- Figure 23: South America Hair Loss Products Revenue (undefined), by Country 2025 & 2033
- Figure 24: South America Hair Loss Products Volume (K), by Country 2025 & 2033
- Figure 25: South America Hair Loss Products Revenue Share (%), by Country 2025 & 2033
- Figure 26: South America Hair Loss Products Volume Share (%), by Country 2025 & 2033
- Figure 27: Europe Hair Loss Products Revenue (undefined), by Application 2025 & 2033
- Figure 28: Europe Hair Loss Products Volume (K), by Application 2025 & 2033
- Figure 29: Europe Hair Loss Products Revenue Share (%), by Application 2025 & 2033
- Figure 30: Europe Hair Loss Products Volume Share (%), by Application 2025 & 2033
- Figure 31: Europe Hair Loss Products Revenue (undefined), by Types 2025 & 2033
- Figure 32: Europe Hair Loss Products Volume (K), by Types 2025 & 2033
- Figure 33: Europe Hair Loss Products Revenue Share (%), by Types 2025 & 2033
- Figure 34: Europe Hair Loss Products Volume Share (%), by Types 2025 & 2033
- Figure 35: Europe Hair Loss Products Revenue (undefined), by Country 2025 & 2033
- Figure 36: Europe Hair Loss Products Volume (K), by Country 2025 & 2033
- Figure 37: Europe Hair Loss Products Revenue Share (%), by Country 2025 & 2033
- Figure 38: Europe Hair Loss Products Volume Share (%), by Country 2025 & 2033
- Figure 39: Middle East & Africa Hair Loss Products Revenue (undefined), by Application 2025 & 2033
- Figure 40: Middle East & Africa Hair Loss Products Volume (K), by Application 2025 & 2033
- Figure 41: Middle East & Africa Hair Loss Products Revenue Share (%), by Application 2025 & 2033
- Figure 42: Middle East & Africa Hair Loss Products Volume Share (%), by Application 2025 & 2033
- Figure 43: Middle East & Africa Hair Loss Products Revenue (undefined), by Types 2025 & 2033
- Figure 44: Middle East & Africa Hair Loss Products Volume (K), by Types 2025 & 2033
- Figure 45: Middle East & Africa Hair Loss Products Revenue Share (%), by Types 2025 & 2033
- Figure 46: Middle East & Africa Hair Loss Products Volume Share (%), by Types 2025 & 2033
- Figure 47: Middle East & Africa Hair Loss Products Revenue (undefined), by Country 2025 & 2033
- Figure 48: Middle East & Africa Hair Loss Products Volume (K), by Country 2025 & 2033
- Figure 49: Middle East & Africa Hair Loss Products Revenue Share (%), by Country 2025 & 2033
- Figure 50: Middle East & Africa Hair Loss Products Volume Share (%), by Country 2025 & 2033
- Figure 51: Asia Pacific Hair Loss Products Revenue (undefined), by Application 2025 & 2033
- Figure 52: Asia Pacific Hair Loss Products Volume (K), by Application 2025 & 2033
- Figure 53: Asia Pacific Hair Loss Products Revenue Share (%), by Application 2025 & 2033
- Figure 54: Asia Pacific Hair Loss Products Volume Share (%), by Application 2025 & 2033
- Figure 55: Asia Pacific Hair Loss Products Revenue (undefined), by Types 2025 & 2033
- Figure 56: Asia Pacific Hair Loss Products Volume (K), by Types 2025 & 2033
- Figure 57: Asia Pacific Hair Loss Products Revenue Share (%), by Types 2025 & 2033
- Figure 58: Asia Pacific Hair Loss Products Volume Share (%), by Types 2025 & 2033
- Figure 59: Asia Pacific Hair Loss Products Revenue (undefined), by Country 2025 & 2033
- Figure 60: Asia Pacific Hair Loss Products Volume (K), by Country 2025 & 2033
- Figure 61: Asia Pacific Hair Loss Products Revenue Share (%), by Country 2025 & 2033
- Figure 62: Asia Pacific Hair Loss Products Volume Share (%), by Country 2025 & 2033
List of Tables
- Table 1: Global Hair Loss Products Revenue undefined Forecast, by Application 2020 & 2033
- Table 2: Global Hair Loss Products Volume K Forecast, by Application 2020 & 2033
- Table 3: Global Hair Loss Products Revenue undefined Forecast, by Types 2020 & 2033
- Table 4: Global Hair Loss Products Volume K Forecast, by Types 2020 & 2033
- Table 5: Global Hair Loss Products Revenue undefined Forecast, by Region 2020 & 2033
- Table 6: Global Hair Loss Products Volume K Forecast, by Region 2020 & 2033
- Table 7: Global Hair Loss Products Revenue undefined Forecast, by Application 2020 & 2033
- Table 8: Global Hair Loss Products Volume K Forecast, by Application 2020 & 2033
- Table 9: Global Hair Loss Products Revenue undefined Forecast, by Types 2020 & 2033
- Table 10: Global Hair Loss Products Volume K Forecast, by Types 2020 & 2033
- Table 11: Global Hair Loss Products Revenue undefined Forecast, by Country 2020 & 2033
- Table 12: Global Hair Loss Products Volume K Forecast, by Country 2020 & 2033
- Table 13: United States Hair Loss Products Revenue (undefined) Forecast, by Application 2020 & 2033
- Table 14: United States Hair Loss Products Volume (K) Forecast, by Application 2020 & 2033
- Table 15: Canada Hair Loss Products Revenue (undefined) Forecast, by Application 2020 & 2033
- Table 16: Canada Hair Loss Products Volume (K) Forecast, by Application 2020 & 2033
- Table 17: Mexico Hair Loss Products Revenue (undefined) Forecast, by Application 2020 & 2033
- Table 18: Mexico Hair Loss Products Volume (K) Forecast, by Application 2020 & 2033
- Table 19: Global Hair Loss Products Revenue undefined Forecast, by Application 2020 & 2033
- Table 20: Global Hair Loss Products Volume K Forecast, by Application 2020 & 2033
- Table 21: Global Hair Loss Products Revenue undefined Forecast, by Types 2020 & 2033
- Table 22: Global Hair Loss Products Volume K Forecast, by Types 2020 & 2033
- Table 23: Global Hair Loss Products Revenue undefined Forecast, by Country 2020 & 2033
- Table 24: Global Hair Loss Products Volume K Forecast, by Country 2020 & 2033
- Table 25: Brazil Hair Loss Products Revenue (undefined) Forecast, by Application 2020 & 2033
- Table 26: Brazil Hair Loss Products Volume (K) Forecast, by Application 2020 & 2033
- Table 27: Argentina Hair Loss Products Revenue (undefined) Forecast, by Application 2020 & 2033
- Table 28: Argentina Hair Loss Products Volume (K) Forecast, by Application 2020 & 2033
- Table 29: Rest of South America Hair Loss Products Revenue (undefined) Forecast, by Application 2020 & 2033
- Table 30: Rest of South America Hair Loss Products Volume (K) Forecast, by Application 2020 & 2033
- Table 31: Global Hair Loss Products Revenue undefined Forecast, by Application 2020 & 2033
- Table 32: Global Hair Loss Products Volume K Forecast, by Application 2020 & 2033
- Table 33: Global Hair Loss Products Revenue undefined Forecast, by Types 2020 & 2033
- Table 34: Global Hair Loss Products Volume K Forecast, by Types 2020 & 2033
- Table 35: Global Hair Loss Products Revenue undefined Forecast, by Country 2020 & 2033
- Table 36: Global Hair Loss Products Volume K Forecast, by Country 2020 & 2033
- Table 37: United Kingdom Hair Loss Products Revenue (undefined) Forecast, by Application 2020 & 2033
- Table 38: United Kingdom Hair Loss Products Volume (K) Forecast, by Application 2020 & 2033
- Table 39: Germany Hair Loss Products Revenue (undefined) Forecast, by Application 2020 & 2033
- Table 40: Germany Hair Loss Products Volume (K) Forecast, by Application 2020 & 2033
- Table 41: France Hair Loss Products Revenue (undefined) Forecast, by Application 2020 & 2033
- Table 42: France Hair Loss Products Volume (K) Forecast, by Application 2020 & 2033
- Table 43: Italy Hair Loss Products Revenue (undefined) Forecast, by Application 2020 & 2033
- Table 44: Italy Hair Loss Products Volume (K) Forecast, by Application 2020 & 2033
- Table 45: Spain Hair Loss Products Revenue (undefined) Forecast, by Application 2020 & 2033
- Table 46: Spain Hair Loss Products Volume (K) Forecast, by Application 2020 & 2033
- Table 47: Russia Hair Loss Products Revenue (undefined) Forecast, by Application 2020 & 2033
- Table 48: Russia Hair Loss Products Volume (K) Forecast, by Application 2020 & 2033
- Table 49: Benelux Hair Loss Products Revenue (undefined) Forecast, by Application 2020 & 2033
- Table 50: Benelux Hair Loss Products Volume (K) Forecast, by Application 2020 & 2033
- Table 51: Nordics Hair Loss Products Revenue (undefined) Forecast, by Application 2020 & 2033
- Table 52: Nordics Hair Loss Products Volume (K) Forecast, by Application 2020 & 2033
- Table 53: Rest of Europe Hair Loss Products Revenue (undefined) Forecast, by Application 2020 & 2033
- Table 54: Rest of Europe Hair Loss Products Volume (K) Forecast, by Application 2020 & 2033
- Table 55: Global Hair Loss Products Revenue undefined Forecast, by Application 2020 & 2033
- Table 56: Global Hair Loss Products Volume K Forecast, by Application 2020 & 2033
- Table 57: Global Hair Loss Products Revenue undefined Forecast, by Types 2020 & 2033
- Table 58: Global Hair Loss Products Volume K Forecast, by Types 2020 & 2033
- Table 59: Global Hair Loss Products Revenue undefined Forecast, by Country 2020 & 2033
- Table 60: Global Hair Loss Products Volume K Forecast, by Country 2020 & 2033
- Table 61: Turkey Hair Loss Products Revenue (undefined) Forecast, by Application 2020 & 2033
- Table 62: Turkey Hair Loss Products Volume (K) Forecast, by Application 2020 & 2033
- Table 63: Israel Hair Loss Products Revenue (undefined) Forecast, by Application 2020 & 2033
- Table 64: Israel Hair Loss Products Volume (K) Forecast, by Application 2020 & 2033
- Table 65: GCC Hair Loss Products Revenue (undefined) Forecast, by Application 2020 & 2033
- Table 66: GCC Hair Loss Products Volume (K) Forecast, by Application 2020 & 2033
- Table 67: North Africa Hair Loss Products Revenue (undefined) Forecast, by Application 2020 & 2033
- Table 68: North Africa Hair Loss Products Volume (K) Forecast, by Application 2020 & 2033
- Table 69: South Africa Hair Loss Products Revenue (undefined) Forecast, by Application 2020 & 2033
- Table 70: South Africa Hair Loss Products Volume (K) Forecast, by Application 2020 & 2033
- Table 71: Rest of Middle East & Africa Hair Loss Products Revenue (undefined) Forecast, by Application 2020 & 2033
- Table 72: Rest of Middle East & Africa Hair Loss Products Volume (K) Forecast, by Application 2020 & 2033
- Table 73: Global Hair Loss Products Revenue undefined Forecast, by Application 2020 & 2033
- Table 74: Global Hair Loss Products Volume K Forecast, by Application 2020 & 2033
- Table 75: Global Hair Loss Products Revenue undefined Forecast, by Types 2020 & 2033
- Table 76: Global Hair Loss Products Volume K Forecast, by Types 2020 & 2033
- Table 77: Global Hair Loss Products Revenue undefined Forecast, by Country 2020 & 2033
- Table 78: Global Hair Loss Products Volume K Forecast, by Country 2020 & 2033
- Table 79: China Hair Loss Products Revenue (undefined) Forecast, by Application 2020 & 2033
- Table 80: China Hair Loss Products Volume (K) Forecast, by Application 2020 & 2033
- Table 81: India Hair Loss Products Revenue (undefined) Forecast, by Application 2020 & 2033
- Table 82: India Hair Loss Products Volume (K) Forecast, by Application 2020 & 2033
- Table 83: Japan Hair Loss Products Revenue (undefined) Forecast, by Application 2020 & 2033
- Table 84: Japan Hair Loss Products Volume (K) Forecast, by Application 2020 & 2033
- Table 85: South Korea Hair Loss Products Revenue (undefined) Forecast, by Application 2020 & 2033
- Table 86: South Korea Hair Loss Products Volume (K) Forecast, by Application 2020 & 2033
- Table 87: ASEAN Hair Loss Products Revenue (undefined) Forecast, by Application 2020 & 2033
- Table 88: ASEAN Hair Loss Products Volume (K) Forecast, by Application 2020 & 2033
- Table 89: Oceania Hair Loss Products Revenue (undefined) Forecast, by Application 2020 & 2033
- Table 90: Oceania Hair Loss Products Volume (K) Forecast, by Application 2020 & 2033
- Table 91: Rest of Asia Pacific Hair Loss Products Revenue (undefined) Forecast, by Application 2020 & 2033
- Table 92: Rest of Asia Pacific Hair Loss Products Volume (K) Forecast, by Application 2020 & 2033
Frequently Asked Questions
1. What is the projected Compound Annual Growth Rate (CAGR) of the Hair Loss Products?
The projected CAGR is approximately 6.2%.
2. Which companies are prominent players in the Hair Loss Products?
Key companies in the market include L’Oreal, Unilever, Taisho, Henkel, Merck, Shiseido, Johnson & Johnson Consumer Inc., Rohto, Lifes2Good, Gerolymatos International, Toppik, Nanogen, Oxford BioLabs Ltd., Ultrax Labs, Avalon Natural Products, Bayer, Pharma Medico, Kirkland Signature, Phyto Ales Group, Amplixin, Kerafiber, Phyto, Keranique, DS Healthcare Group, Kaminomoto, Softto, Bawang, Zhang Guang 101.
3. What are the main segments of the Hair Loss Products?
The market segments include Application, Types.
4. Can you provide details about the market size?
The market size is estimated to be USD XXX N/A as of 2022.
5. What are some drivers contributing to market growth?
N/A
6. What are the notable trends driving market growth?
N/A
7. Are there any restraints impacting market growth?
N/A
8. Can you provide examples of recent developments in the market?
N/A
9. What pricing options are available for accessing the report?
Pricing options include single-user, multi-user, and enterprise licenses priced at USD 3350.00, USD 5025.00, and USD 6700.00 respectively.
10. Is the market size provided in terms of value or volume?
The market size is provided in terms of value, measured in N/A and volume, measured in K.
11. Are there any specific market keywords associated with the report?
Yes, the market keyword associated with the report is "Hair Loss Products," which aids in identifying and referencing the specific market segment covered.
12. How do I determine which pricing option suits my needs best?
The pricing options vary based on user requirements and access needs. Individual users may opt for single-user licenses, while businesses requiring broader access may choose multi-user or enterprise licenses for cost-effective access to the report.
13. Are there any additional resources or data provided in the Hair Loss Products report?
While the report offers comprehensive insights, it's advisable to review the specific contents or supplementary materials provided to ascertain if additional resources or data are available.
14. How can I stay updated on further developments or reports in the Hair Loss Products?
To stay informed about further developments, trends, and reports in the Hair Loss Products, consider subscribing to industry newsletters, following relevant companies and organizations, or regularly checking reputable industry news sources and publications.
Methodology
Step 1 - Identification of Relevant Samples Size from Population Database


Step 2 - Approaches for Defining Global Market Size (Value, Volume* & Price*)

Note*: In applicable scenarios
Step 3 - Data Sources
Primary Research
- Web Analytics
- Survey Reports
- Research Institute
- Latest Research Reports
- Opinion Leaders
Secondary Research
- Annual Reports
- White Paper
- Latest Press Release
- Industry Association
- Paid Database
- Investor Presentations

Step 4 - Data Triangulation
Involves using different sources of information in order to increase the validity of a study
These sources are likely to be stakeholders in a program - participants, other researchers, program staff, other community members, and so on.
Then we put all data in single framework & apply various statistical tools to find out the dynamic on the market.
During the analysis stage, feedback from the stakeholder groups would be compared to determine areas of agreement as well as areas of divergence