

Key Insights
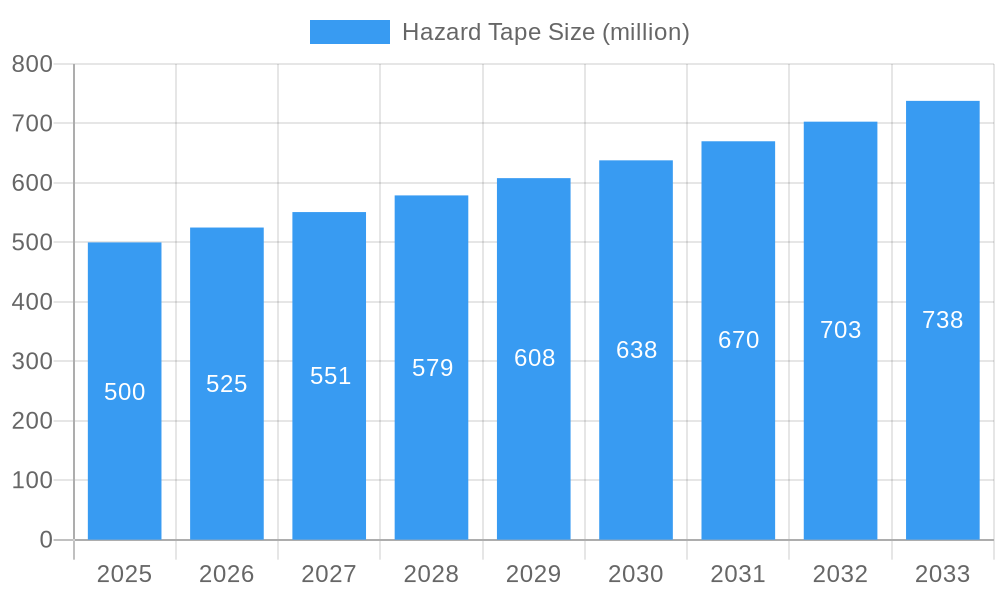
The global hazard tape market, a crucial segment encompassing caution, warning, and barricade tapes, is poised for significant expansion. This growth is primarily attributed to stringent industrial safety regulations and an escalating emphasis on workplace safety across a multitude of industries. The demand for effective hazard identification and prevention solutions in construction, manufacturing, warehousing, and transportation sectors, where clear visual demarcation is paramount for accident mitigation and injury reduction, is a key market driver. Innovations in material science, leading to the development of more durable, weather-resistant, and highly visible tapes, further enhance market appeal. The market size in 2025 is projected to be $1.33 billion, with an estimated Compound Annual Growth Rate (CAGR) of 5.4% from 2025 to 2033. Leading market participants, including ADH Tape, Luban Pack, and Presco, are actively influencing market dynamics through product development and strategic initiatives. Nonetheless, factors such as volatile raw material costs and the potential for alternative safety solutions present market challenges. The market is segmented by tape type (polyethylene, polypropylene, PVC), application (construction, industrial, transportation), and geographical region, each segment demonstrating distinct growth patterns.
Hazard Tape Market Size (In Billion)
The competitive environment features a blend of established industry leaders and burgeoning regional manufacturers. Companies with extensive distribution networks and strong brand recognition currently dominate market share. However, smaller enterprises are making inroads by offering specialized products and competitive pricing strategies. Future market development will hinge on manufacturers' capacity for innovation and their ability to adapt to evolving industry requirements. A growing focus on sustainable and eco-friendly materials is anticipated, aligning with broader industry trends in safety and packaging. Emerging economies with rapidly expanding industrial sectors present substantial opportunities for market penetration and growth. Overall, the hazard tape market exhibits a positive trajectory, propelled by sustained demand for improved workplace safety and ongoing technological advancements.
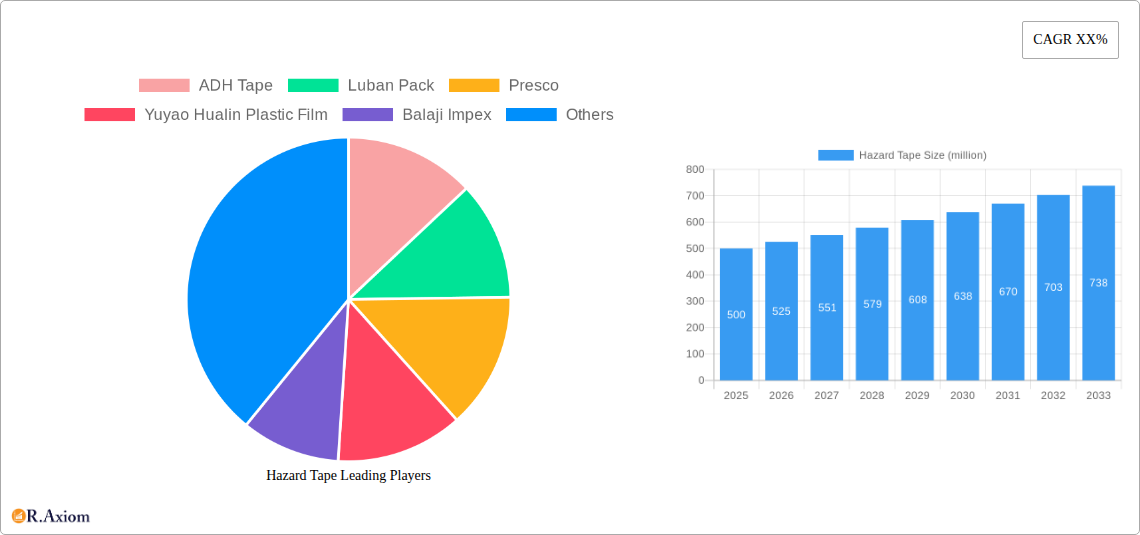
Hazard Tape Company Market Share
Hazard Tape Market Report: 2019-2033 - A Comprehensive Analysis
This comprehensive report provides an in-depth analysis of the global hazard tape market, offering invaluable insights for industry stakeholders, investors, and strategic decision-makers. With a study period spanning 2019-2033, a base year of 2025, and a forecast period of 2025-2033, this report leverages rigorous data analysis and expert insights to present a clear and actionable understanding of this dynamic market. The report projects a market value exceeding $XX million by 2033, driven by robust growth across various segments and regions.
Hazard Tape Market Concentration & Innovation
This section analyzes the competitive landscape of the hazard tape market, focusing on market concentration, innovation drivers, regulatory frameworks, product substitutes, end-user trends, and M&A activities.
The market is characterized by a moderately concentrated structure, with the top five players holding an estimated xx% market share in 2025. However, the presence of numerous smaller players indicates a competitive environment. Innovation is primarily driven by the demand for enhanced visibility, durability, and specialized applications, leading to the development of products with improved reflectivity, UV resistance, and specific adhesive properties. Regulatory frameworks, particularly concerning safety standards and environmental regulations, significantly influence product development and market access. Substitutes for hazard tape, such as paint markings or other visual aids, exist but offer limited versatility and longevity compared to the advantages of hazard tape. End-user trends show a growing preference for sustainable and cost-effective solutions, driving the adoption of recycled materials and improved manufacturing processes. M&A activity has been moderate in recent years, with deal values averaging $XX million annually during the historical period. Key M&A activities include [Insert details of 2-3 major M&A deals if available, including companies and values].
- Market Share: Top 5 players: xx% (2025)
- M&A Deal Value (Average Annual): $XX million (2019-2024)
- Key Innovation Drivers: Enhanced visibility, durability, specialized applications.
- Regulatory Impact: Safety standards, environmental regulations.
Hazard Tape Industry Trends & Insights
The global hazard tape market exhibits robust growth, driven by expanding industrial and construction activities, increasing awareness of workplace safety, and stringent regulatory compliance requirements. The Compound Annual Growth Rate (CAGR) is estimated at xx% during the forecast period (2025-2033). Technological disruptions, particularly in adhesive technology and material science, are enhancing product performance and expanding application possibilities. Consumer preferences are shifting towards environmentally friendly and high-visibility hazard tapes, leading to increased demand for biodegradable and reflective materials. The competitive landscape is characterized by intense rivalry, with companies focusing on product differentiation, cost optimization, and strategic partnerships to gain market share. Market penetration in developing economies remains significant, fuelled by rapid infrastructure development and industrialization.
- CAGR (2025-2033): xx%
- Market Penetration: Significant growth in developing economies.
- Key Growth Drivers: Expanding industrial and construction activities, increasing safety awareness, stringent regulations.
Dominant Markets & Segments in Hazard Tape
The [Specify Region/Country - e.g., North American] region currently dominates the global hazard tape market, accounting for approximately xx% of the total revenue in 2025. This dominance is attributed to several factors:
- Robust Construction and Industrial Sectors: Significant investments in infrastructure development and industrial projects drive demand for hazard tape.
- Stringent Safety Regulations: Strict compliance standards necessitate the widespread use of hazard tapes across various industries.
- Strong Economic Growth: Positive economic growth fuels investments in safety measures and infrastructure development.
[Further analysis should include a comparison of other regions and their respective growth factors. For example, mention the growth potential in Asia Pacific and its driving forces such as rising industrialization].
Hazard Tape Product Developments
Recent innovations in hazard tape technology include the development of enhanced reflectivity materials, improved adhesives for enhanced durability and adhesion on various surfaces, and bio-degradable options meeting growing sustainability concerns. These advancements have broadened hazard tape applications into diverse sectors like construction, manufacturing, healthcare, and transportation, catering to specific industry needs and enhancing safety protocols. The incorporation of advanced materials and manufacturing techniques offers competitive advantages, driving market penetration and improving product life cycles.
Report Scope & Segmentation Analysis
This report segments the hazard tape market by type (e.g., PVC, polyethylene, others), application (e.g., construction, industrial, traffic), and region (e.g., North America, Europe, Asia Pacific, etc.). Each segment displays unique growth projections and competitive dynamics, driven by specific market drivers and trends. For instance, the construction segment shows significant growth due to increased infrastructure development, while the industrial segment benefits from heightened safety regulations and the requirement of hazard tape in varied industrial operations.
Key Drivers of Hazard Tape Growth
Key growth drivers for the hazard tape market include the expansion of industrial and construction sectors globally, particularly in developing economies. Stringent safety regulations in developed countries mandating the use of hazard tapes across various workplaces are also significant contributors. Furthermore, the rise in awareness of workplace safety and the increasing adoption of hazard tape for improved visibility contribute to the expanding market. Technological advancements, such as the development of highly reflective and durable tapes, further fuel market growth.
Challenges in the Hazard Tape Sector
Challenges include fluctuating raw material prices affecting production costs and profitability. Competition from cheaper substitutes and the environmental concerns associated with certain hazard tape materials represent significant barriers. Furthermore, meeting stringent regulatory requirements and maintaining consistent supply chain operations amidst global uncertainties pose substantial challenges. These factors contribute to potential cost fluctuations and impact market expansion.
Emerging Opportunities in Hazard Tape
Emerging opportunities include the development of sustainable and eco-friendly hazard tapes using biodegradable materials and recycled content, in line with the growing demand for environmentally responsible products. Expanding into new applications, such as smart hazard tapes with integrated technology for improved safety features, presents further opportunities. Growth potential exists in niche markets requiring specialized hazard tapes, such as those resistant to extreme temperatures or chemicals.
Leading Players in the Hazard Tape Market
- ADH Tape
- Luban Pack
- Presco
- Yuyao Hualin Plastic Film
- Balaji Impex
- Singhal
- Anil Rohit Group
- Shri Ambica Plastic Industries
- Custom Tape
- PENCO
- Incom
Key Developments in Hazard Tape Industry
- 2022 Q4: Presco launches a new line of high-visibility hazard tapes with improved reflectivity.
- 2023 Q1: ADH Tape acquires a smaller competitor, expanding its market share.
- 2023 Q3: New EU regulations on hazard tape materials come into effect.
- [Add further key developments, specifying year and month if available.]
Strategic Outlook for Hazard Tape Market
The hazard tape market is poised for continued growth, fueled by factors such as rising industrialization, increasing safety awareness, and stringent regulatory requirements. Innovation in materials and technology will drive product differentiation and market expansion. Strategic partnerships and mergers & acquisitions will play a vital role in shaping the competitive landscape. Companies focusing on sustainable solutions and technological advancements will be well-positioned to capitalize on the long-term growth opportunities in this dynamic market.
Hazard Tape Segmentation
-
1. Application
- 1.1. Road
- 1.2. Factory
- 1.3. Architecture
- 1.4. Machinery
- 1.5. Others
-
2. Types
- 2.1. PVC Tape
- 2.2. PE Tape
- 2.3. Others
Hazard Tape Segmentation By Geography
-
1. North America
- 1.1. United States
- 1.2. Canada
- 1.3. Mexico
-
2. South America
- 2.1. Brazil
- 2.2. Argentina
- 2.3. Rest of South America
-
3. Europe
- 3.1. United Kingdom
- 3.2. Germany
- 3.3. France
- 3.4. Italy
- 3.5. Spain
- 3.6. Russia
- 3.7. Benelux
- 3.8. Nordics
- 3.9. Rest of Europe
-
4. Middle East & Africa
- 4.1. Turkey
- 4.2. Israel
- 4.3. GCC
- 4.4. North Africa
- 4.5. South Africa
- 4.6. Rest of Middle East & Africa
-
5. Asia Pacific
- 5.1. China
- 5.2. India
- 5.3. Japan
- 5.4. South Korea
- 5.5. ASEAN
- 5.6. Oceania
- 5.7. Rest of Asia Pacific
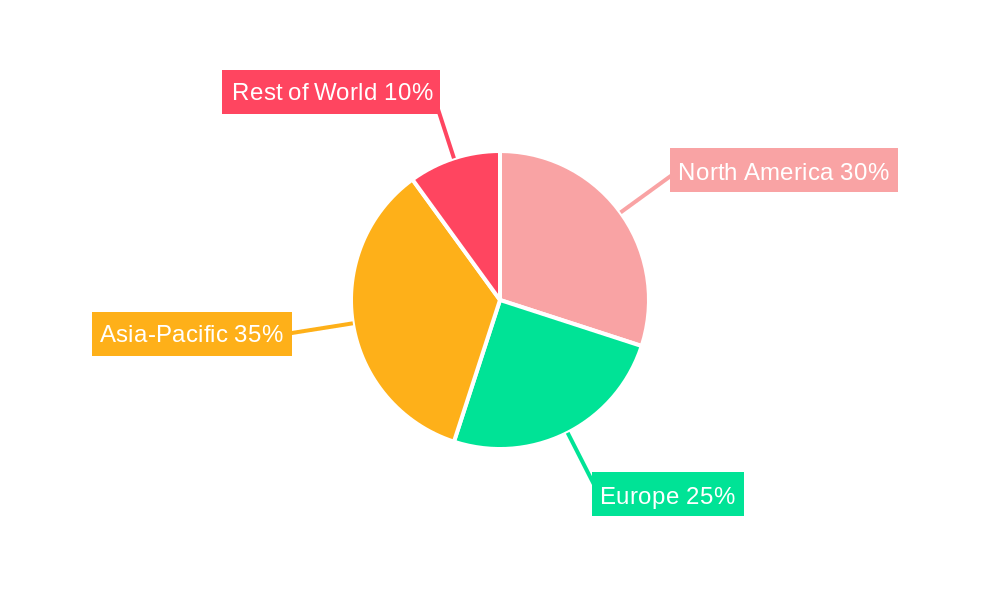
Hazard Tape Regional Market Share
Geographic Coverage of Hazard Tape
Hazard Tape REPORT HIGHLIGHTS
| Aspects | Details |
|---|---|
| Study Period | 2020-2034 |
| Base Year | 2025 |
| Estimated Year | 2026 |
| Forecast Period | 2026-2034 |
| Historical Period | 2020-2025 |
| Growth Rate | CAGR of 5.4% from 2020-2034 |
| Segmentation |
|
Table of Contents
- 1. Introduction
- 1.1. Research Scope
- 1.2. Market Segmentation
- 1.3. Research Methodology
- 1.4. Definitions and Assumptions
- 2. Executive Summary
- 2.1. Introduction
- 3. Market Dynamics
- 3.1. Introduction
- 3.2. Market Drivers
- 3.3. Market Restrains
- 3.4. Market Trends
- 4. Market Factor Analysis
- 4.1. Porters Five Forces
- 4.2. Supply/Value Chain
- 4.3. PESTEL analysis
- 4.4. Market Entropy
- 4.5. Patent/Trademark Analysis
- 5. Global Hazard Tape Analysis, Insights and Forecast, 2020-2032
- 5.1. Market Analysis, Insights and Forecast - by Application
- 5.1.1. Road
- 5.1.2. Factory
- 5.1.3. Architecture
- 5.1.4. Machinery
- 5.1.5. Others
- 5.2. Market Analysis, Insights and Forecast - by Types
- 5.2.1. PVC Tape
- 5.2.2. PE Tape
- 5.2.3. Others
- 5.3. Market Analysis, Insights and Forecast - by Region
- 5.3.1. North America
- 5.3.2. South America
- 5.3.3. Europe
- 5.3.4. Middle East & Africa
- 5.3.5. Asia Pacific
- 5.1. Market Analysis, Insights and Forecast - by Application
- 6. North America Hazard Tape Analysis, Insights and Forecast, 2020-2032
- 6.1. Market Analysis, Insights and Forecast - by Application
- 6.1.1. Road
- 6.1.2. Factory
- 6.1.3. Architecture
- 6.1.4. Machinery
- 6.1.5. Others
- 6.2. Market Analysis, Insights and Forecast - by Types
- 6.2.1. PVC Tape
- 6.2.2. PE Tape
- 6.2.3. Others
- 6.1. Market Analysis, Insights and Forecast - by Application
- 7. South America Hazard Tape Analysis, Insights and Forecast, 2020-2032
- 7.1. Market Analysis, Insights and Forecast - by Application
- 7.1.1. Road
- 7.1.2. Factory
- 7.1.3. Architecture
- 7.1.4. Machinery
- 7.1.5. Others
- 7.2. Market Analysis, Insights and Forecast - by Types
- 7.2.1. PVC Tape
- 7.2.2. PE Tape
- 7.2.3. Others
- 7.1. Market Analysis, Insights and Forecast - by Application
- 8. Europe Hazard Tape Analysis, Insights and Forecast, 2020-2032
- 8.1. Market Analysis, Insights and Forecast - by Application
- 8.1.1. Road
- 8.1.2. Factory
- 8.1.3. Architecture
- 8.1.4. Machinery
- 8.1.5. Others
- 8.2. Market Analysis, Insights and Forecast - by Types
- 8.2.1. PVC Tape
- 8.2.2. PE Tape
- 8.2.3. Others
- 8.1. Market Analysis, Insights and Forecast - by Application
- 9. Middle East & Africa Hazard Tape Analysis, Insights and Forecast, 2020-2032
- 9.1. Market Analysis, Insights and Forecast - by Application
- 9.1.1. Road
- 9.1.2. Factory
- 9.1.3. Architecture
- 9.1.4. Machinery
- 9.1.5. Others
- 9.2. Market Analysis, Insights and Forecast - by Types
- 9.2.1. PVC Tape
- 9.2.2. PE Tape
- 9.2.3. Others
- 9.1. Market Analysis, Insights and Forecast - by Application
- 10. Asia Pacific Hazard Tape Analysis, Insights and Forecast, 2020-2032
- 10.1. Market Analysis, Insights and Forecast - by Application
- 10.1.1. Road
- 10.1.2. Factory
- 10.1.3. Architecture
- 10.1.4. Machinery
- 10.1.5. Others
- 10.2. Market Analysis, Insights and Forecast - by Types
- 10.2.1. PVC Tape
- 10.2.2. PE Tape
- 10.2.3. Others
- 10.1. Market Analysis, Insights and Forecast - by Application
- 11. Competitive Analysis
- 11.1. Global Market Share Analysis 2025
- 11.2. Company Profiles
- 11.2.1 ADH Tape
- 11.2.1.1. Overview
- 11.2.1.2. Products
- 11.2.1.3. SWOT Analysis
- 11.2.1.4. Recent Developments
- 11.2.1.5. Financials (Based on Availability)
- 11.2.2 Luban Pack
- 11.2.2.1. Overview
- 11.2.2.2. Products
- 11.2.2.3. SWOT Analysis
- 11.2.2.4. Recent Developments
- 11.2.2.5. Financials (Based on Availability)
- 11.2.3 Presco
- 11.2.3.1. Overview
- 11.2.3.2. Products
- 11.2.3.3. SWOT Analysis
- 11.2.3.4. Recent Developments
- 11.2.3.5. Financials (Based on Availability)
- 11.2.4 Yuyao Hualin Plastic Film
- 11.2.4.1. Overview
- 11.2.4.2. Products
- 11.2.4.3. SWOT Analysis
- 11.2.4.4. Recent Developments
- 11.2.4.5. Financials (Based on Availability)
- 11.2.5 Balaji Impex
- 11.2.5.1. Overview
- 11.2.5.2. Products
- 11.2.5.3. SWOT Analysis
- 11.2.5.4. Recent Developments
- 11.2.5.5. Financials (Based on Availability)
- 11.2.6 Singhal
- 11.2.6.1. Overview
- 11.2.6.2. Products
- 11.2.6.3. SWOT Analysis
- 11.2.6.4. Recent Developments
- 11.2.6.5. Financials (Based on Availability)
- 11.2.7 Anil Rohit Group
- 11.2.7.1. Overview
- 11.2.7.2. Products
- 11.2.7.3. SWOT Analysis
- 11.2.7.4. Recent Developments
- 11.2.7.5. Financials (Based on Availability)
- 11.2.8 Shri Ambica Plastic Industries
- 11.2.8.1. Overview
- 11.2.8.2. Products
- 11.2.8.3. SWOT Analysis
- 11.2.8.4. Recent Developments
- 11.2.8.5. Financials (Based on Availability)
- 11.2.9 Custom Tape
- 11.2.9.1. Overview
- 11.2.9.2. Products
- 11.2.9.3. SWOT Analysis
- 11.2.9.4. Recent Developments
- 11.2.9.5. Financials (Based on Availability)
- 11.2.10 PENCO
- 11.2.10.1. Overview
- 11.2.10.2. Products
- 11.2.10.3. SWOT Analysis
- 11.2.10.4. Recent Developments
- 11.2.10.5. Financials (Based on Availability)
- 11.2.11 Incom
- 11.2.11.1. Overview
- 11.2.11.2. Products
- 11.2.11.3. SWOT Analysis
- 11.2.11.4. Recent Developments
- 11.2.11.5. Financials (Based on Availability)
- 11.2.1 ADH Tape
List of Figures
- Figure 1: Global Hazard Tape Revenue Breakdown (billion, %) by Region 2025 & 2033
- Figure 2: North America Hazard Tape Revenue (billion), by Application 2025 & 2033
- Figure 3: North America Hazard Tape Revenue Share (%), by Application 2025 & 2033
- Figure 4: North America Hazard Tape Revenue (billion), by Types 2025 & 2033
- Figure 5: North America Hazard Tape Revenue Share (%), by Types 2025 & 2033
- Figure 6: North America Hazard Tape Revenue (billion), by Country 2025 & 2033
- Figure 7: North America Hazard Tape Revenue Share (%), by Country 2025 & 2033
- Figure 8: South America Hazard Tape Revenue (billion), by Application 2025 & 2033
- Figure 9: South America Hazard Tape Revenue Share (%), by Application 2025 & 2033
- Figure 10: South America Hazard Tape Revenue (billion), by Types 2025 & 2033
- Figure 11: South America Hazard Tape Revenue Share (%), by Types 2025 & 2033
- Figure 12: South America Hazard Tape Revenue (billion), by Country 2025 & 2033
- Figure 13: South America Hazard Tape Revenue Share (%), by Country 2025 & 2033
- Figure 14: Europe Hazard Tape Revenue (billion), by Application 2025 & 2033
- Figure 15: Europe Hazard Tape Revenue Share (%), by Application 2025 & 2033
- Figure 16: Europe Hazard Tape Revenue (billion), by Types 2025 & 2033
- Figure 17: Europe Hazard Tape Revenue Share (%), by Types 2025 & 2033
- Figure 18: Europe Hazard Tape Revenue (billion), by Country 2025 & 2033
- Figure 19: Europe Hazard Tape Revenue Share (%), by Country 2025 & 2033
- Figure 20: Middle East & Africa Hazard Tape Revenue (billion), by Application 2025 & 2033
- Figure 21: Middle East & Africa Hazard Tape Revenue Share (%), by Application 2025 & 2033
- Figure 22: Middle East & Africa Hazard Tape Revenue (billion), by Types 2025 & 2033
- Figure 23: Middle East & Africa Hazard Tape Revenue Share (%), by Types 2025 & 2033
- Figure 24: Middle East & Africa Hazard Tape Revenue (billion), by Country 2025 & 2033
- Figure 25: Middle East & Africa Hazard Tape Revenue Share (%), by Country 2025 & 2033
- Figure 26: Asia Pacific Hazard Tape Revenue (billion), by Application 2025 & 2033
- Figure 27: Asia Pacific Hazard Tape Revenue Share (%), by Application 2025 & 2033
- Figure 28: Asia Pacific Hazard Tape Revenue (billion), by Types 2025 & 2033
- Figure 29: Asia Pacific Hazard Tape Revenue Share (%), by Types 2025 & 2033
- Figure 30: Asia Pacific Hazard Tape Revenue (billion), by Country 2025 & 2033
- Figure 31: Asia Pacific Hazard Tape Revenue Share (%), by Country 2025 & 2033
List of Tables
- Table 1: Global Hazard Tape Revenue billion Forecast, by Application 2020 & 2033
- Table 2: Global Hazard Tape Revenue billion Forecast, by Types 2020 & 2033
- Table 3: Global Hazard Tape Revenue billion Forecast, by Region 2020 & 2033
- Table 4: Global Hazard Tape Revenue billion Forecast, by Application 2020 & 2033
- Table 5: Global Hazard Tape Revenue billion Forecast, by Types 2020 & 2033
- Table 6: Global Hazard Tape Revenue billion Forecast, by Country 2020 & 2033
- Table 7: United States Hazard Tape Revenue (billion) Forecast, by Application 2020 & 2033
- Table 8: Canada Hazard Tape Revenue (billion) Forecast, by Application 2020 & 2033
- Table 9: Mexico Hazard Tape Revenue (billion) Forecast, by Application 2020 & 2033
- Table 10: Global Hazard Tape Revenue billion Forecast, by Application 2020 & 2033
- Table 11: Global Hazard Tape Revenue billion Forecast, by Types 2020 & 2033
- Table 12: Global Hazard Tape Revenue billion Forecast, by Country 2020 & 2033
- Table 13: Brazil Hazard Tape Revenue (billion) Forecast, by Application 2020 & 2033
- Table 14: Argentina Hazard Tape Revenue (billion) Forecast, by Application 2020 & 2033
- Table 15: Rest of South America Hazard Tape Revenue (billion) Forecast, by Application 2020 & 2033
- Table 16: Global Hazard Tape Revenue billion Forecast, by Application 2020 & 2033
- Table 17: Global Hazard Tape Revenue billion Forecast, by Types 2020 & 2033
- Table 18: Global Hazard Tape Revenue billion Forecast, by Country 2020 & 2033
- Table 19: United Kingdom Hazard Tape Revenue (billion) Forecast, by Application 2020 & 2033
- Table 20: Germany Hazard Tape Revenue (billion) Forecast, by Application 2020 & 2033
- Table 21: France Hazard Tape Revenue (billion) Forecast, by Application 2020 & 2033
- Table 22: Italy Hazard Tape Revenue (billion) Forecast, by Application 2020 & 2033
- Table 23: Spain Hazard Tape Revenue (billion) Forecast, by Application 2020 & 2033
- Table 24: Russia Hazard Tape Revenue (billion) Forecast, by Application 2020 & 2033
- Table 25: Benelux Hazard Tape Revenue (billion) Forecast, by Application 2020 & 2033
- Table 26: Nordics Hazard Tape Revenue (billion) Forecast, by Application 2020 & 2033
- Table 27: Rest of Europe Hazard Tape Revenue (billion) Forecast, by Application 2020 & 2033
- Table 28: Global Hazard Tape Revenue billion Forecast, by Application 2020 & 2033
- Table 29: Global Hazard Tape Revenue billion Forecast, by Types 2020 & 2033
- Table 30: Global Hazard Tape Revenue billion Forecast, by Country 2020 & 2033
- Table 31: Turkey Hazard Tape Revenue (billion) Forecast, by Application 2020 & 2033
- Table 32: Israel Hazard Tape Revenue (billion) Forecast, by Application 2020 & 2033
- Table 33: GCC Hazard Tape Revenue (billion) Forecast, by Application 2020 & 2033
- Table 34: North Africa Hazard Tape Revenue (billion) Forecast, by Application 2020 & 2033
- Table 35: South Africa Hazard Tape Revenue (billion) Forecast, by Application 2020 & 2033
- Table 36: Rest of Middle East & Africa Hazard Tape Revenue (billion) Forecast, by Application 2020 & 2033
- Table 37: Global Hazard Tape Revenue billion Forecast, by Application 2020 & 2033
- Table 38: Global Hazard Tape Revenue billion Forecast, by Types 2020 & 2033
- Table 39: Global Hazard Tape Revenue billion Forecast, by Country 2020 & 2033
- Table 40: China Hazard Tape Revenue (billion) Forecast, by Application 2020 & 2033
- Table 41: India Hazard Tape Revenue (billion) Forecast, by Application 2020 & 2033
- Table 42: Japan Hazard Tape Revenue (billion) Forecast, by Application 2020 & 2033
- Table 43: South Korea Hazard Tape Revenue (billion) Forecast, by Application 2020 & 2033
- Table 44: ASEAN Hazard Tape Revenue (billion) Forecast, by Application 2020 & 2033
- Table 45: Oceania Hazard Tape Revenue (billion) Forecast, by Application 2020 & 2033
- Table 46: Rest of Asia Pacific Hazard Tape Revenue (billion) Forecast, by Application 2020 & 2033
Frequently Asked Questions
1. What is the projected Compound Annual Growth Rate (CAGR) of the Hazard Tape?
The projected CAGR is approximately 5.4%.
2. Which companies are prominent players in the Hazard Tape?
Key companies in the market include ADH Tape, Luban Pack, Presco, Yuyao Hualin Plastic Film, Balaji Impex, Singhal, Anil Rohit Group, Shri Ambica Plastic Industries, Custom Tape, PENCO, Incom.
3. What are the main segments of the Hazard Tape?
The market segments include Application, Types.
4. Can you provide details about the market size?
The market size is estimated to be USD 1.33 billion as of 2022.
5. What are some drivers contributing to market growth?
N/A
6. What are the notable trends driving market growth?
N/A
7. Are there any restraints impacting market growth?
N/A
8. Can you provide examples of recent developments in the market?
N/A
9. What pricing options are available for accessing the report?
Pricing options include single-user, multi-user, and enterprise licenses priced at USD 4900.00, USD 7350.00, and USD 9800.00 respectively.
10. Is the market size provided in terms of value or volume?
The market size is provided in terms of value, measured in billion.
11. Are there any specific market keywords associated with the report?
Yes, the market keyword associated with the report is "Hazard Tape," which aids in identifying and referencing the specific market segment covered.
12. How do I determine which pricing option suits my needs best?
The pricing options vary based on user requirements and access needs. Individual users may opt for single-user licenses, while businesses requiring broader access may choose multi-user or enterprise licenses for cost-effective access to the report.
13. Are there any additional resources or data provided in the Hazard Tape report?
While the report offers comprehensive insights, it's advisable to review the specific contents or supplementary materials provided to ascertain if additional resources or data are available.
14. How can I stay updated on further developments or reports in the Hazard Tape?
To stay informed about further developments, trends, and reports in the Hazard Tape, consider subscribing to industry newsletters, following relevant companies and organizations, or regularly checking reputable industry news sources and publications.
Methodology
Step 1 - Identification of Relevant Samples Size from Population Database


Step 2 - Approaches for Defining Global Market Size (Value, Volume* & Price*)

Note*: In applicable scenarios
Step 3 - Data Sources
Primary Research
- Web Analytics
- Survey Reports
- Research Institute
- Latest Research Reports
- Opinion Leaders
Secondary Research
- Annual Reports
- White Paper
- Latest Press Release
- Industry Association
- Paid Database
- Investor Presentations

Step 4 - Data Triangulation
Involves using different sources of information in order to increase the validity of a study
These sources are likely to be stakeholders in a program - participants, other researchers, program staff, other community members, and so on.
Then we put all data in single framework & apply various statistical tools to find out the dynamic on the market.
During the analysis stage, feedback from the stakeholder groups would be compared to determine areas of agreement as well as areas of divergence