

Key Insights
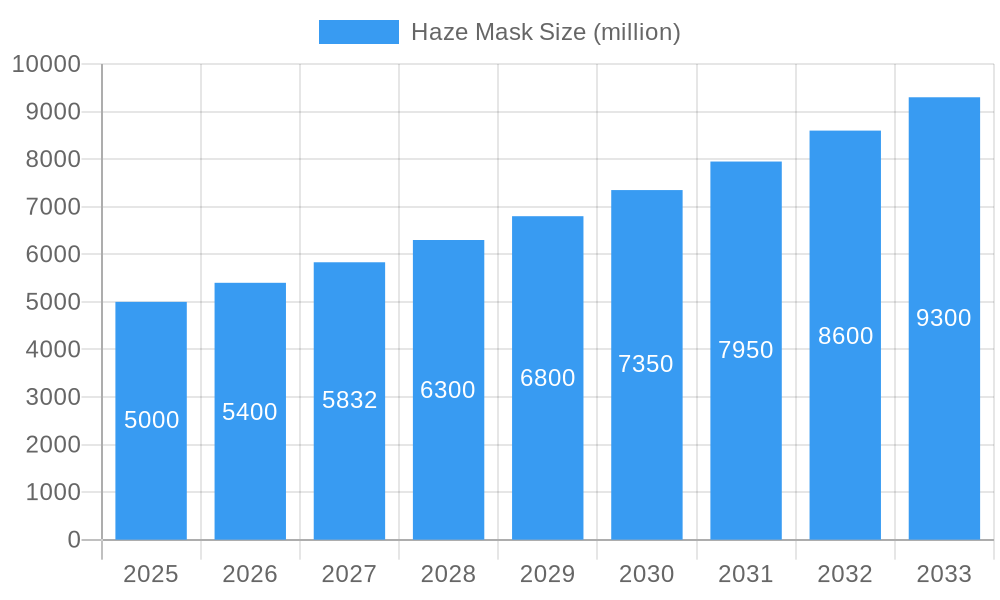
The haze mask market, while experiencing fluctuations, demonstrates strong growth potential driven by increasing air pollution concerns globally and a rising awareness of respiratory health. The market, estimated at $5 billion in 2025, is projected to experience a Compound Annual Growth Rate (CAGR) of 8% from 2025 to 2033, reaching approximately $9.5 billion by 2033. Key drivers include escalating urbanization leading to poorer air quality, government initiatives promoting public health and safety, and the increasing prevalence of respiratory illnesses linked to air pollution. The market is segmented by mask type (N95, KN95, surgical masks, etc.), distribution channel (online, offline), and region (North America, Europe, Asia-Pacific, etc.). Leading companies such as Honeywell, 3M, and Kimberly-Clark hold significant market share due to their established brand reputation and extensive distribution networks. However, the market also features numerous smaller players specializing in innovative designs or niche applications, creating a dynamic competitive landscape.
Haze Mask Market Size (In Billion)
Growth within the haze mask market is further propelled by evolving consumer preferences towards reusable, comfortable, and stylish masks. Technological advancements are also playing a critical role, with the introduction of masks incorporating advanced filtration technologies and smart features for improved respiratory protection and user experience. However, fluctuating raw material costs and potential supply chain disruptions pose challenges to sustained growth. Additionally, regulatory changes and evolving consumer perceptions regarding the efficacy of different mask types can also impact market dynamics. Regional differences in air quality regulations and consumer awareness will continue to influence market penetration rates across different geographical areas. The Asia-Pacific region is anticipated to show substantial growth due to high levels of air pollution and increasing environmental consciousness.
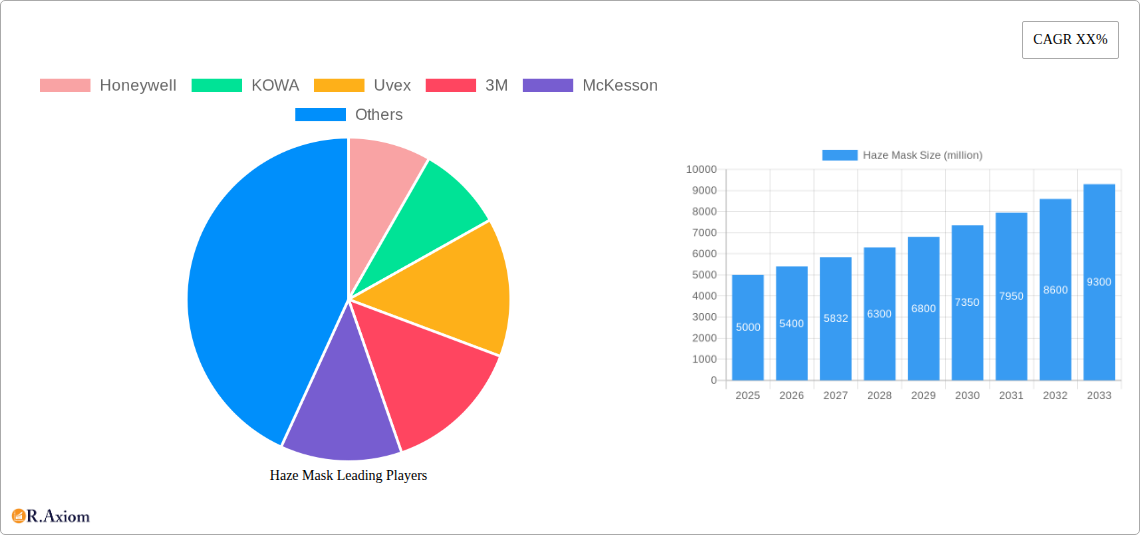
Haze Mask Company Market Share
Haze Mask Market Report: 2019-2033 – A Comprehensive Analysis
This comprehensive report provides an in-depth analysis of the global Haze Mask market, offering valuable insights for industry stakeholders, investors, and strategic decision-makers. Covering the period from 2019 to 2033, with a base year of 2025 and a forecast period of 2025-2033, this report meticulously examines market size, growth drivers, competitive landscape, and emerging trends. The report utilizes data from the historical period (2019-2024) to project future market dynamics. The total market value is estimated at $XX million in 2025 and is projected to reach $XX million by 2033.
Haze Mask Market Concentration & Innovation
The global haze mask market exhibits a moderately concentrated structure, with several key players holding significant market share. In 2025, the top five companies—3M, Honeywell, Kimberly-Clark, KOWA, and Uvex—are estimated to collectively account for approximately 55% of the market. However, the presence of numerous smaller, regional players and innovative startups contributes to a dynamic competitive landscape. Innovation is driven by factors such as increasing consumer awareness of air pollution, advancements in filtration technology (e.g., N95, HEPA filters), and the development of more comfortable and aesthetically pleasing designs. Stringent regulatory frameworks concerning air quality and personal protective equipment (PPE) in various regions further influence the market. Product substitutes, such as air purifiers and improved ventilation systems, pose a level of competitive pressure. End-user trends indicate a growing preference for reusable, sustainable masks and technologically advanced features such as smart sensors and voice activation. M&A activity in the sector has been moderate, with a few significant deals totaling approximately $XX million in the last five years, primarily focused on expanding product portfolios and geographic reach.
- Market Share (2025 Estimate): 3M (20%), Honeywell (15%), Kimberly-Clark (10%), KOWA (7%), Uvex (3%)
- M&A Deal Value (2020-2024): $XX million
Haze Mask Industry Trends & Insights
The global haze mask market is experiencing robust growth, driven by rising air pollution levels in urban areas across the globe and increased public health consciousness. The compound annual growth rate (CAGR) for the period 2025-2033 is projected to be XX%. This growth is fueled by several key factors: increasing urbanization and industrialization leading to higher air pollution, growing awareness of respiratory illnesses linked to poor air quality, a surge in demand for effective personal protective equipment, and the introduction of technologically advanced masks with improved filtration and comfort features. Technological advancements like nanotechnology-based filtration and the integration of smart sensors to monitor air quality are disrupting the traditional haze mask market. Consumer preferences are shifting towards masks offering superior comfort, durability, style, and ease of use. Competitive dynamics are characterized by intense rivalry amongst established players and the emergence of new entrants, resulting in continuous product innovation and price competition. Market penetration, particularly in developing economies with high air pollution levels, remains significant growth opportunity.
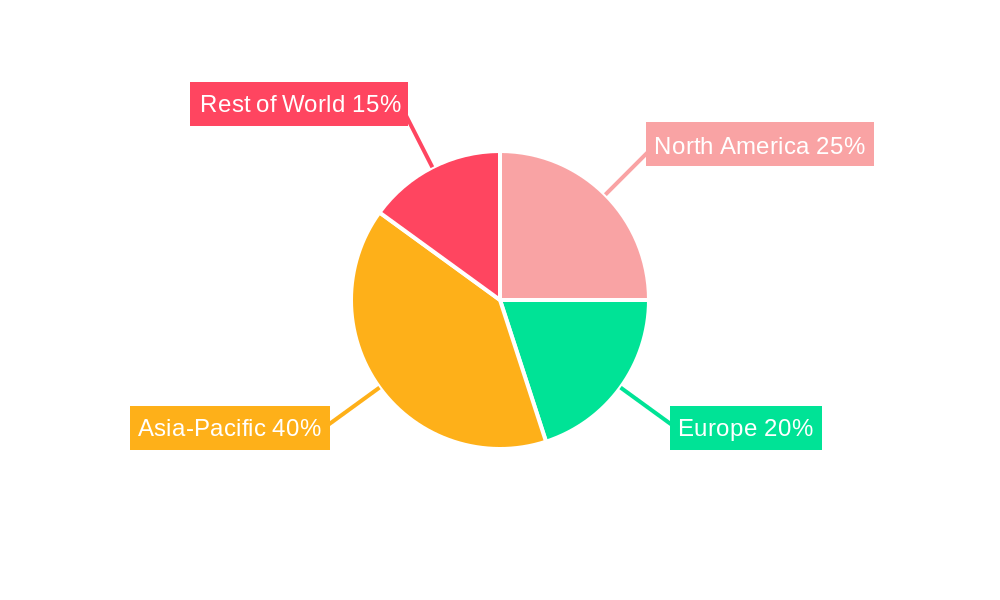
Dominant Markets & Segments in Haze Mask
The Asia-Pacific region is expected to dominate the haze mask market throughout the forecast period. Countries like China, India, and South Korea are experiencing rapid growth due to a confluence of factors.
- Key Drivers in Asia-Pacific:
- High levels of air pollution in major urban centers.
- Rising disposable incomes and increased awareness of health risks.
- Government initiatives promoting public health and environmental protection.
- Significant investments in infrastructure and public transportation.
The dominance of the Asia-Pacific region is attributed to its high population density, rapid urbanization, and substantial industrial activity, all contributing to elevated air pollution levels. The region’s burgeoning middle class, increasing health consciousness, and government regulations further bolster market expansion. The market is further segmented by mask type (disposable, reusable), filter technology (N95, HEPA), and end-user (consumers, healthcare professionals, industrial workers). The reusable segment is witnessing strong growth fueled by environmental concerns and cost-effectiveness.
Haze Mask Product Developments
Recent product innovations in the haze mask market are focused on enhancing filtration efficiency, comfort, and style. Advanced filtration technologies such as nanofiber filters and electrostatic charging are being incorporated to improve particle capture. Ergonomic designs and breathable materials are being implemented to improve comfort during prolonged use. Moreover, smart features like air quality sensors and Bluetooth connectivity are being integrated into some models to provide real-time air quality information and enhance user experience. These advancements cater to growing consumer demand for technologically advanced and user-friendly products, thereby improving market fit and competitiveness.
Report Scope & Segmentation Analysis
This report segments the haze mask market based on several parameters: by product type (disposable, reusable), by filter technology (N95, HEPA, others), by end-user (individuals, healthcare workers, industrial workers), and by region (North America, Europe, Asia-Pacific, Latin America, Middle East & Africa). Each segment's growth projections, market size, and competitive landscape are analyzed. The reusable segment is expected to experience a higher CAGR than the disposable segment driven by rising environmental consciousness. The N95 and HEPA filter technology segments are projected to dominate due to their high filtration efficiency.
Key Drivers of Haze Mask Growth
Several factors are contributing to the growth of the haze mask market. Firstly, the escalating levels of air pollution in urban areas globally are driving demand for effective respiratory protection. Secondly, increasing awareness about the adverse health impacts of air pollution is fueling consumer adoption of haze masks. Thirdly, technological advancements in filter technology, materials science, and design are leading to the development of more comfortable, efficient, and stylish masks. Government regulations and initiatives to combat air pollution also play a vital role by raising public awareness and promoting the use of protective equipment.
Challenges in the Haze Mask Sector
The haze mask market faces several challenges. One key challenge is the counterfeit market, which undermines the quality and efficacy of haze masks, impacting consumer trust. Supply chain disruptions, particularly concerning raw materials and manufacturing processes, can also affect market stability. Furthermore, intense competition among numerous players can put downward pressure on prices and profit margins. Regulatory hurdles concerning standards and certifications for haze masks vary across different countries, potentially hindering market expansion in certain regions. The estimated economic impact of these challenges on the market is currently xx million annually.
Emerging Opportunities in Haze Mask
Several promising opportunities exist within the haze mask market. The integration of smart features, such as air quality sensors and connectivity features, offers potential for enhanced user experience and data-driven insights. The expanding demand for masks with superior comfort and aesthetics presents opportunities for innovation in materials and designs. Untapped markets in developing countries with high air pollution levels represent significant growth potential. Furthermore, exploration of sustainable and biodegradable materials for mask production aligns with growing environmental concerns, providing a promising avenue for future development.
Leading Players in the Haze Mask Market
- Honeywell
- KOWA
- Uvex
- 3M
- McKesson
- Hakugen
- Shanghai Dasheng
- Totobobo
- Kimberly-Clark
- Vogmask
- Sinotextiles
- Respro
- DACH
- Te Yin
- BDS
- Irema
Key Developments in Haze Mask Industry
- 2022 Q4: 3M launched a new line of N95 masks with improved filtration efficiency.
- 2023 Q1: Honeywell acquired a smaller mask manufacturer, expanding its product portfolio.
- 2023 Q3: New regulations on mask standards were implemented in several Asian countries.
- 2024 Q2: Kimberly-Clark introduced a range of sustainable, reusable masks.
Strategic Outlook for Haze Mask Market
The future of the haze mask market appears promising, driven by persistent air pollution concerns and ongoing technological advancements. The market is poised for continued growth, fueled by expanding adoption in emerging economies and the development of innovative products with improved functionality and user experience. Opportunities exist for companies to leverage technological advancements to enhance filtration efficiency, comfort, and sustainability. Strategic partnerships and collaborations among players can help drive innovation and market expansion. The focus on sustainability and eco-friendly materials will be key to long-term growth.
Haze Mask Segmentation
-
1. Application
- 1.1. Individual
- 1.2. Industrial
- 1.3. Hospital & Clinic
- 1.4. Others
-
2. Types
- 2.1. Disposable Masks
- 2.2. Reusable Masks
Haze Mask Segmentation By Geography
-
1. North America
- 1.1. United States
- 1.2. Canada
- 1.3. Mexico
-
2. South America
- 2.1. Brazil
- 2.2. Argentina
- 2.3. Rest of South America
-
3. Europe
- 3.1. United Kingdom
- 3.2. Germany
- 3.3. France
- 3.4. Italy
- 3.5. Spain
- 3.6. Russia
- 3.7. Benelux
- 3.8. Nordics
- 3.9. Rest of Europe
-
4. Middle East & Africa
- 4.1. Turkey
- 4.2. Israel
- 4.3. GCC
- 4.4. North Africa
- 4.5. South Africa
- 4.6. Rest of Middle East & Africa
-
5. Asia Pacific
- 5.1. China
- 5.2. India
- 5.3. Japan
- 5.4. South Korea
- 5.5. ASEAN
- 5.6. Oceania
- 5.7. Rest of Asia Pacific
Haze Mask Regional Market Share
Geographic Coverage of Haze Mask
Haze Mask REPORT HIGHLIGHTS
| Aspects | Details |
|---|---|
| Study Period | 2020-2034 |
| Base Year | 2025 |
| Estimated Year | 2026 |
| Forecast Period | 2026-2034 |
| Historical Period | 2020-2025 |
| Growth Rate | CAGR of XX% from 2020-2034 |
| Segmentation |
|
Table of Contents
- 1. Introduction
- 1.1. Research Scope
- 1.2. Market Segmentation
- 1.3. Research Objective
- 1.4. Definitions and Assumptions
- 2. Executive Summary
- 2.1. Market Snapshot
- 3. Market Dynamics
- 3.1. Market Drivers
- 3.2. Market Restrains
- 3.3. Market Trends
- 3.4. Market Opportunities
- 4. Market Factor Analysis
- 4.1. Porters Five Forces
- 4.1.1. Bargaining Power of Suppliers
- 4.1.2. Bargaining Power of Buyers
- 4.1.3. Threat of New Entrants
- 4.1.4. Threat of Substitutes
- 4.1.5. Competitive Rivalry
- 4.2. PESTEL analysis
- 4.3. BCG Analysis
- 4.3.1. Stars (High Growth, High Market Share)
- 4.3.2. Cash Cows (Low Growth, High Market Share)
- 4.3.3. Question Mark (High Growth, Low Market Share)
- 4.3.4. Dogs (Low Growth, Low Market Share)
- 4.4. Ansoff Matrix Analysis
- 4.5. Supply Chain Analysis
- 4.6. Regulatory Landscape
- 4.7. Current Market Potential and Opportunity Assessment (TAM–SAM–SOM Framework)
- 4.8. RAX Analyst Note
- 4.1. Porters Five Forces
- 5. Market Analysis, Insights and Forecast 2021-2033
- 5.1. Market Analysis, Insights and Forecast - by Application
- 5.1.1. Individual
- 5.1.2. Industrial
- 5.1.3. Hospital & Clinic
- 5.1.4. Others
- 5.2. Market Analysis, Insights and Forecast - by Types
- 5.2.1. Disposable Masks
- 5.2.2. Reusable Masks
- 5.3. Market Analysis, Insights and Forecast - by Region
- 5.3.1. North America
- 5.3.2. South America
- 5.3.3. Europe
- 5.3.4. Middle East & Africa
- 5.3.5. Asia Pacific
- 5.1. Market Analysis, Insights and Forecast - by Application
- 6. Global Haze Mask Analysis, Insights and Forecast, 2021-2033
- 6.1. Market Analysis, Insights and Forecast - by Application
- 6.1.1. Individual
- 6.1.2. Industrial
- 6.1.3. Hospital & Clinic
- 6.1.4. Others
- 6.2. Market Analysis, Insights and Forecast - by Types
- 6.2.1. Disposable Masks
- 6.2.2. Reusable Masks
- 6.1. Market Analysis, Insights and Forecast - by Application
- 7. North America Haze Mask Analysis, Insights and Forecast, 2020-2032
- 7.1. Market Analysis, Insights and Forecast - by Application
- 7.1.1. Individual
- 7.1.2. Industrial
- 7.1.3. Hospital & Clinic
- 7.1.4. Others
- 7.2. Market Analysis, Insights and Forecast - by Types
- 7.2.1. Disposable Masks
- 7.2.2. Reusable Masks
- 7.1. Market Analysis, Insights and Forecast - by Application
- 8. South America Haze Mask Analysis, Insights and Forecast, 2020-2032
- 8.1. Market Analysis, Insights and Forecast - by Application
- 8.1.1. Individual
- 8.1.2. Industrial
- 8.1.3. Hospital & Clinic
- 8.1.4. Others
- 8.2. Market Analysis, Insights and Forecast - by Types
- 8.2.1. Disposable Masks
- 8.2.2. Reusable Masks
- 8.1. Market Analysis, Insights and Forecast - by Application
- 9. Europe Haze Mask Analysis, Insights and Forecast, 2020-2032
- 9.1. Market Analysis, Insights and Forecast - by Application
- 9.1.1. Individual
- 9.1.2. Industrial
- 9.1.3. Hospital & Clinic
- 9.1.4. Others
- 9.2. Market Analysis, Insights and Forecast - by Types
- 9.2.1. Disposable Masks
- 9.2.2. Reusable Masks
- 9.1. Market Analysis, Insights and Forecast - by Application
- 10. Middle East & Africa Haze Mask Analysis, Insights and Forecast, 2020-2032
- 10.1. Market Analysis, Insights and Forecast - by Application
- 10.1.1. Individual
- 10.1.2. Industrial
- 10.1.3. Hospital & Clinic
- 10.1.4. Others
- 10.2. Market Analysis, Insights and Forecast - by Types
- 10.2.1. Disposable Masks
- 10.2.2. Reusable Masks
- 10.1. Market Analysis, Insights and Forecast - by Application
- 11. Asia Pacific Haze Mask Analysis, Insights and Forecast, 2020-2032
- 11.1. Market Analysis, Insights and Forecast - by Application
- 11.1.1. Individual
- 11.1.2. Industrial
- 11.1.3. Hospital & Clinic
- 11.1.4. Others
- 11.2. Market Analysis, Insights and Forecast - by Types
- 11.2.1. Disposable Masks
- 11.2.2. Reusable Masks
- 11.1. Market Analysis, Insights and Forecast - by Application
- 12. Competitive Analysis
- 12.1. Company Profiles
- 12.1.1 Honeywell
- 12.1.1.1. Company Overview
- 12.1.1.2. Products
- 12.1.1.3. Company Financials
- 12.1.1.4. SWOT Analysis
- 12.1.2 KOWA
- 12.1.2.1. Company Overview
- 12.1.2.2. Products
- 12.1.2.3. Company Financials
- 12.1.2.4. SWOT Analysis
- 12.1.3 Uvex
- 12.1.3.1. Company Overview
- 12.1.3.2. Products
- 12.1.3.3. Company Financials
- 12.1.3.4. SWOT Analysis
- 12.1.4 3M
- 12.1.4.1. Company Overview
- 12.1.4.2. Products
- 12.1.4.3. Company Financials
- 12.1.4.4. SWOT Analysis
- 12.1.5 McKesson
- 12.1.5.1. Company Overview
- 12.1.5.2. Products
- 12.1.5.3. Company Financials
- 12.1.5.4. SWOT Analysis
- 12.1.6 Hakugen
- 12.1.6.1. Company Overview
- 12.1.6.2. Products
- 12.1.6.3. Company Financials
- 12.1.6.4. SWOT Analysis
- 12.1.7 Shanghai Dasheng
- 12.1.7.1. Company Overview
- 12.1.7.2. Products
- 12.1.7.3. Company Financials
- 12.1.7.4. SWOT Analysis
- 12.1.8 Totobobo
- 12.1.8.1. Company Overview
- 12.1.8.2. Products
- 12.1.8.3. Company Financials
- 12.1.8.4. SWOT Analysis
- 12.1.9 Kimberly-clark
- 12.1.9.1. Company Overview
- 12.1.9.2. Products
- 12.1.9.3. Company Financials
- 12.1.9.4. SWOT Analysis
- 12.1.10 Vogmask
- 12.1.10.1. Company Overview
- 12.1.10.2. Products
- 12.1.10.3. Company Financials
- 12.1.10.4. SWOT Analysis
- 12.1.11 Sinotextiles
- 12.1.11.1. Company Overview
- 12.1.11.2. Products
- 12.1.11.3. Company Financials
- 12.1.11.4. SWOT Analysis
- 12.1.12 Respro
- 12.1.12.1. Company Overview
- 12.1.12.2. Products
- 12.1.12.3. Company Financials
- 12.1.12.4. SWOT Analysis
- 12.1.13 DACH
- 12.1.13.1. Company Overview
- 12.1.13.2. Products
- 12.1.13.3. Company Financials
- 12.1.13.4. SWOT Analysis
- 12.1.14 Te Yin
- 12.1.14.1. Company Overview
- 12.1.14.2. Products
- 12.1.14.3. Company Financials
- 12.1.14.4. SWOT Analysis
- 12.1.15 BDS
- 12.1.15.1. Company Overview
- 12.1.15.2. Products
- 12.1.15.3. Company Financials
- 12.1.15.4. SWOT Analysis
- 12.1.16 Irema
- 12.1.16.1. Company Overview
- 12.1.16.2. Products
- 12.1.16.3. Company Financials
- 12.1.16.4. SWOT Analysis
- 12.1.1 Honeywell
- 12.2. Market Entropy
- 12.2.1 Company's Key Areas Served
- 12.2.2 Recent Developments
- 12.3. Company Market Share Analysis 2025
- 12.3.1 Top 5 Companies Market Share Analysis
- 12.3.2 Top 3 Companies Market Share Analysis
- 12.4. List of Potential Customers
- 13. Research Methodology
List of Figures
- Figure 1: Global Haze Mask Revenue Breakdown (million, %) by Region 2025 & 2033
- Figure 2: Global Haze Mask Volume Breakdown (K, %) by Region 2025 & 2033
- Figure 3: North America Haze Mask Revenue (million), by Application 2025 & 2033
- Figure 4: North America Haze Mask Volume (K), by Application 2025 & 2033
- Figure 5: North America Haze Mask Revenue Share (%), by Application 2025 & 2033
- Figure 6: North America Haze Mask Volume Share (%), by Application 2025 & 2033
- Figure 7: North America Haze Mask Revenue (million), by Types 2025 & 2033
- Figure 8: North America Haze Mask Volume (K), by Types 2025 & 2033
- Figure 9: North America Haze Mask Revenue Share (%), by Types 2025 & 2033
- Figure 10: North America Haze Mask Volume Share (%), by Types 2025 & 2033
- Figure 11: North America Haze Mask Revenue (million), by Country 2025 & 2033
- Figure 12: North America Haze Mask Volume (K), by Country 2025 & 2033
- Figure 13: North America Haze Mask Revenue Share (%), by Country 2025 & 2033
- Figure 14: North America Haze Mask Volume Share (%), by Country 2025 & 2033
- Figure 15: South America Haze Mask Revenue (million), by Application 2025 & 2033
- Figure 16: South America Haze Mask Volume (K), by Application 2025 & 2033
- Figure 17: South America Haze Mask Revenue Share (%), by Application 2025 & 2033
- Figure 18: South America Haze Mask Volume Share (%), by Application 2025 & 2033
- Figure 19: South America Haze Mask Revenue (million), by Types 2025 & 2033
- Figure 20: South America Haze Mask Volume (K), by Types 2025 & 2033
- Figure 21: South America Haze Mask Revenue Share (%), by Types 2025 & 2033
- Figure 22: South America Haze Mask Volume Share (%), by Types 2025 & 2033
- Figure 23: South America Haze Mask Revenue (million), by Country 2025 & 2033
- Figure 24: South America Haze Mask Volume (K), by Country 2025 & 2033
- Figure 25: South America Haze Mask Revenue Share (%), by Country 2025 & 2033
- Figure 26: South America Haze Mask Volume Share (%), by Country 2025 & 2033
- Figure 27: Europe Haze Mask Revenue (million), by Application 2025 & 2033
- Figure 28: Europe Haze Mask Volume (K), by Application 2025 & 2033
- Figure 29: Europe Haze Mask Revenue Share (%), by Application 2025 & 2033
- Figure 30: Europe Haze Mask Volume Share (%), by Application 2025 & 2033
- Figure 31: Europe Haze Mask Revenue (million), by Types 2025 & 2033
- Figure 32: Europe Haze Mask Volume (K), by Types 2025 & 2033
- Figure 33: Europe Haze Mask Revenue Share (%), by Types 2025 & 2033
- Figure 34: Europe Haze Mask Volume Share (%), by Types 2025 & 2033
- Figure 35: Europe Haze Mask Revenue (million), by Country 2025 & 2033
- Figure 36: Europe Haze Mask Volume (K), by Country 2025 & 2033
- Figure 37: Europe Haze Mask Revenue Share (%), by Country 2025 & 2033
- Figure 38: Europe Haze Mask Volume Share (%), by Country 2025 & 2033
- Figure 39: Middle East & Africa Haze Mask Revenue (million), by Application 2025 & 2033
- Figure 40: Middle East & Africa Haze Mask Volume (K), by Application 2025 & 2033
- Figure 41: Middle East & Africa Haze Mask Revenue Share (%), by Application 2025 & 2033
- Figure 42: Middle East & Africa Haze Mask Volume Share (%), by Application 2025 & 2033
- Figure 43: Middle East & Africa Haze Mask Revenue (million), by Types 2025 & 2033
- Figure 44: Middle East & Africa Haze Mask Volume (K), by Types 2025 & 2033
- Figure 45: Middle East & Africa Haze Mask Revenue Share (%), by Types 2025 & 2033
- Figure 46: Middle East & Africa Haze Mask Volume Share (%), by Types 2025 & 2033
- Figure 47: Middle East & Africa Haze Mask Revenue (million), by Country 2025 & 2033
- Figure 48: Middle East & Africa Haze Mask Volume (K), by Country 2025 & 2033
- Figure 49: Middle East & Africa Haze Mask Revenue Share (%), by Country 2025 & 2033
- Figure 50: Middle East & Africa Haze Mask Volume Share (%), by Country 2025 & 2033
- Figure 51: Asia Pacific Haze Mask Revenue (million), by Application 2025 & 2033
- Figure 52: Asia Pacific Haze Mask Volume (K), by Application 2025 & 2033
- Figure 53: Asia Pacific Haze Mask Revenue Share (%), by Application 2025 & 2033
- Figure 54: Asia Pacific Haze Mask Volume Share (%), by Application 2025 & 2033
- Figure 55: Asia Pacific Haze Mask Revenue (million), by Types 2025 & 2033
- Figure 56: Asia Pacific Haze Mask Volume (K), by Types 2025 & 2033
- Figure 57: Asia Pacific Haze Mask Revenue Share (%), by Types 2025 & 2033
- Figure 58: Asia Pacific Haze Mask Volume Share (%), by Types 2025 & 2033
- Figure 59: Asia Pacific Haze Mask Revenue (million), by Country 2025 & 2033
- Figure 60: Asia Pacific Haze Mask Volume (K), by Country 2025 & 2033
- Figure 61: Asia Pacific Haze Mask Revenue Share (%), by Country 2025 & 2033
- Figure 62: Asia Pacific Haze Mask Volume Share (%), by Country 2025 & 2033
List of Tables
- Table 1: Global Haze Mask Revenue million Forecast, by Application 2020 & 2033
- Table 2: Global Haze Mask Volume K Forecast, by Application 2020 & 2033
- Table 3: Global Haze Mask Revenue million Forecast, by Types 2020 & 2033
- Table 4: Global Haze Mask Volume K Forecast, by Types 2020 & 2033
- Table 5: Global Haze Mask Revenue million Forecast, by Region 2020 & 2033
- Table 6: Global Haze Mask Volume K Forecast, by Region 2020 & 2033
- Table 7: Global Haze Mask Revenue million Forecast, by Application 2020 & 2033
- Table 8: Global Haze Mask Volume K Forecast, by Application 2020 & 2033
- Table 9: Global Haze Mask Revenue million Forecast, by Types 2020 & 2033
- Table 10: Global Haze Mask Volume K Forecast, by Types 2020 & 2033
- Table 11: Global Haze Mask Revenue million Forecast, by Country 2020 & 2033
- Table 12: Global Haze Mask Volume K Forecast, by Country 2020 & 2033
- Table 13: United States Haze Mask Revenue (million) Forecast, by Application 2020 & 2033
- Table 14: United States Haze Mask Volume (K) Forecast, by Application 2020 & 2033
- Table 15: Canada Haze Mask Revenue (million) Forecast, by Application 2020 & 2033
- Table 16: Canada Haze Mask Volume (K) Forecast, by Application 2020 & 2033
- Table 17: Mexico Haze Mask Revenue (million) Forecast, by Application 2020 & 2033
- Table 18: Mexico Haze Mask Volume (K) Forecast, by Application 2020 & 2033
- Table 19: Global Haze Mask Revenue million Forecast, by Application 2020 & 2033
- Table 20: Global Haze Mask Volume K Forecast, by Application 2020 & 2033
- Table 21: Global Haze Mask Revenue million Forecast, by Types 2020 & 2033
- Table 22: Global Haze Mask Volume K Forecast, by Types 2020 & 2033
- Table 23: Global Haze Mask Revenue million Forecast, by Country 2020 & 2033
- Table 24: Global Haze Mask Volume K Forecast, by Country 2020 & 2033
- Table 25: Brazil Haze Mask Revenue (million) Forecast, by Application 2020 & 2033
- Table 26: Brazil Haze Mask Volume (K) Forecast, by Application 2020 & 2033
- Table 27: Argentina Haze Mask Revenue (million) Forecast, by Application 2020 & 2033
- Table 28: Argentina Haze Mask Volume (K) Forecast, by Application 2020 & 2033
- Table 29: Rest of South America Haze Mask Revenue (million) Forecast, by Application 2020 & 2033
- Table 30: Rest of South America Haze Mask Volume (K) Forecast, by Application 2020 & 2033
- Table 31: Global Haze Mask Revenue million Forecast, by Application 2020 & 2033
- Table 32: Global Haze Mask Volume K Forecast, by Application 2020 & 2033
- Table 33: Global Haze Mask Revenue million Forecast, by Types 2020 & 2033
- Table 34: Global Haze Mask Volume K Forecast, by Types 2020 & 2033
- Table 35: Global Haze Mask Revenue million Forecast, by Country 2020 & 2033
- Table 36: Global Haze Mask Volume K Forecast, by Country 2020 & 2033
- Table 37: United Kingdom Haze Mask Revenue (million) Forecast, by Application 2020 & 2033
- Table 38: United Kingdom Haze Mask Volume (K) Forecast, by Application 2020 & 2033
- Table 39: Germany Haze Mask Revenue (million) Forecast, by Application 2020 & 2033
- Table 40: Germany Haze Mask Volume (K) Forecast, by Application 2020 & 2033
- Table 41: France Haze Mask Revenue (million) Forecast, by Application 2020 & 2033
- Table 42: France Haze Mask Volume (K) Forecast, by Application 2020 & 2033
- Table 43: Italy Haze Mask Revenue (million) Forecast, by Application 2020 & 2033
- Table 44: Italy Haze Mask Volume (K) Forecast, by Application 2020 & 2033
- Table 45: Spain Haze Mask Revenue (million) Forecast, by Application 2020 & 2033
- Table 46: Spain Haze Mask Volume (K) Forecast, by Application 2020 & 2033
- Table 47: Russia Haze Mask Revenue (million) Forecast, by Application 2020 & 2033
- Table 48: Russia Haze Mask Volume (K) Forecast, by Application 2020 & 2033
- Table 49: Benelux Haze Mask Revenue (million) Forecast, by Application 2020 & 2033
- Table 50: Benelux Haze Mask Volume (K) Forecast, by Application 2020 & 2033
- Table 51: Nordics Haze Mask Revenue (million) Forecast, by Application 2020 & 2033
- Table 52: Nordics Haze Mask Volume (K) Forecast, by Application 2020 & 2033
- Table 53: Rest of Europe Haze Mask Revenue (million) Forecast, by Application 2020 & 2033
- Table 54: Rest of Europe Haze Mask Volume (K) Forecast, by Application 2020 & 2033
- Table 55: Global Haze Mask Revenue million Forecast, by Application 2020 & 2033
- Table 56: Global Haze Mask Volume K Forecast, by Application 2020 & 2033
- Table 57: Global Haze Mask Revenue million Forecast, by Types 2020 & 2033
- Table 58: Global Haze Mask Volume K Forecast, by Types 2020 & 2033
- Table 59: Global Haze Mask Revenue million Forecast, by Country 2020 & 2033
- Table 60: Global Haze Mask Volume K Forecast, by Country 2020 & 2033
- Table 61: Turkey Haze Mask Revenue (million) Forecast, by Application 2020 & 2033
- Table 62: Turkey Haze Mask Volume (K) Forecast, by Application 2020 & 2033
- Table 63: Israel Haze Mask Revenue (million) Forecast, by Application 2020 & 2033
- Table 64: Israel Haze Mask Volume (K) Forecast, by Application 2020 & 2033
- Table 65: GCC Haze Mask Revenue (million) Forecast, by Application 2020 & 2033
- Table 66: GCC Haze Mask Volume (K) Forecast, by Application 2020 & 2033
- Table 67: North Africa Haze Mask Revenue (million) Forecast, by Application 2020 & 2033
- Table 68: North Africa Haze Mask Volume (K) Forecast, by Application 2020 & 2033
- Table 69: South Africa Haze Mask Revenue (million) Forecast, by Application 2020 & 2033
- Table 70: South Africa Haze Mask Volume (K) Forecast, by Application 2020 & 2033
- Table 71: Rest of Middle East & Africa Haze Mask Revenue (million) Forecast, by Application 2020 & 2033
- Table 72: Rest of Middle East & Africa Haze Mask Volume (K) Forecast, by Application 2020 & 2033
- Table 73: Global Haze Mask Revenue million Forecast, by Application 2020 & 2033
- Table 74: Global Haze Mask Volume K Forecast, by Application 2020 & 2033
- Table 75: Global Haze Mask Revenue million Forecast, by Types 2020 & 2033
- Table 76: Global Haze Mask Volume K Forecast, by Types 2020 & 2033
- Table 77: Global Haze Mask Revenue million Forecast, by Country 2020 & 2033
- Table 78: Global Haze Mask Volume K Forecast, by Country 2020 & 2033
- Table 79: China Haze Mask Revenue (million) Forecast, by Application 2020 & 2033
- Table 80: China Haze Mask Volume (K) Forecast, by Application 2020 & 2033
- Table 81: India Haze Mask Revenue (million) Forecast, by Application 2020 & 2033
- Table 82: India Haze Mask Volume (K) Forecast, by Application 2020 & 2033
- Table 83: Japan Haze Mask Revenue (million) Forecast, by Application 2020 & 2033
- Table 84: Japan Haze Mask Volume (K) Forecast, by Application 2020 & 2033
- Table 85: South Korea Haze Mask Revenue (million) Forecast, by Application 2020 & 2033
- Table 86: South Korea Haze Mask Volume (K) Forecast, by Application 2020 & 2033
- Table 87: ASEAN Haze Mask Revenue (million) Forecast, by Application 2020 & 2033
- Table 88: ASEAN Haze Mask Volume (K) Forecast, by Application 2020 & 2033
- Table 89: Oceania Haze Mask Revenue (million) Forecast, by Application 2020 & 2033
- Table 90: Oceania Haze Mask Volume (K) Forecast, by Application 2020 & 2033
- Table 91: Rest of Asia Pacific Haze Mask Revenue (million) Forecast, by Application 2020 & 2033
- Table 92: Rest of Asia Pacific Haze Mask Volume (K) Forecast, by Application 2020 & 2033
Frequently Asked Questions
1. What is the projected Compound Annual Growth Rate (CAGR) of the Haze Mask?
The projected CAGR is approximately XX%.
2. Which companies are prominent players in the Haze Mask?
Key companies in the market include Honeywell, KOWA, Uvex, 3M, McKesson, Hakugen, Shanghai Dasheng, Totobobo, Kimberly-clark, Vogmask, Sinotextiles, Respro, DACH, Te Yin, BDS, Irema.
3. What are the main segments of the Haze Mask?
The market segments include Application, Types.
4. Can you provide details about the market size?
The market size is estimated to be USD XXX million as of 2022.
5. What are some drivers contributing to market growth?
N/A
6. What are the notable trends driving market growth?
N/A
7. Are there any restraints impacting market growth?
N/A
8. Can you provide examples of recent developments in the market?
N/A
9. What pricing options are available for accessing the report?
Pricing options include single-user, multi-user, and enterprise licenses priced at USD 3350.00, USD 5025.00, and USD 6700.00 respectively.
10. Is the market size provided in terms of value or volume?
The market size is provided in terms of value, measured in million and volume, measured in K.
11. Are there any specific market keywords associated with the report?
Yes, the market keyword associated with the report is "Haze Mask," which aids in identifying and referencing the specific market segment covered.
12. How do I determine which pricing option suits my needs best?
The pricing options vary based on user requirements and access needs. Individual users may opt for single-user licenses, while businesses requiring broader access may choose multi-user or enterprise licenses for cost-effective access to the report.
13. Are there any additional resources or data provided in the Haze Mask report?
While the report offers comprehensive insights, it's advisable to review the specific contents or supplementary materials provided to ascertain if additional resources or data are available.
14. How can I stay updated on further developments or reports in the Haze Mask?
To stay informed about further developments, trends, and reports in the Haze Mask, consider subscribing to industry newsletters, following relevant companies and organizations, or regularly checking reputable industry news sources and publications.
Methodology
Step 1 - Identification of Relevant Samples Size from Population Database


Step 2 - Approaches for Defining Global Market Size (Value, Volume* & Price*)

Note*: In applicable scenarios
Step 3 - Data Sources
Primary Research
- Web Analytics
- Survey Reports
- Research Institute
- Latest Research Reports
- Opinion Leaders
Secondary Research
- Annual Reports
- White Paper
- Latest Press Release
- Industry Association
- Paid Database
- Investor Presentations

Step 4 - Data Triangulation
Involves using different sources of information in order to increase the validity of a study
These sources are likely to be stakeholders in a program - participants, other researchers, program staff, other community members, and so on.
Then we put all data in single framework & apply various statistical tools to find out the dynamic on the market.
During the analysis stage, feedback from the stakeholder groups would be compared to determine areas of agreement as well as areas of divergence