


Key Insights
The HD VR Head Mounted Display (HMD) market is experiencing significant expansion, propelled by rapid advancements in display technology, enhanced processing power, and sophisticated content creation. Increased market maturity and declining costs are democratizing VR access for both consumers and enterprises. Key growth drivers include the rising adoption of VR in gaming, entertainment, and advanced training simulations, offering unparalleled immersive experiences. Furthermore, the integration of HD VR HMDs across diverse sectors such as healthcare, education, and engineering is substantially broadening market potential. Intense competition among industry leaders like Apple, Meta, and Sony, alongside emerging innovators, is stimulating continuous improvements in HMD comfort, resolution, and functionality. Despite persistent challenges related to bandwidth and processing demands for fully immersive virtual realities, the market trajectory indicates sustained and substantial growth.
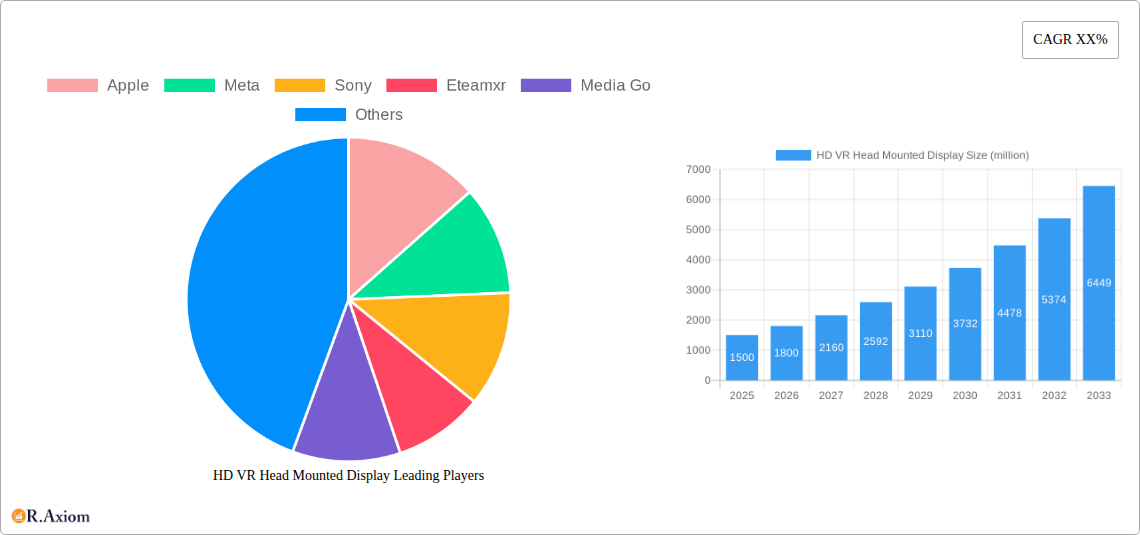
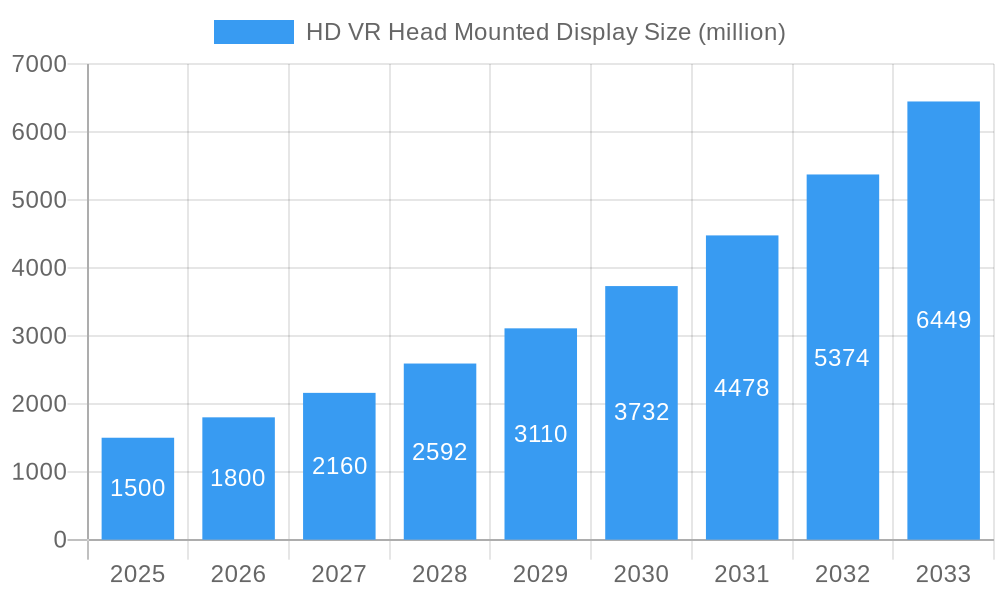
HD VR Head Mounted Display Market Size (In Billion)

Projections to 2033 forecast continued growth for the HD VR HMD market, driven by ongoing technological innovation and expanding application verticals. The market is anticipated to achieve a Compound Annual Growth Rate (CAGR) of 18.03%, leading to substantial market expansion. This growth will be further augmented by decreasing production costs, enhancing affordability, and the development of increasingly engaging VR content for a wider range of users. However, addressing potential health concerns associated with extended VR usage and establishing robust infrastructure for widespread adoption are critical for ensuring sustainable long-term market success.
HD VR Head Mounted Display Company Market Share
This comprehensive report offers an in-depth analysis of the HD VR Head Mounted Display market, delivering actionable insights for industry stakeholders. Covering the period from 2019 to 2033, with a base year of 2025, this report meticulously examines market dynamics, technological advancements, and competitive landscapes. The market size for 2025 is estimated at 6603.63 million. Our analysis includes market trends, key players such as Apple, Meta, Sony, Eteamxr, Media Go, VTM Digital, Cordex Intelligence, Hidden Brains, Virnect, and Samsung, and future growth projections encompassing unit volume and market value.
HD VR Head Mounted Display Market Concentration & Innovation
The HD VR Head Mounted Display market exhibits a moderately concentrated structure, with a few dominant players holding significant market share. In 2025, Meta and Sony are estimated to collectively hold xx% of the market, while Apple and Samsung are projected to hold xx% and xx% respectively. Smaller players like Eteamxr, Media Go, VTM Digital, Cordex Intelligence, Hidden Brains, and Virnect are actively competing for market share, often focusing on niche applications or specific technological advancements.
Innovation is a key driver in this sector, fueled by advancements in display technology (higher resolutions, wider fields of view), processing power (more realistic graphics and lower latency), and user interface (improved comfort and ergonomics). Regulatory frameworks, particularly concerning data privacy and safety standards, are also shaping market development. Product substitutes, such as AR headsets and high-end gaming monitors, exert competitive pressure. End-user trends, such as increasing demand for immersive gaming and entertainment experiences, are boosting market growth. The past five years have witnessed significant M&A activity, with a total deal value of approximately $xx million, reflecting the industry's consolidation and pursuit of technological synergies. Key M&A activities have included [insert example of M&A activities with specifics if available].
- Market Share (2025): Meta (xx%), Sony (xx%), Apple (xx%), Samsung (xx%), Others (xx%).
- M&A Deal Value (2019-2024): Approximately $xx million.
- Key Innovation Drivers: Higher resolution displays, improved processing power, enhanced user interface.
HD VR Head Mounted Display Industry Trends & Insights
The HD VR Head Mounted Display market is experiencing significant growth, driven by several factors. The Compound Annual Growth Rate (CAGR) for the forecast period (2025-2033) is estimated at xx%, indicating robust expansion. This growth is fueled by increasing consumer demand for immersive entertainment, advancements in VR technology leading to improved user experience, and expanding applications in various sectors like gaming, education, and healthcare. Technological disruptions, such as the introduction of eye-tracking and haptic feedback technologies, are further enhancing the user experience and driving market expansion. Consumer preferences are shifting towards lightweight, comfortable headsets with high-resolution displays and low latency. The competitive landscape is characterized by intense rivalry among established players and emerging companies, leading to continuous product innovation and price competition. Market penetration of HD VR headsets is projected to reach xx% by 2033, indicating widespread adoption.
Dominant Markets & Segments in HD VR Head Mounted Display
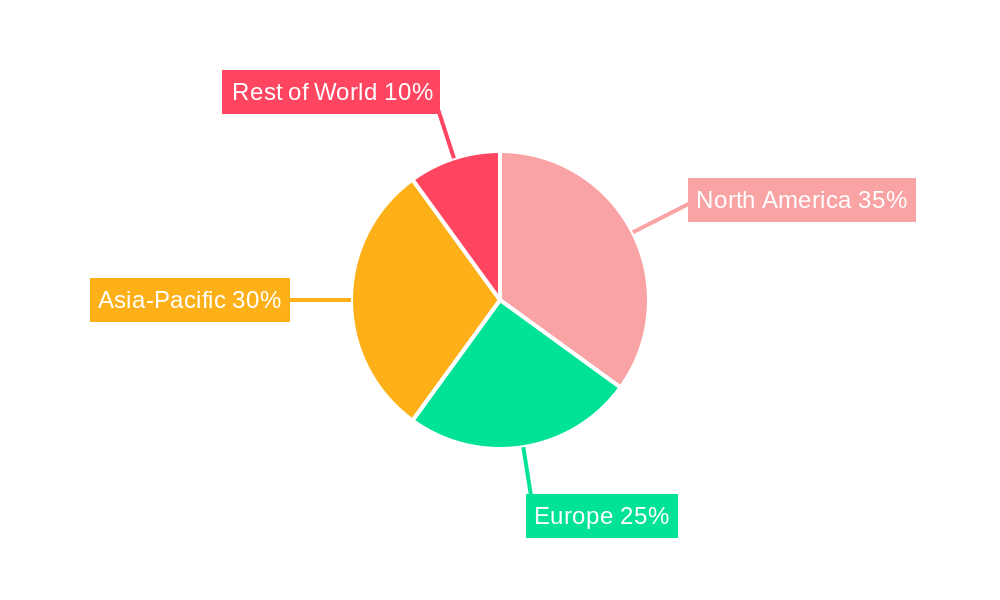
The North American region is projected to dominate the HD VR Head Mounted Display market during the forecast period, holding the largest market share of xx% in 2025. This dominance is primarily attributed to:
- High disposable incomes: Providing consumers with greater purchasing power for premium technological products.
- Strong technological infrastructure: Enabling widespread adoption of advanced technologies and services.
- Early adoption of new technologies: Making North America a key market for innovative products such as VR headsets.
- Established gaming and entertainment industries: Fueling demand for immersive experiences.
While North America holds the largest share, other regions are expected to show strong growth potential. For instance, the Asia-Pacific region is projected to witness substantial growth due to the increasing adoption of VR technology in various sectors and rising consumer spending. The European market is also predicted to experience steady growth, although at a relatively slower rate compared to Asia-Pacific.
The gaming segment is currently the largest application area for HD VR Head Mounted Displays, contributing a significant portion of the overall market revenue. Other key segments include entertainment, education, and healthcare, each demonstrating specific growth dynamics.
HD VR Head Mounted Display Product Developments
Recent product innovations focus on enhancing display quality, comfort, and functionality. This includes higher resolution displays, improved ergonomics, integrated eye and hand tracking, and haptic feedback. These improvements are driving increased market appeal and broader application across various sectors. Companies are focusing on competitive advantages through unique software ecosystems, exclusive content partnerships, and innovative form factors. The market is moving towards more lightweight and compact devices with enhanced processing capabilities.
Report Scope & Segmentation Analysis
This report segments the HD VR Head Mounted Display market based on several key parameters:
By Resolution: High-Definition (HD), Ultra-High Definition (UHD), and others. HD currently holds the largest market share, but UHD is expected to experience significant growth due to technological advancements and increasing consumer demand for higher visual fidelity. Market sizes for each resolution segment are projected to be xx million units for HD, xx million for UHD, and xx million for others in 2025.
By Application: Gaming, Entertainment, Education, Healthcare, and others. Each segment demonstrates unique growth trajectories based on industry trends and adoption rates. The gaming segment currently dominates, but other segments are expected to witness substantial growth.
By Geography: North America, Europe, Asia Pacific, Rest of the World.
Key Drivers of HD VR Head Mounted Display Growth
Several factors fuel the growth of the HD VR Head Mounted Display market. These include:
- Technological advancements: Leading to improved display quality, processing power, and user experience.
- Increasing consumer demand: For immersive entertainment experiences across gaming and other sectors.
- Expanding applications: In various sectors such as education, healthcare, and professional training.
- Falling prices: Making the technology more accessible to a wider range of consumers.
Challenges in the HD VR Head Mounted Display Sector
The HD VR Head Mounted Display sector faces several challenges:
- High cost of production: Leading to higher prices for consumers and limiting market accessibility.
- Technical limitations: Such as motion sickness, limited field of view, and battery life, hindering user experience.
- Competition from alternative technologies: Like AR headsets, which offer a blend of virtual and real-world interactions.
- Supply chain disruptions: Potentially impacting manufacturing and distribution. The estimated impact of supply chain disruptions on market growth is xx% during the forecast period.
Emerging Opportunities in HD VR Head Mounted Display
Emerging trends and opportunities include:
- Expansion into new markets: Such as industrial training, tourism, and virtual tourism, expanding application domains.
- Development of new technologies: Including eye-tracking, haptic feedback, and advanced motion tracking to improve realism and interactivity.
- Integration with other technologies: Such as AI, providing more personalized and engaging experiences.
Key Developments in HD VR Head Mounted Display Industry
- January 2023: Meta announces new features for its VR headset, improving user experience.
- March 2022: Sony launches a new VR headset with improved display technology.
- [Add more developments with specific dates and impacts]
Strategic Outlook for HD VR Head Mounted Display Market
The HD VR Head Mounted Display market is poised for substantial growth, driven by technological advancements, expanding applications, and increasing consumer demand. Future market potential lies in the development of more affordable, lightweight, and comfortable headsets with enhanced features, broader adoption across various sectors, and the integration of cutting-edge technologies such as AI and 5G. This will create new opportunities for market players and drive overall market expansion.
HD VR Head Mounted Display Segmentation
-
1. Application
- 1.1. Game
- 1.2. Movie
- 1.3. Social Media Interaction
- 1.4. Virtual Tour
- 1.5. Others
-
2. Types
- 2.1. Cathode Ray Tube Projection Technology
- 2.2. LCD Projection Technology
- 2.3. Liquid Crystal on Silicon Projection Technology
- 2.4. Reflective LCD Projection Technology
HD VR Head Mounted Display Segmentation By Geography
-
1. North America
- 1.1. United States
- 1.2. Canada
- 1.3. Mexico
-
2. South America
- 2.1. Brazil
- 2.2. Argentina
- 2.3. Rest of South America
-
3. Europe
- 3.1. United Kingdom
- 3.2. Germany
- 3.3. France
- 3.4. Italy
- 3.5. Spain
- 3.6. Russia
- 3.7. Benelux
- 3.8. Nordics
- 3.9. Rest of Europe
-
4. Middle East & Africa
- 4.1. Turkey
- 4.2. Israel
- 4.3. GCC
- 4.4. North Africa
- 4.5. South Africa
- 4.6. Rest of Middle East & Africa
-
5. Asia Pacific
- 5.1. China
- 5.2. India
- 5.3. Japan
- 5.4. South Korea
- 5.5. ASEAN
- 5.6. Oceania
- 5.7. Rest of Asia Pacific
HD VR Head Mounted Display Regional Market Share
Geographic Coverage of HD VR Head Mounted Display
HD VR Head Mounted Display REPORT HIGHLIGHTS
| Aspects | Details |
|---|---|
| Study Period | 2020-2034 |
| Base Year | 2025 |
| Estimated Year | 2026 |
| Forecast Period | 2026-2034 |
| Historical Period | 2020-2025 |
| Growth Rate | CAGR of 18.03% from 2020-2034 |
| Segmentation |
|
Table of Contents
- 1. Introduction
- 1.1. Research Scope
- 1.2. Market Segmentation
- 1.3. Research Methodology
- 1.4. Definitions and Assumptions
- 2. Executive Summary
- 2.1. Introduction
- 3. Market Dynamics
- 3.1. Introduction
- 3.2. Market Drivers
- 3.3. Market Restrains
- 3.4. Market Trends
- 4. Market Factor Analysis
- 4.1. Porters Five Forces
- 4.2. Supply/Value Chain
- 4.3. PESTEL analysis
- 4.4. Market Entropy
- 4.5. Patent/Trademark Analysis
- 5. Global HD VR Head Mounted Display Analysis, Insights and Forecast, 2020-2032
- 5.1. Market Analysis, Insights and Forecast - by Application
- 5.1.1. Game
- 5.1.2. Movie
- 5.1.3. Social Media Interaction
- 5.1.4. Virtual Tour
- 5.1.5. Others
- 5.2. Market Analysis, Insights and Forecast - by Types
- 5.2.1. Cathode Ray Tube Projection Technology
- 5.2.2. LCD Projection Technology
- 5.2.3. Liquid Crystal on Silicon Projection Technology
- 5.2.4. Reflective LCD Projection Technology
- 5.3. Market Analysis, Insights and Forecast - by Region
- 5.3.1. North America
- 5.3.2. South America
- 5.3.3. Europe
- 5.3.4. Middle East & Africa
- 5.3.5. Asia Pacific
- 5.1. Market Analysis, Insights and Forecast - by Application
- 6. North America HD VR Head Mounted Display Analysis, Insights and Forecast, 2020-2032
- 6.1. Market Analysis, Insights and Forecast - by Application
- 6.1.1. Game
- 6.1.2. Movie
- 6.1.3. Social Media Interaction
- 6.1.4. Virtual Tour
- 6.1.5. Others
- 6.2. Market Analysis, Insights and Forecast - by Types
- 6.2.1. Cathode Ray Tube Projection Technology
- 6.2.2. LCD Projection Technology
- 6.2.3. Liquid Crystal on Silicon Projection Technology
- 6.2.4. Reflective LCD Projection Technology
- 6.1. Market Analysis, Insights and Forecast - by Application
- 7. South America HD VR Head Mounted Display Analysis, Insights and Forecast, 2020-2032
- 7.1. Market Analysis, Insights and Forecast - by Application
- 7.1.1. Game
- 7.1.2. Movie
- 7.1.3. Social Media Interaction
- 7.1.4. Virtual Tour
- 7.1.5. Others
- 7.2. Market Analysis, Insights and Forecast - by Types
- 7.2.1. Cathode Ray Tube Projection Technology
- 7.2.2. LCD Projection Technology
- 7.2.3. Liquid Crystal on Silicon Projection Technology
- 7.2.4. Reflective LCD Projection Technology
- 7.1. Market Analysis, Insights and Forecast - by Application
- 8. Europe HD VR Head Mounted Display Analysis, Insights and Forecast, 2020-2032
- 8.1. Market Analysis, Insights and Forecast - by Application
- 8.1.1. Game
- 8.1.2. Movie
- 8.1.3. Social Media Interaction
- 8.1.4. Virtual Tour
- 8.1.5. Others
- 8.2. Market Analysis, Insights and Forecast - by Types
- 8.2.1. Cathode Ray Tube Projection Technology
- 8.2.2. LCD Projection Technology
- 8.2.3. Liquid Crystal on Silicon Projection Technology
- 8.2.4. Reflective LCD Projection Technology
- 8.1. Market Analysis, Insights and Forecast - by Application
- 9. Middle East & Africa HD VR Head Mounted Display Analysis, Insights and Forecast, 2020-2032
- 9.1. Market Analysis, Insights and Forecast - by Application
- 9.1.1. Game
- 9.1.2. Movie
- 9.1.3. Social Media Interaction
- 9.1.4. Virtual Tour
- 9.1.5. Others
- 9.2. Market Analysis, Insights and Forecast - by Types
- 9.2.1. Cathode Ray Tube Projection Technology
- 9.2.2. LCD Projection Technology
- 9.2.3. Liquid Crystal on Silicon Projection Technology
- 9.2.4. Reflective LCD Projection Technology
- 9.1. Market Analysis, Insights and Forecast - by Application
- 10. Asia Pacific HD VR Head Mounted Display Analysis, Insights and Forecast, 2020-2032
- 10.1. Market Analysis, Insights and Forecast - by Application
- 10.1.1. Game
- 10.1.2. Movie
- 10.1.3. Social Media Interaction
- 10.1.4. Virtual Tour
- 10.1.5. Others
- 10.2. Market Analysis, Insights and Forecast - by Types
- 10.2.1. Cathode Ray Tube Projection Technology
- 10.2.2. LCD Projection Technology
- 10.2.3. Liquid Crystal on Silicon Projection Technology
- 10.2.4. Reflective LCD Projection Technology
- 10.1. Market Analysis, Insights and Forecast - by Application
- 11. Competitive Analysis
- 11.1. Global Market Share Analysis 2025
- 11.2. Company Profiles
- 11.2.1 Apple
- 11.2.1.1. Overview
- 11.2.1.2. Products
- 11.2.1.3. SWOT Analysis
- 11.2.1.4. Recent Developments
- 11.2.1.5. Financials (Based on Availability)
- 11.2.2 Meta
- 11.2.2.1. Overview
- 11.2.2.2. Products
- 11.2.2.3. SWOT Analysis
- 11.2.2.4. Recent Developments
- 11.2.2.5. Financials (Based on Availability)
- 11.2.3 Sony
- 11.2.3.1. Overview
- 11.2.3.2. Products
- 11.2.3.3. SWOT Analysis
- 11.2.3.4. Recent Developments
- 11.2.3.5. Financials (Based on Availability)
- 11.2.4 Eteamxr
- 11.2.4.1. Overview
- 11.2.4.2. Products
- 11.2.4.3. SWOT Analysis
- 11.2.4.4. Recent Developments
- 11.2.4.5. Financials (Based on Availability)
- 11.2.5 Media Go
- 11.2.5.1. Overview
- 11.2.5.2. Products
- 11.2.5.3. SWOT Analysis
- 11.2.5.4. Recent Developments
- 11.2.5.5. Financials (Based on Availability)
- 11.2.6 VTM Digital
- 11.2.6.1. Overview
- 11.2.6.2. Products
- 11.2.6.3. SWOT Analysis
- 11.2.6.4. Recent Developments
- 11.2.6.5. Financials (Based on Availability)
- 11.2.7 Cordex Intelligence
- 11.2.7.1. Overview
- 11.2.7.2. Products
- 11.2.7.3. SWOT Analysis
- 11.2.7.4. Recent Developments
- 11.2.7.5. Financials (Based on Availability)
- 11.2.8 Hidden Brains
- 11.2.8.1. Overview
- 11.2.8.2. Products
- 11.2.8.3. SWOT Analysis
- 11.2.8.4. Recent Developments
- 11.2.8.5. Financials (Based on Availability)
- 11.2.9 Virnect
- 11.2.9.1. Overview
- 11.2.9.2. Products
- 11.2.9.3. SWOT Analysis
- 11.2.9.4. Recent Developments
- 11.2.9.5. Financials (Based on Availability)
- 11.2.10 Samsung
- 11.2.10.1. Overview
- 11.2.10.2. Products
- 11.2.10.3. SWOT Analysis
- 11.2.10.4. Recent Developments
- 11.2.10.5. Financials (Based on Availability)
- 11.2.1 Apple
List of Figures
- Figure 1: Global HD VR Head Mounted Display Revenue Breakdown (million, %) by Region 2025 & 2033
- Figure 2: Global HD VR Head Mounted Display Volume Breakdown (K, %) by Region 2025 & 2033
- Figure 3: North America HD VR Head Mounted Display Revenue (million), by Application 2025 & 2033
- Figure 4: North America HD VR Head Mounted Display Volume (K), by Application 2025 & 2033
- Figure 5: North America HD VR Head Mounted Display Revenue Share (%), by Application 2025 & 2033
- Figure 6: North America HD VR Head Mounted Display Volume Share (%), by Application 2025 & 2033
- Figure 7: North America HD VR Head Mounted Display Revenue (million), by Types 2025 & 2033
- Figure 8: North America HD VR Head Mounted Display Volume (K), by Types 2025 & 2033
- Figure 9: North America HD VR Head Mounted Display Revenue Share (%), by Types 2025 & 2033
- Figure 10: North America HD VR Head Mounted Display Volume Share (%), by Types 2025 & 2033
- Figure 11: North America HD VR Head Mounted Display Revenue (million), by Country 2025 & 2033
- Figure 12: North America HD VR Head Mounted Display Volume (K), by Country 2025 & 2033
- Figure 13: North America HD VR Head Mounted Display Revenue Share (%), by Country 2025 & 2033
- Figure 14: North America HD VR Head Mounted Display Volume Share (%), by Country 2025 & 2033
- Figure 15: South America HD VR Head Mounted Display Revenue (million), by Application 2025 & 2033
- Figure 16: South America HD VR Head Mounted Display Volume (K), by Application 2025 & 2033
- Figure 17: South America HD VR Head Mounted Display Revenue Share (%), by Application 2025 & 2033
- Figure 18: South America HD VR Head Mounted Display Volume Share (%), by Application 2025 & 2033
- Figure 19: South America HD VR Head Mounted Display Revenue (million), by Types 2025 & 2033
- Figure 20: South America HD VR Head Mounted Display Volume (K), by Types 2025 & 2033
- Figure 21: South America HD VR Head Mounted Display Revenue Share (%), by Types 2025 & 2033
- Figure 22: South America HD VR Head Mounted Display Volume Share (%), by Types 2025 & 2033
- Figure 23: South America HD VR Head Mounted Display Revenue (million), by Country 2025 & 2033
- Figure 24: South America HD VR Head Mounted Display Volume (K), by Country 2025 & 2033
- Figure 25: South America HD VR Head Mounted Display Revenue Share (%), by Country 2025 & 2033
- Figure 26: South America HD VR Head Mounted Display Volume Share (%), by Country 2025 & 2033
- Figure 27: Europe HD VR Head Mounted Display Revenue (million), by Application 2025 & 2033
- Figure 28: Europe HD VR Head Mounted Display Volume (K), by Application 2025 & 2033
- Figure 29: Europe HD VR Head Mounted Display Revenue Share (%), by Application 2025 & 2033
- Figure 30: Europe HD VR Head Mounted Display Volume Share (%), by Application 2025 & 2033
- Figure 31: Europe HD VR Head Mounted Display Revenue (million), by Types 2025 & 2033
- Figure 32: Europe HD VR Head Mounted Display Volume (K), by Types 2025 & 2033
- Figure 33: Europe HD VR Head Mounted Display Revenue Share (%), by Types 2025 & 2033
- Figure 34: Europe HD VR Head Mounted Display Volume Share (%), by Types 2025 & 2033
- Figure 35: Europe HD VR Head Mounted Display Revenue (million), by Country 2025 & 2033
- Figure 36: Europe HD VR Head Mounted Display Volume (K), by Country 2025 & 2033
- Figure 37: Europe HD VR Head Mounted Display Revenue Share (%), by Country 2025 & 2033
- Figure 38: Europe HD VR Head Mounted Display Volume Share (%), by Country 2025 & 2033
- Figure 39: Middle East & Africa HD VR Head Mounted Display Revenue (million), by Application 2025 & 2033
- Figure 40: Middle East & Africa HD VR Head Mounted Display Volume (K), by Application 2025 & 2033
- Figure 41: Middle East & Africa HD VR Head Mounted Display Revenue Share (%), by Application 2025 & 2033
- Figure 42: Middle East & Africa HD VR Head Mounted Display Volume Share (%), by Application 2025 & 2033
- Figure 43: Middle East & Africa HD VR Head Mounted Display Revenue (million), by Types 2025 & 2033
- Figure 44: Middle East & Africa HD VR Head Mounted Display Volume (K), by Types 2025 & 2033
- Figure 45: Middle East & Africa HD VR Head Mounted Display Revenue Share (%), by Types 2025 & 2033
- Figure 46: Middle East & Africa HD VR Head Mounted Display Volume Share (%), by Types 2025 & 2033
- Figure 47: Middle East & Africa HD VR Head Mounted Display Revenue (million), by Country 2025 & 2033
- Figure 48: Middle East & Africa HD VR Head Mounted Display Volume (K), by Country 2025 & 2033
- Figure 49: Middle East & Africa HD VR Head Mounted Display Revenue Share (%), by Country 2025 & 2033
- Figure 50: Middle East & Africa HD VR Head Mounted Display Volume Share (%), by Country 2025 & 2033
- Figure 51: Asia Pacific HD VR Head Mounted Display Revenue (million), by Application 2025 & 2033
- Figure 52: Asia Pacific HD VR Head Mounted Display Volume (K), by Application 2025 & 2033
- Figure 53: Asia Pacific HD VR Head Mounted Display Revenue Share (%), by Application 2025 & 2033
- Figure 54: Asia Pacific HD VR Head Mounted Display Volume Share (%), by Application 2025 & 2033
- Figure 55: Asia Pacific HD VR Head Mounted Display Revenue (million), by Types 2025 & 2033
- Figure 56: Asia Pacific HD VR Head Mounted Display Volume (K), by Types 2025 & 2033
- Figure 57: Asia Pacific HD VR Head Mounted Display Revenue Share (%), by Types 2025 & 2033
- Figure 58: Asia Pacific HD VR Head Mounted Display Volume Share (%), by Types 2025 & 2033
- Figure 59: Asia Pacific HD VR Head Mounted Display Revenue (million), by Country 2025 & 2033
- Figure 60: Asia Pacific HD VR Head Mounted Display Volume (K), by Country 2025 & 2033
- Figure 61: Asia Pacific HD VR Head Mounted Display Revenue Share (%), by Country 2025 & 2033
- Figure 62: Asia Pacific HD VR Head Mounted Display Volume Share (%), by Country 2025 & 2033
List of Tables
- Table 1: Global HD VR Head Mounted Display Revenue million Forecast, by Application 2020 & 2033
- Table 2: Global HD VR Head Mounted Display Volume K Forecast, by Application 2020 & 2033
- Table 3: Global HD VR Head Mounted Display Revenue million Forecast, by Types 2020 & 2033
- Table 4: Global HD VR Head Mounted Display Volume K Forecast, by Types 2020 & 2033
- Table 5: Global HD VR Head Mounted Display Revenue million Forecast, by Region 2020 & 2033
- Table 6: Global HD VR Head Mounted Display Volume K Forecast, by Region 2020 & 2033
- Table 7: Global HD VR Head Mounted Display Revenue million Forecast, by Application 2020 & 2033
- Table 8: Global HD VR Head Mounted Display Volume K Forecast, by Application 2020 & 2033
- Table 9: Global HD VR Head Mounted Display Revenue million Forecast, by Types 2020 & 2033
- Table 10: Global HD VR Head Mounted Display Volume K Forecast, by Types 2020 & 2033
- Table 11: Global HD VR Head Mounted Display Revenue million Forecast, by Country 2020 & 2033
- Table 12: Global HD VR Head Mounted Display Volume K Forecast, by Country 2020 & 2033
- Table 13: United States HD VR Head Mounted Display Revenue (million) Forecast, by Application 2020 & 2033
- Table 14: United States HD VR Head Mounted Display Volume (K) Forecast, by Application 2020 & 2033
- Table 15: Canada HD VR Head Mounted Display Revenue (million) Forecast, by Application 2020 & 2033
- Table 16: Canada HD VR Head Mounted Display Volume (K) Forecast, by Application 2020 & 2033
- Table 17: Mexico HD VR Head Mounted Display Revenue (million) Forecast, by Application 2020 & 2033
- Table 18: Mexico HD VR Head Mounted Display Volume (K) Forecast, by Application 2020 & 2033
- Table 19: Global HD VR Head Mounted Display Revenue million Forecast, by Application 2020 & 2033
- Table 20: Global HD VR Head Mounted Display Volume K Forecast, by Application 2020 & 2033
- Table 21: Global HD VR Head Mounted Display Revenue million Forecast, by Types 2020 & 2033
- Table 22: Global HD VR Head Mounted Display Volume K Forecast, by Types 2020 & 2033
- Table 23: Global HD VR Head Mounted Display Revenue million Forecast, by Country 2020 & 2033
- Table 24: Global HD VR Head Mounted Display Volume K Forecast, by Country 2020 & 2033
- Table 25: Brazil HD VR Head Mounted Display Revenue (million) Forecast, by Application 2020 & 2033
- Table 26: Brazil HD VR Head Mounted Display Volume (K) Forecast, by Application 2020 & 2033
- Table 27: Argentina HD VR Head Mounted Display Revenue (million) Forecast, by Application 2020 & 2033
- Table 28: Argentina HD VR Head Mounted Display Volume (K) Forecast, by Application 2020 & 2033
- Table 29: Rest of South America HD VR Head Mounted Display Revenue (million) Forecast, by Application 2020 & 2033
- Table 30: Rest of South America HD VR Head Mounted Display Volume (K) Forecast, by Application 2020 & 2033
- Table 31: Global HD VR Head Mounted Display Revenue million Forecast, by Application 2020 & 2033
- Table 32: Global HD VR Head Mounted Display Volume K Forecast, by Application 2020 & 2033
- Table 33: Global HD VR Head Mounted Display Revenue million Forecast, by Types 2020 & 2033
- Table 34: Global HD VR Head Mounted Display Volume K Forecast, by Types 2020 & 2033
- Table 35: Global HD VR Head Mounted Display Revenue million Forecast, by Country 2020 & 2033
- Table 36: Global HD VR Head Mounted Display Volume K Forecast, by Country 2020 & 2033
- Table 37: United Kingdom HD VR Head Mounted Display Revenue (million) Forecast, by Application 2020 & 2033
- Table 38: United Kingdom HD VR Head Mounted Display Volume (K) Forecast, by Application 2020 & 2033
- Table 39: Germany HD VR Head Mounted Display Revenue (million) Forecast, by Application 2020 & 2033
- Table 40: Germany HD VR Head Mounted Display Volume (K) Forecast, by Application 2020 & 2033
- Table 41: France HD VR Head Mounted Display Revenue (million) Forecast, by Application 2020 & 2033
- Table 42: France HD VR Head Mounted Display Volume (K) Forecast, by Application 2020 & 2033
- Table 43: Italy HD VR Head Mounted Display Revenue (million) Forecast, by Application 2020 & 2033
- Table 44: Italy HD VR Head Mounted Display Volume (K) Forecast, by Application 2020 & 2033
- Table 45: Spain HD VR Head Mounted Display Revenue (million) Forecast, by Application 2020 & 2033
- Table 46: Spain HD VR Head Mounted Display Volume (K) Forecast, by Application 2020 & 2033
- Table 47: Russia HD VR Head Mounted Display Revenue (million) Forecast, by Application 2020 & 2033
- Table 48: Russia HD VR Head Mounted Display Volume (K) Forecast, by Application 2020 & 2033
- Table 49: Benelux HD VR Head Mounted Display Revenue (million) Forecast, by Application 2020 & 2033
- Table 50: Benelux HD VR Head Mounted Display Volume (K) Forecast, by Application 2020 & 2033
- Table 51: Nordics HD VR Head Mounted Display Revenue (million) Forecast, by Application 2020 & 2033
- Table 52: Nordics HD VR Head Mounted Display Volume (K) Forecast, by Application 2020 & 2033
- Table 53: Rest of Europe HD VR Head Mounted Display Revenue (million) Forecast, by Application 2020 & 2033
- Table 54: Rest of Europe HD VR Head Mounted Display Volume (K) Forecast, by Application 2020 & 2033
- Table 55: Global HD VR Head Mounted Display Revenue million Forecast, by Application 2020 & 2033
- Table 56: Global HD VR Head Mounted Display Volume K Forecast, by Application 2020 & 2033
- Table 57: Global HD VR Head Mounted Display Revenue million Forecast, by Types 2020 & 2033
- Table 58: Global HD VR Head Mounted Display Volume K Forecast, by Types 2020 & 2033
- Table 59: Global HD VR Head Mounted Display Revenue million Forecast, by Country 2020 & 2033
- Table 60: Global HD VR Head Mounted Display Volume K Forecast, by Country 2020 & 2033
- Table 61: Turkey HD VR Head Mounted Display Revenue (million) Forecast, by Application 2020 & 2033
- Table 62: Turkey HD VR Head Mounted Display Volume (K) Forecast, by Application 2020 & 2033
- Table 63: Israel HD VR Head Mounted Display Revenue (million) Forecast, by Application 2020 & 2033
- Table 64: Israel HD VR Head Mounted Display Volume (K) Forecast, by Application 2020 & 2033
- Table 65: GCC HD VR Head Mounted Display Revenue (million) Forecast, by Application 2020 & 2033
- Table 66: GCC HD VR Head Mounted Display Volume (K) Forecast, by Application 2020 & 2033
- Table 67: North Africa HD VR Head Mounted Display Revenue (million) Forecast, by Application 2020 & 2033
- Table 68: North Africa HD VR Head Mounted Display Volume (K) Forecast, by Application 2020 & 2033
- Table 69: South Africa HD VR Head Mounted Display Revenue (million) Forecast, by Application 2020 & 2033
- Table 70: South Africa HD VR Head Mounted Display Volume (K) Forecast, by Application 2020 & 2033
- Table 71: Rest of Middle East & Africa HD VR Head Mounted Display Revenue (million) Forecast, by Application 2020 & 2033
- Table 72: Rest of Middle East & Africa HD VR Head Mounted Display Volume (K) Forecast, by Application 2020 & 2033
- Table 73: Global HD VR Head Mounted Display Revenue million Forecast, by Application 2020 & 2033
- Table 74: Global HD VR Head Mounted Display Volume K Forecast, by Application 2020 & 2033
- Table 75: Global HD VR Head Mounted Display Revenue million Forecast, by Types 2020 & 2033
- Table 76: Global HD VR Head Mounted Display Volume K Forecast, by Types 2020 & 2033
- Table 77: Global HD VR Head Mounted Display Revenue million Forecast, by Country 2020 & 2033
- Table 78: Global HD VR Head Mounted Display Volume K Forecast, by Country 2020 & 2033
- Table 79: China HD VR Head Mounted Display Revenue (million) Forecast, by Application 2020 & 2033
- Table 80: China HD VR Head Mounted Display Volume (K) Forecast, by Application 2020 & 2033
- Table 81: India HD VR Head Mounted Display Revenue (million) Forecast, by Application 2020 & 2033
- Table 82: India HD VR Head Mounted Display Volume (K) Forecast, by Application 2020 & 2033
- Table 83: Japan HD VR Head Mounted Display Revenue (million) Forecast, by Application 2020 & 2033
- Table 84: Japan HD VR Head Mounted Display Volume (K) Forecast, by Application 2020 & 2033
- Table 85: South Korea HD VR Head Mounted Display Revenue (million) Forecast, by Application 2020 & 2033
- Table 86: South Korea HD VR Head Mounted Display Volume (K) Forecast, by Application 2020 & 2033
- Table 87: ASEAN HD VR Head Mounted Display Revenue (million) Forecast, by Application 2020 & 2033
- Table 88: ASEAN HD VR Head Mounted Display Volume (K) Forecast, by Application 2020 & 2033
- Table 89: Oceania HD VR Head Mounted Display Revenue (million) Forecast, by Application 2020 & 2033
- Table 90: Oceania HD VR Head Mounted Display Volume (K) Forecast, by Application 2020 & 2033
- Table 91: Rest of Asia Pacific HD VR Head Mounted Display Revenue (million) Forecast, by Application 2020 & 2033
- Table 92: Rest of Asia Pacific HD VR Head Mounted Display Volume (K) Forecast, by Application 2020 & 2033
Frequently Asked Questions
1. What is the projected Compound Annual Growth Rate (CAGR) of the HD VR Head Mounted Display?
The projected CAGR is approximately 18.03%.
2. Which companies are prominent players in the HD VR Head Mounted Display?
Key companies in the market include Apple, Meta, Sony, Eteamxr, Media Go, VTM Digital, Cordex Intelligence, Hidden Brains, Virnect, Samsung.
3. What are the main segments of the HD VR Head Mounted Display?
The market segments include Application, Types.
4. Can you provide details about the market size?
The market size is estimated to be USD 6603.63 million as of 2022.
5. What are some drivers contributing to market growth?
N/A
6. What are the notable trends driving market growth?
N/A
7. Are there any restraints impacting market growth?
N/A
8. Can you provide examples of recent developments in the market?
N/A
9. What pricing options are available for accessing the report?
Pricing options include single-user, multi-user, and enterprise licenses priced at USD 3350.00, USD 5025.00, and USD 6700.00 respectively.
10. Is the market size provided in terms of value or volume?
The market size is provided in terms of value, measured in million and volume, measured in K.
11. Are there any specific market keywords associated with the report?
Yes, the market keyword associated with the report is "HD VR Head Mounted Display," which aids in identifying and referencing the specific market segment covered.
12. How do I determine which pricing option suits my needs best?
The pricing options vary based on user requirements and access needs. Individual users may opt for single-user licenses, while businesses requiring broader access may choose multi-user or enterprise licenses for cost-effective access to the report.
13. Are there any additional resources or data provided in the HD VR Head Mounted Display report?
While the report offers comprehensive insights, it's advisable to review the specific contents or supplementary materials provided to ascertain if additional resources or data are available.
14. How can I stay updated on further developments or reports in the HD VR Head Mounted Display?
To stay informed about further developments, trends, and reports in the HD VR Head Mounted Display, consider subscribing to industry newsletters, following relevant companies and organizations, or regularly checking reputable industry news sources and publications.
Methodology
Step 1 - Identification of Relevant Samples Size from Population Database


Step 2 - Approaches for Defining Global Market Size (Value, Volume* & Price*)

Note*: In applicable scenarios
Step 3 - Data Sources
Primary Research
- Web Analytics
- Survey Reports
- Research Institute
- Latest Research Reports
- Opinion Leaders
Secondary Research
- Annual Reports
- White Paper
- Latest Press Release
- Industry Association
- Paid Database
- Investor Presentations

Step 4 - Data Triangulation
Involves using different sources of information in order to increase the validity of a study
These sources are likely to be stakeholders in a program - participants, other researchers, program staff, other community members, and so on.
Then we put all data in single framework & apply various statistical tools to find out the dynamic on the market.
During the analysis stage, feedback from the stakeholder groups would be compared to determine areas of agreement as well as areas of divergence