

Key Insights
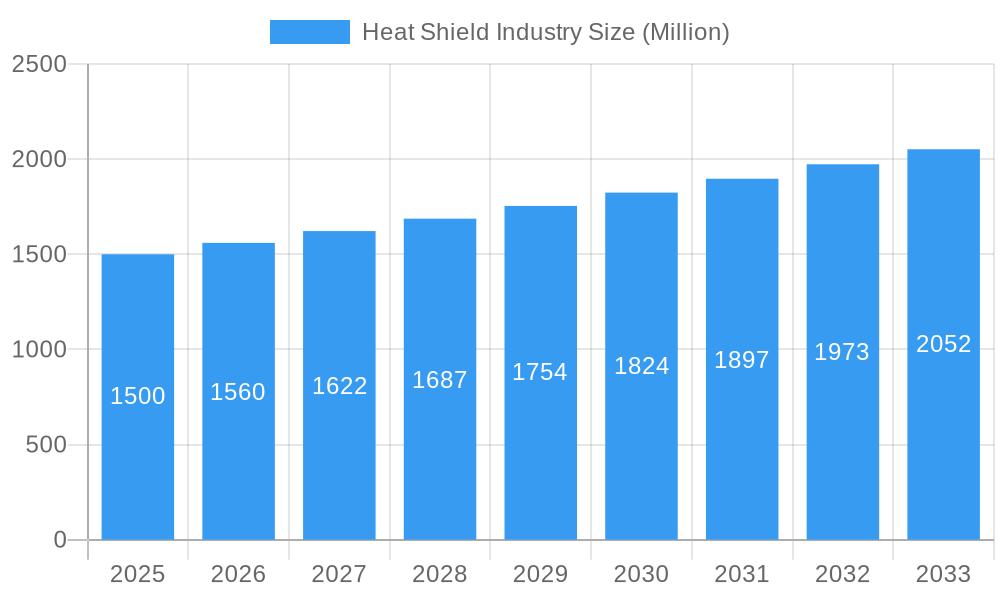
The global heat shield market, valued at $5.18 billion in the base year 2025, is projected to grow at a Compound Annual Growth Rate (CAGR) of 5.5% through 2033. This expansion is driven by increasing adoption of stringent global emission regulations, promoting fuel efficiency and reduced emissions in vehicles. The rising demand for electric vehicles (EVs) further fuels growth, as their thermal management systems require sophisticated heat protection for critical components like battery packs. Emerging economies, particularly India and China, present significant growth opportunities due to their burgeoning automotive sectors. Advancements in lightweight, durable, and efficient composite materials also contribute to market expansion. Passenger cars currently lead market share, followed by commercial vehicles. OEMs represent a larger sales channel than the aftermarket, though the latter shows strong future growth potential. North America and Europe exhibit substantial market presence due to mature automotive industries and strict environmental standards, while the Asia-Pacific region is anticipated to experience the fastest growth driven by increased vehicle production and infrastructure development.
Heat Shield Industry Market Size (In Billion)
Key market restraints include the high initial investment for advanced heat shield technologies, potentially impacting adoption in price-sensitive markets, and fluctuations in raw material prices and manufacturing complexities. However, ongoing technological innovations and the demand for enhanced vehicle performance and safety are expected to mitigate these challenges. The competitive landscape features established players such as Lydall Inc., Autoneum Holding AG, and Elringklinger AG, alongside specialized companies, all actively investing in research and development for advanced heat shield solutions. The market trajectory indicates continued upward momentum, influenced by evolving vehicle technologies, stricter emissions mandates, and global automotive industry expansion.
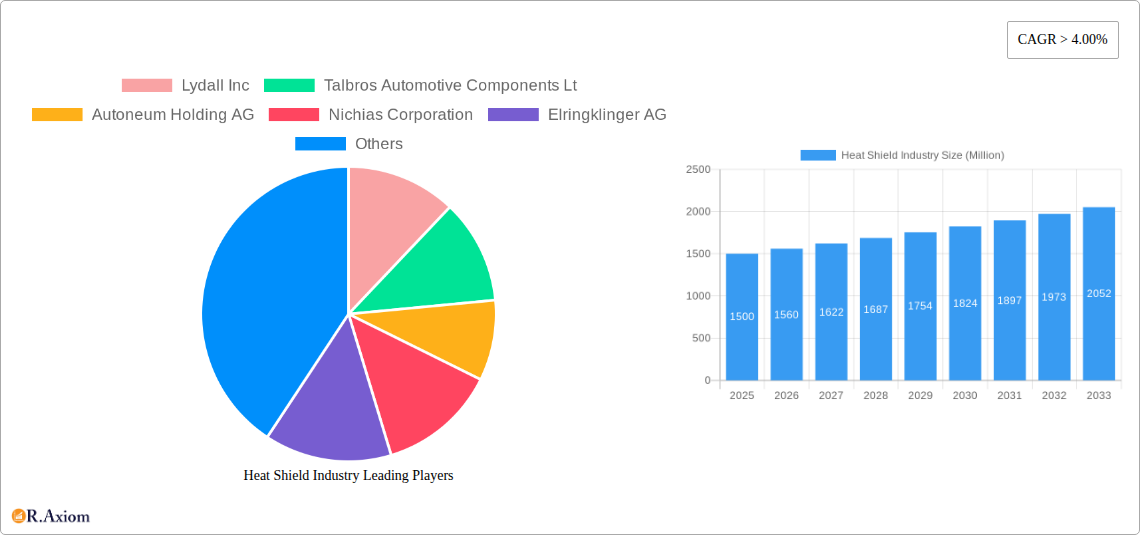
Heat Shield Industry Company Market Share
Heat Shield Industry Market Analysis: 2019-2033
This comprehensive report offers detailed insights into the global heat shield industry for stakeholders, investors, and industry professionals. Covering 2019-2033 with a focus on 2025, it analyzes market dynamics, growth drivers, challenges, and future opportunities. The study includes detailed segmentation by type (Engine Compartment, Exhaust Compartment, Other Types), vehicle type (Passenger Cars, Commercial Vehicles), and sales channel (OEMs, Aftermarket). Key players profiled include Lydall Inc, Talbros Automotive Components Ltd, Autoneum Holding AG, Nichias Corporation, Elringklinger AG, Morgan Advanced Materials, Dana Incorporated, and Federal-Mogul Corporation, detailing their market positions and strategies. The report projects a market value of $5.18 billion by 2025 and a CAGR of 5.5%.
Heat Shield Industry Market Concentration & Innovation
The global heat shield industry exhibits a moderately concentrated market structure, with a few major players holding significant market share. The exact market share distribution for 2025 is xx%, but this concentration is anticipated to shift slightly by 2033. Innovation is a key driver, fueled by the increasing demand for lightweight, high-performance materials and stricter emission regulations. The industry sees continuous development of advanced materials, such as those incorporating ceramics and composites, enhancing thermal efficiency and durability. Recent M&A activity has been modest, with reported deal values totaling approximately xx Million in the past five years. Key regulatory frameworks influencing the industry include those related to vehicle emissions and safety standards. These frameworks constantly push for improved heat shielding solutions. The primary product substitutes are primarily less effective, traditional materials and often come at a significantly higher cost for comparable performance. End-user trends show a strong preference for durable, lightweight heat shields, driving product innovation and development.
- Market Leaders (2025): Autoneum Holding AG holds an estimated xx% market share, followed by xx% for Elringklinger AG and xx% for Lydall Inc. The remaining market share is distributed across other significant players and smaller entities.
- M&A Activity (2019-2024): Total deal value estimated at xx Million, with an average deal size of xx Million.
- Innovation Focus: Lightweight materials, improved thermal performance, and enhanced durability.
Heat Shield Industry Industry Trends & Insights
The heat shield industry is experiencing robust growth, driven by the rising demand for vehicles, particularly in emerging economies. The Compound Annual Growth Rate (CAGR) from 2025-2033 is projected to be xx%, indicating significant expansion. Technological disruptions are transforming the industry with advancements in material science leading to the development of lighter and more efficient heat shields. Consumer preferences increasingly favor environmentally friendly, energy-efficient vehicles, driving the demand for advanced heat shield solutions. Competitive dynamics are shaped by continuous innovation, cost optimization, and strategic partnerships. Market penetration of advanced heat shields (e.g., those incorporating ceramic matrix composites) is growing, although xx% of the market remains occupied by traditional materials. The increasing adoption of electric and hybrid vehicles is also significantly impacting the market, creating opportunities for specialized thermal management solutions.
Dominant Markets & Segments in Heat Shield Industry
The Asia-Pacific region is currently the dominant market, driven by the robust automotive industry growth and increasing vehicle production in countries like China and India. Within the segment breakdown:
- By Type: The Engine Compartment segment holds the largest market share, owing to the critical role of engine protection. The Exhaust Compartment segment demonstrates significant growth potential driven by stringent emissions regulations.
- By Vehicle Type: Passenger Cars dominate the market, representing xx% of overall demand, with Commercial Vehicles showing consistent growth, projecting to reach xx% market share by 2033.
- By Sales Channel: OEMs (Original Equipment Manufacturers) constitute the largest sales channel, representing approximately xx% of the market. The aftermarket segment shows promising potential fueled by the rising demand for replacement parts.
Key Drivers:
- Asia-Pacific: Rapid economic growth, increasing vehicle production, and favorable government policies.
- Engine Compartment Segment: Critical role in engine protection and performance.
- Passenger Car Segment: High volume of passenger vehicle production globally.
Heat Shield Industry Product Developments
Recent product innovations focus on improving thermal performance, reducing weight, and enhancing durability. The use of advanced materials such as ceramic matrix composites (CMCs) and high-temperature polymers is gaining traction. These advancements are driven by the needs for improved fuel efficiency and reduced emissions. Many of these products boast competitive advantages, such as better heat resistance, lower weight, and extended lifespan. The market fit is strong due to the increasing demand for environmentally friendly and performance-enhancing solutions.
Report Scope & Segmentation Analysis
This report segments the heat shield market by:
- By Type: Engine Compartment, Exhaust Compartment, Other Types. Each segment demonstrates unique growth trajectories and competitive dynamics. Engine compartment currently dominates, projected to reach xx Million by 2033.
- By Vehicle Type: Passenger Cars and Commercial Vehicles. Passenger cars currently hold the majority of market share, but commercial vehicles are expected to experience higher growth rates.
- By Sales Channel: OEMs and Aftermarket. The OEM channel holds the largest share, but the aftermarket sector shows substantial growth potential.
Key Drivers of Heat Shield Industry Growth
Several factors drive growth in this industry:
- Stringent Emission Regulations: Governments worldwide enforce stricter emission standards, pushing manufacturers to adopt advanced heat shielding technologies to improve fuel efficiency and reduce emissions.
- Technological Advancements: Innovations in material science lead to lighter, more durable, and efficient heat shields.
- Rising Vehicle Production: Growing vehicle production, particularly in emerging markets, fuels demand for heat shields.
Challenges in the Heat Shield Industry Sector
The industry faces several challenges:
- Fluctuating Raw Material Prices: Changes in the price of raw materials can impact production costs and profitability.
- Supply Chain Disruptions: Global supply chain issues can cause delays and affect production.
- Intense Competition: The market is competitive, with several established players and new entrants vying for market share. This pressure is reflected in the average profit margin which was around xx% in 2024 and is projected to fall to xx% by 2033.
Emerging Opportunities in Heat Shield Industry
Significant opportunities exist in:
- Electric Vehicle (EV) Market: The rapidly expanding EV market creates substantial demand for specialized heat shields for battery thermal management.
- Lightweighting Initiatives: The focus on reducing vehicle weight to improve fuel efficiency is driving demand for lightweight heat shield solutions.
- Advanced Materials Development: Innovation in materials will continue to drive development and adoption of novel heat shield technologies.
Leading Players in the Heat Shield Industry Market
- Lydall Inc
- Talbros Automotive Components Ltd
- Autoneum Holding AG
- Nichias Corporation
- Elringklinger AG
- Morgan Advanced Materials
- Dana Incorporated
- Federal-Mogul Corporation
Key Developments in Heat Shield Industry Industry
- March 2021: Zircotec launched ZircoFlex SHIELD, a lightweight heat shield offering superior thermal performance.
- [Month, Year]: DuPont invested USD 30 Million in a new manufacturing facility in China for thermal interface materials for EV batteries.
Strategic Outlook for Heat Shield Industry Market
The heat shield industry is poised for continued growth, driven by technological advancements, increasing vehicle production, and stringent environmental regulations. Opportunities exist in expanding into new markets, developing advanced materials, and focusing on niche applications. The market is anticipated to maintain a strong growth trajectory throughout the forecast period, fueled by innovations in both materials and design, promising significant returns for strategic investors.
Heat Shield Industry Segmentation
-
1. Type
- 1.1. Engine Compartment
- 1.2. Exhaust Compartment
- 1.3. Other Types
-
2. Vehicle Type
- 2.1. Passenger Cars
- 2.2. Commercial Vehicles
-
3. Sales Channel
- 3.1. OEMs
- 3.2. Aftermarket
Heat Shield Industry Segmentation By Geography
-
1. North America
- 1.1. United States
- 1.2. Canada
- 1.3. Rest of North America
-
2. Europe
- 2.1. Germany
- 2.2. United Kingdom
- 2.3. France
- 2.4. Spain
- 2.5. Rest of Europe
-
3. Asia Pacific
- 3.1. India
- 3.2. China
- 3.3. Japan
- 3.4. South Korea
- 3.5. Rest of Asia Pacific
-
4. South America
- 4.1. Brazil
- 4.2. Argentina
- 4.3. Rest of South America
- 5. Middle East
-
6. United Arab Emirates
- 6.1. Saudi Arabia
- 6.2. Rest of Middle East
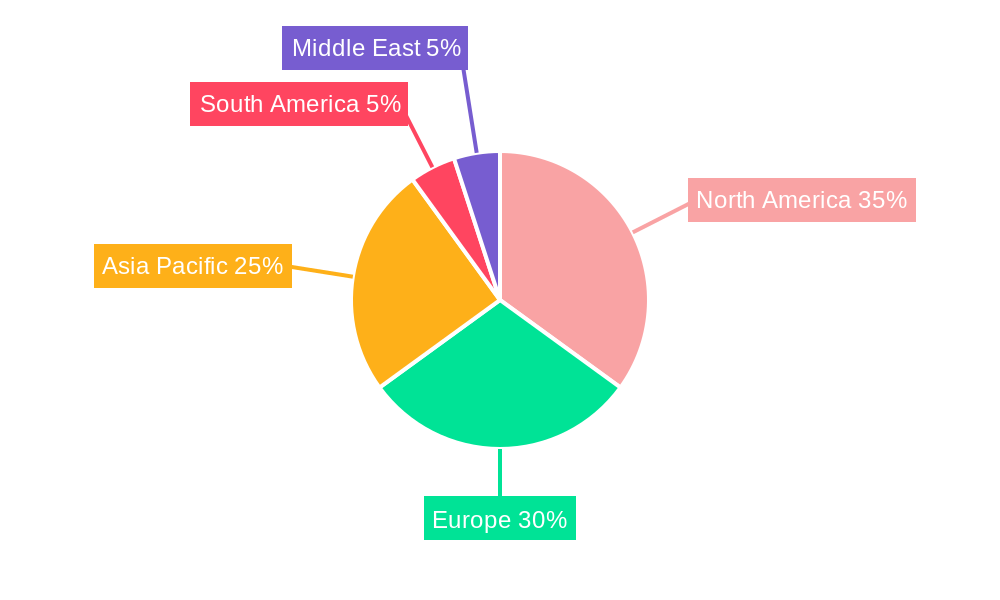
Heat Shield Industry Regional Market Share
Geographic Coverage of Heat Shield Industry
Heat Shield Industry REPORT HIGHLIGHTS
| Aspects | Details |
|---|---|
| Study Period | 2020-2034 |
| Base Year | 2025 |
| Estimated Year | 2026 |
| Forecast Period | 2026-2034 |
| Historical Period | 2020-2025 |
| Growth Rate | CAGR of 5.5% from 2020-2034 |
| Segmentation |
|
Table of Contents
- 1. Introduction
- 1.1. Research Scope
- 1.2. Market Segmentation
- 1.3. Research Objective
- 1.4. Definitions and Assumptions
- 2. Executive Summary
- 2.1. Market Snapshot
- 3. Market Dynamics
- 3.1. Market Drivers
- 3.2. Market Restrains
- 3.3. Market Trends
- 3.4. Market Opportunities
- 4. Market Factor Analysis
- 4.1. Porters Five Forces
- 4.1.1. Bargaining Power of Suppliers
- 4.1.2. Bargaining Power of Buyers
- 4.1.3. Threat of New Entrants
- 4.1.4. Threat of Substitutes
- 4.1.5. Competitive Rivalry
- 4.2. PESTEL analysis
- 4.3. BCG Analysis
- 4.3.1. Stars (High Growth, High Market Share)
- 4.3.2. Cash Cows (Low Growth, High Market Share)
- 4.3.3. Question Mark (High Growth, Low Market Share)
- 4.3.4. Dogs (Low Growth, Low Market Share)
- 4.4. Ansoff Matrix Analysis
- 4.5. Supply Chain Analysis
- 4.6. Regulatory Landscape
- 4.7. Current Market Potential and Opportunity Assessment (TAM–SAM–SOM Framework)
- 4.8. RAX Analyst Note
- 4.1. Porters Five Forces
- 5. Market Analysis, Insights and Forecast 2021-2033
- 5.1. Market Analysis, Insights and Forecast - by Type
- 5.1.1. Engine Compartment
- 5.1.2. Exhaust Compartment
- 5.1.3. Other Types
- 5.2. Market Analysis, Insights and Forecast - by Vehicle Type
- 5.2.1. Passenger Cars
- 5.2.2. Commercial Vehicles
- 5.3. Market Analysis, Insights and Forecast - by Sales Channel
- 5.3.1. OEMs
- 5.3.2. Aftermarket
- 5.4. Market Analysis, Insights and Forecast - by Region
- 5.4.1. North America
- 5.4.2. Europe
- 5.4.3. Asia Pacific
- 5.4.4. South America
- 5.4.5. Middle East
- 5.4.6. United Arab Emirates
- 5.1. Market Analysis, Insights and Forecast - by Type
- 6. Global Heat Shield Industry Analysis, Insights and Forecast, 2021-2033
- 6.1. Market Analysis, Insights and Forecast - by Type
- 6.1.1. Engine Compartment
- 6.1.2. Exhaust Compartment
- 6.1.3. Other Types
- 6.2. Market Analysis, Insights and Forecast - by Vehicle Type
- 6.2.1. Passenger Cars
- 6.2.2. Commercial Vehicles
- 6.3. Market Analysis, Insights and Forecast - by Sales Channel
- 6.3.1. OEMs
- 6.3.2. Aftermarket
- 6.1. Market Analysis, Insights and Forecast - by Type
- 7. North America Heat Shield Industry Analysis, Insights and Forecast, 2020-2032
- 7.1. Market Analysis, Insights and Forecast - by Type
- 7.1.1. Engine Compartment
- 7.1.2. Exhaust Compartment
- 7.1.3. Other Types
- 7.2. Market Analysis, Insights and Forecast - by Vehicle Type
- 7.2.1. Passenger Cars
- 7.2.2. Commercial Vehicles
- 7.3. Market Analysis, Insights and Forecast - by Sales Channel
- 7.3.1. OEMs
- 7.3.2. Aftermarket
- 7.1. Market Analysis, Insights and Forecast - by Type
- 8. Europe Heat Shield Industry Analysis, Insights and Forecast, 2020-2032
- 8.1. Market Analysis, Insights and Forecast - by Type
- 8.1.1. Engine Compartment
- 8.1.2. Exhaust Compartment
- 8.1.3. Other Types
- 8.2. Market Analysis, Insights and Forecast - by Vehicle Type
- 8.2.1. Passenger Cars
- 8.2.2. Commercial Vehicles
- 8.3. Market Analysis, Insights and Forecast - by Sales Channel
- 8.3.1. OEMs
- 8.3.2. Aftermarket
- 8.1. Market Analysis, Insights and Forecast - by Type
- 9. Asia Pacific Heat Shield Industry Analysis, Insights and Forecast, 2020-2032
- 9.1. Market Analysis, Insights and Forecast - by Type
- 9.1.1. Engine Compartment
- 9.1.2. Exhaust Compartment
- 9.1.3. Other Types
- 9.2. Market Analysis, Insights and Forecast - by Vehicle Type
- 9.2.1. Passenger Cars
- 9.2.2. Commercial Vehicles
- 9.3. Market Analysis, Insights and Forecast - by Sales Channel
- 9.3.1. OEMs
- 9.3.2. Aftermarket
- 9.1. Market Analysis, Insights and Forecast - by Type
- 10. South America Heat Shield Industry Analysis, Insights and Forecast, 2020-2032
- 10.1. Market Analysis, Insights and Forecast - by Type
- 10.1.1. Engine Compartment
- 10.1.2. Exhaust Compartment
- 10.1.3. Other Types
- 10.2. Market Analysis, Insights and Forecast - by Vehicle Type
- 10.2.1. Passenger Cars
- 10.2.2. Commercial Vehicles
- 10.3. Market Analysis, Insights and Forecast - by Sales Channel
- 10.3.1. OEMs
- 10.3.2. Aftermarket
- 10.1. Market Analysis, Insights and Forecast - by Type
- 11. Middle East Heat Shield Industry Analysis, Insights and Forecast, 2020-2032
- 11.1. Market Analysis, Insights and Forecast - by Type
- 11.1.1. Engine Compartment
- 11.1.2. Exhaust Compartment
- 11.1.3. Other Types
- 11.2. Market Analysis, Insights and Forecast - by Vehicle Type
- 11.2.1. Passenger Cars
- 11.2.2. Commercial Vehicles
- 11.3. Market Analysis, Insights and Forecast - by Sales Channel
- 11.3.1. OEMs
- 11.3.2. Aftermarket
- 11.1. Market Analysis, Insights and Forecast - by Type
- 12. United Arab Emirates Heat Shield Industry Analysis, Insights and Forecast, 2020-2032
- 12.1. Market Analysis, Insights and Forecast - by Type
- 12.1.1. Engine Compartment
- 12.1.2. Exhaust Compartment
- 12.1.3. Other Types
- 12.2. Market Analysis, Insights and Forecast - by Vehicle Type
- 12.2.1. Passenger Cars
- 12.2.2. Commercial Vehicles
- 12.3. Market Analysis, Insights and Forecast - by Sales Channel
- 12.3.1. OEMs
- 12.3.2. Aftermarket
- 12.1. Market Analysis, Insights and Forecast - by Type
- 13. Competitive Analysis
- 13.1. Company Profiles
- 13.1.1 Lydall Inc
- 13.1.1.1. Company Overview
- 13.1.1.2. Products
- 13.1.1.3. Company Financials
- 13.1.1.4. SWOT Analysis
- 13.1.2 Talbros Automotive Components Lt
- 13.1.2.1. Company Overview
- 13.1.2.2. Products
- 13.1.2.3. Company Financials
- 13.1.2.4. SWOT Analysis
- 13.1.3 Autoneum Holding AG
- 13.1.3.1. Company Overview
- 13.1.3.2. Products
- 13.1.3.3. Company Financials
- 13.1.3.4. SWOT Analysis
- 13.1.4 Nichias Corporation
- 13.1.4.1. Company Overview
- 13.1.4.2. Products
- 13.1.4.3. Company Financials
- 13.1.4.4. SWOT Analysis
- 13.1.5 Elringklinger AG
- 13.1.5.1. Company Overview
- 13.1.5.2. Products
- 13.1.5.3. Company Financials
- 13.1.5.4. SWOT Analysis
- 13.1.6 Morgan Advanced Materials
- 13.1.6.1. Company Overview
- 13.1.6.2. Products
- 13.1.6.3. Company Financials
- 13.1.6.4. SWOT Analysis
- 13.1.7 Dana Incorporated
- 13.1.7.1. Company Overview
- 13.1.7.2. Products
- 13.1.7.3. Company Financials
- 13.1.7.4. SWOT Analysis
- 13.1.8 Federal-Mogul Corporation
- 13.1.8.1. Company Overview
- 13.1.8.2. Products
- 13.1.8.3. Company Financials
- 13.1.8.4. SWOT Analysis
- 13.1.1 Lydall Inc
- 13.2. Market Entropy
- 13.2.1 Company's Key Areas Served
- 13.2.2 Recent Developments
- 13.3. Company Market Share Analysis 2025
- 13.3.1 Top 5 Companies Market Share Analysis
- 13.3.2 Top 3 Companies Market Share Analysis
- 13.4. List of Potential Customers
- 14. Research Methodology
List of Figures
- Figure 1: Global Heat Shield Industry Revenue Breakdown (billion, %) by Region 2025 & 2033
- Figure 2: North America Heat Shield Industry Revenue (billion), by Type 2025 & 2033
- Figure 3: North America Heat Shield Industry Revenue Share (%), by Type 2025 & 2033
- Figure 4: North America Heat Shield Industry Revenue (billion), by Vehicle Type 2025 & 2033
- Figure 5: North America Heat Shield Industry Revenue Share (%), by Vehicle Type 2025 & 2033
- Figure 6: North America Heat Shield Industry Revenue (billion), by Sales Channel 2025 & 2033
- Figure 7: North America Heat Shield Industry Revenue Share (%), by Sales Channel 2025 & 2033
- Figure 8: North America Heat Shield Industry Revenue (billion), by Country 2025 & 2033
- Figure 9: North America Heat Shield Industry Revenue Share (%), by Country 2025 & 2033
- Figure 10: Europe Heat Shield Industry Revenue (billion), by Type 2025 & 2033
- Figure 11: Europe Heat Shield Industry Revenue Share (%), by Type 2025 & 2033
- Figure 12: Europe Heat Shield Industry Revenue (billion), by Vehicle Type 2025 & 2033
- Figure 13: Europe Heat Shield Industry Revenue Share (%), by Vehicle Type 2025 & 2033
- Figure 14: Europe Heat Shield Industry Revenue (billion), by Sales Channel 2025 & 2033
- Figure 15: Europe Heat Shield Industry Revenue Share (%), by Sales Channel 2025 & 2033
- Figure 16: Europe Heat Shield Industry Revenue (billion), by Country 2025 & 2033
- Figure 17: Europe Heat Shield Industry Revenue Share (%), by Country 2025 & 2033
- Figure 18: Asia Pacific Heat Shield Industry Revenue (billion), by Type 2025 & 2033
- Figure 19: Asia Pacific Heat Shield Industry Revenue Share (%), by Type 2025 & 2033
- Figure 20: Asia Pacific Heat Shield Industry Revenue (billion), by Vehicle Type 2025 & 2033
- Figure 21: Asia Pacific Heat Shield Industry Revenue Share (%), by Vehicle Type 2025 & 2033
- Figure 22: Asia Pacific Heat Shield Industry Revenue (billion), by Sales Channel 2025 & 2033
- Figure 23: Asia Pacific Heat Shield Industry Revenue Share (%), by Sales Channel 2025 & 2033
- Figure 24: Asia Pacific Heat Shield Industry Revenue (billion), by Country 2025 & 2033
- Figure 25: Asia Pacific Heat Shield Industry Revenue Share (%), by Country 2025 & 2033
- Figure 26: South America Heat Shield Industry Revenue (billion), by Type 2025 & 2033
- Figure 27: South America Heat Shield Industry Revenue Share (%), by Type 2025 & 2033
- Figure 28: South America Heat Shield Industry Revenue (billion), by Vehicle Type 2025 & 2033
- Figure 29: South America Heat Shield Industry Revenue Share (%), by Vehicle Type 2025 & 2033
- Figure 30: South America Heat Shield Industry Revenue (billion), by Sales Channel 2025 & 2033
- Figure 31: South America Heat Shield Industry Revenue Share (%), by Sales Channel 2025 & 2033
- Figure 32: South America Heat Shield Industry Revenue (billion), by Country 2025 & 2033
- Figure 33: South America Heat Shield Industry Revenue Share (%), by Country 2025 & 2033
- Figure 34: Middle East Heat Shield Industry Revenue (billion), by Type 2025 & 2033
- Figure 35: Middle East Heat Shield Industry Revenue Share (%), by Type 2025 & 2033
- Figure 36: Middle East Heat Shield Industry Revenue (billion), by Vehicle Type 2025 & 2033
- Figure 37: Middle East Heat Shield Industry Revenue Share (%), by Vehicle Type 2025 & 2033
- Figure 38: Middle East Heat Shield Industry Revenue (billion), by Sales Channel 2025 & 2033
- Figure 39: Middle East Heat Shield Industry Revenue Share (%), by Sales Channel 2025 & 2033
- Figure 40: Middle East Heat Shield Industry Revenue (billion), by Country 2025 & 2033
- Figure 41: Middle East Heat Shield Industry Revenue Share (%), by Country 2025 & 2033
- Figure 42: United Arab Emirates Heat Shield Industry Revenue (billion), by Type 2025 & 2033
- Figure 43: United Arab Emirates Heat Shield Industry Revenue Share (%), by Type 2025 & 2033
- Figure 44: United Arab Emirates Heat Shield Industry Revenue (billion), by Vehicle Type 2025 & 2033
- Figure 45: United Arab Emirates Heat Shield Industry Revenue Share (%), by Vehicle Type 2025 & 2033
- Figure 46: United Arab Emirates Heat Shield Industry Revenue (billion), by Sales Channel 2025 & 2033
- Figure 47: United Arab Emirates Heat Shield Industry Revenue Share (%), by Sales Channel 2025 & 2033
- Figure 48: United Arab Emirates Heat Shield Industry Revenue (billion), by Country 2025 & 2033
- Figure 49: United Arab Emirates Heat Shield Industry Revenue Share (%), by Country 2025 & 2033
List of Tables
- Table 1: Global Heat Shield Industry Revenue billion Forecast, by Type 2020 & 2033
- Table 2: Global Heat Shield Industry Revenue billion Forecast, by Vehicle Type 2020 & 2033
- Table 3: Global Heat Shield Industry Revenue billion Forecast, by Sales Channel 2020 & 2033
- Table 4: Global Heat Shield Industry Revenue billion Forecast, by Region 2020 & 2033
- Table 5: Global Heat Shield Industry Revenue billion Forecast, by Type 2020 & 2033
- Table 6: Global Heat Shield Industry Revenue billion Forecast, by Vehicle Type 2020 & 2033
- Table 7: Global Heat Shield Industry Revenue billion Forecast, by Sales Channel 2020 & 2033
- Table 8: Global Heat Shield Industry Revenue billion Forecast, by Country 2020 & 2033
- Table 9: United States Heat Shield Industry Revenue (billion) Forecast, by Application 2020 & 2033
- Table 10: Canada Heat Shield Industry Revenue (billion) Forecast, by Application 2020 & 2033
- Table 11: Rest of North America Heat Shield Industry Revenue (billion) Forecast, by Application 2020 & 2033
- Table 12: Global Heat Shield Industry Revenue billion Forecast, by Type 2020 & 2033
- Table 13: Global Heat Shield Industry Revenue billion Forecast, by Vehicle Type 2020 & 2033
- Table 14: Global Heat Shield Industry Revenue billion Forecast, by Sales Channel 2020 & 2033
- Table 15: Global Heat Shield Industry Revenue billion Forecast, by Country 2020 & 2033
- Table 16: Germany Heat Shield Industry Revenue (billion) Forecast, by Application 2020 & 2033
- Table 17: United Kingdom Heat Shield Industry Revenue (billion) Forecast, by Application 2020 & 2033
- Table 18: France Heat Shield Industry Revenue (billion) Forecast, by Application 2020 & 2033
- Table 19: Spain Heat Shield Industry Revenue (billion) Forecast, by Application 2020 & 2033
- Table 20: Rest of Europe Heat Shield Industry Revenue (billion) Forecast, by Application 2020 & 2033
- Table 21: Global Heat Shield Industry Revenue billion Forecast, by Type 2020 & 2033
- Table 22: Global Heat Shield Industry Revenue billion Forecast, by Vehicle Type 2020 & 2033
- Table 23: Global Heat Shield Industry Revenue billion Forecast, by Sales Channel 2020 & 2033
- Table 24: Global Heat Shield Industry Revenue billion Forecast, by Country 2020 & 2033
- Table 25: India Heat Shield Industry Revenue (billion) Forecast, by Application 2020 & 2033
- Table 26: China Heat Shield Industry Revenue (billion) Forecast, by Application 2020 & 2033
- Table 27: Japan Heat Shield Industry Revenue (billion) Forecast, by Application 2020 & 2033
- Table 28: South Korea Heat Shield Industry Revenue (billion) Forecast, by Application 2020 & 2033
- Table 29: Rest of Asia Pacific Heat Shield Industry Revenue (billion) Forecast, by Application 2020 & 2033
- Table 30: Global Heat Shield Industry Revenue billion Forecast, by Type 2020 & 2033
- Table 31: Global Heat Shield Industry Revenue billion Forecast, by Vehicle Type 2020 & 2033
- Table 32: Global Heat Shield Industry Revenue billion Forecast, by Sales Channel 2020 & 2033
- Table 33: Global Heat Shield Industry Revenue billion Forecast, by Country 2020 & 2033
- Table 34: Brazil Heat Shield Industry Revenue (billion) Forecast, by Application 2020 & 2033
- Table 35: Argentina Heat Shield Industry Revenue (billion) Forecast, by Application 2020 & 2033
- Table 36: Rest of South America Heat Shield Industry Revenue (billion) Forecast, by Application 2020 & 2033
- Table 37: Global Heat Shield Industry Revenue billion Forecast, by Type 2020 & 2033
- Table 38: Global Heat Shield Industry Revenue billion Forecast, by Vehicle Type 2020 & 2033
- Table 39: Global Heat Shield Industry Revenue billion Forecast, by Sales Channel 2020 & 2033
- Table 40: Global Heat Shield Industry Revenue billion Forecast, by Country 2020 & 2033
- Table 41: Global Heat Shield Industry Revenue billion Forecast, by Type 2020 & 2033
- Table 42: Global Heat Shield Industry Revenue billion Forecast, by Vehicle Type 2020 & 2033
- Table 43: Global Heat Shield Industry Revenue billion Forecast, by Sales Channel 2020 & 2033
- Table 44: Global Heat Shield Industry Revenue billion Forecast, by Country 2020 & 2033
- Table 45: Saudi Arabia Heat Shield Industry Revenue (billion) Forecast, by Application 2020 & 2033
- Table 46: Rest of Middle East Heat Shield Industry Revenue (billion) Forecast, by Application 2020 & 2033
Frequently Asked Questions
1. What is the projected Compound Annual Growth Rate (CAGR) of the Heat Shield Industry?
The projected CAGR is approximately 5.5%.
2. Which companies are prominent players in the Heat Shield Industry?
Key companies in the market include Lydall Inc, Talbros Automotive Components Lt, Autoneum Holding AG, Nichias Corporation, Elringklinger AG, Morgan Advanced Materials, Dana Incorporated, Federal-Mogul Corporation.
3. What are the main segments of the Heat Shield Industry?
The market segments include Type, Vehicle Type, Sales Channel.
4. Can you provide details about the market size?
The market size is estimated to be USD 5.18 billion as of 2022.
5. What are some drivers contributing to market growth?
Rising Demand for Small Boats; Expanding Recreational Boating Opportunities.
6. What are the notable trends driving market growth?
High Cost of Heat Shield in Aftermarket and Increasing Electric Vehicle Sales Restraining the Market Growth.
7. Are there any restraints impacting market growth?
Strict Emission Norms for Recreation Boats Likely to Have Negative Impact.
8. Can you provide examples of recent developments in the market?
In March 2021, Zircotec launched ZircoFlex SHIELD. ZircoFlex SHIELD reportedly achieves better thermal performance at 40% lower weight and 46% lower volume than competing heat-shield products.
9. What pricing options are available for accessing the report?
Pricing options include single-user, multi-user, and enterprise licenses priced at USD 4750, USD 5250, and USD 8750 respectively.
10. Is the market size provided in terms of value or volume?
The market size is provided in terms of value, measured in billion.
11. Are there any specific market keywords associated with the report?
Yes, the market keyword associated with the report is "Heat Shield Industry," which aids in identifying and referencing the specific market segment covered.
12. How do I determine which pricing option suits my needs best?
The pricing options vary based on user requirements and access needs. Individual users may opt for single-user licenses, while businesses requiring broader access may choose multi-user or enterprise licenses for cost-effective access to the report.
13. Are there any additional resources or data provided in the Heat Shield Industry report?
While the report offers comprehensive insights, it's advisable to review the specific contents or supplementary materials provided to ascertain if additional resources or data are available.
14. How can I stay updated on further developments or reports in the Heat Shield Industry?
To stay informed about further developments, trends, and reports in the Heat Shield Industry, consider subscribing to industry newsletters, following relevant companies and organizations, or regularly checking reputable industry news sources and publications.
Methodology
Step 1 - Identification of Relevant Samples Size from Population Database


Step 2 - Approaches for Defining Global Market Size (Value, Volume* & Price*)

Note*: In applicable scenarios
Step 3 - Data Sources
Primary Research
- Web Analytics
- Survey Reports
- Research Institute
- Latest Research Reports
- Opinion Leaders
Secondary Research
- Annual Reports
- White Paper
- Latest Press Release
- Industry Association
- Paid Database
- Investor Presentations

Step 4 - Data Triangulation
Involves using different sources of information in order to increase the validity of a study
These sources are likely to be stakeholders in a program - participants, other researchers, program staff, other community members, and so on.
Then we put all data in single framework & apply various statistical tools to find out the dynamic on the market.
During the analysis stage, feedback from the stakeholder groups would be compared to determine areas of agreement as well as areas of divergence