

Key Insights
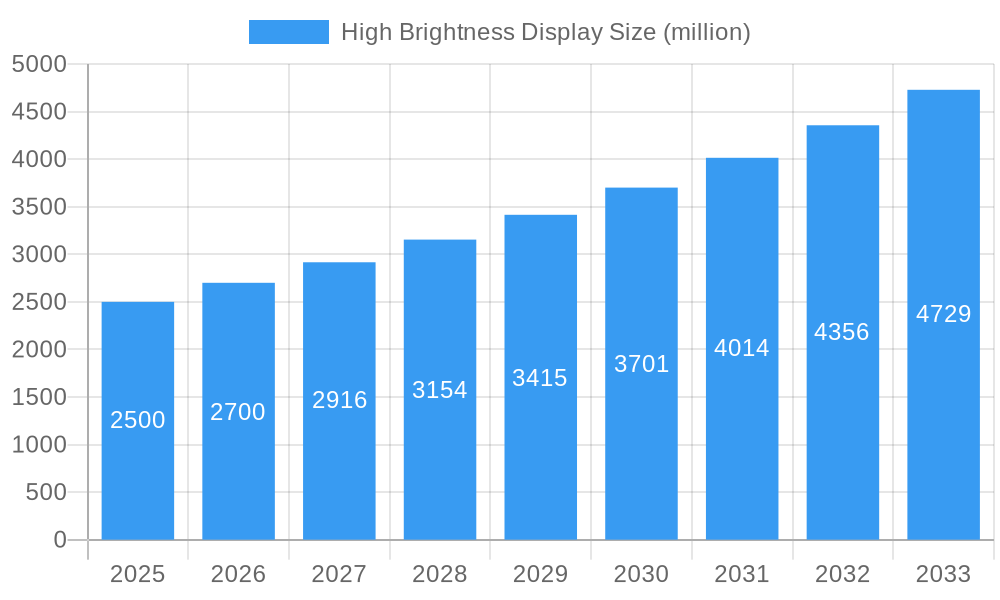
The high-brightness display market is experiencing robust growth, driven by increasing demand across diverse sectors. The market, estimated at $2.5 billion in 2025, is projected to exhibit a Compound Annual Growth Rate (CAGR) of 8% from 2025 to 2033, reaching approximately $4.5 billion by 2033. This expansion is fueled by several key factors. The proliferation of outdoor digital signage, particularly in retail, transportation, and public information displays, significantly boosts market demand. Technological advancements, such as the development of more energy-efficient and durable high-brightness displays with improved resolution and contrast ratios, are further driving market expansion. Furthermore, the growing adoption of LED and mini-LED backlighting technologies is enhancing the brightness, color accuracy, and lifespan of these displays, contributing to their increasing appeal across applications.
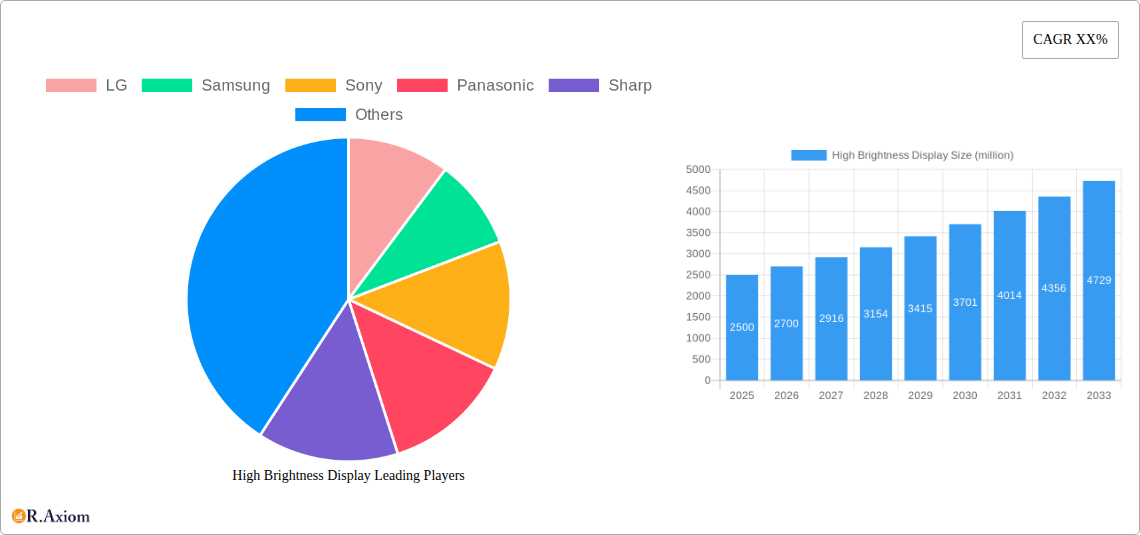
High Brightness Display Market Size (In Billion)
However, certain restraints are impacting the market's trajectory. High initial investment costs associated with high-brightness display technologies can pose a challenge for smaller businesses. Furthermore, concerns regarding power consumption and heat dissipation in high-brightness displays need to be addressed for continued market penetration. Despite these challenges, the market is expected to witness strong growth due to the increasing adoption of advanced display technologies in various applications. The segmentation of the market includes different display technologies (LED, LCD, OLED), screen sizes, and applications (digital signage, industrial, automotive, etc.). Key players such as LG, Samsung, and others are actively innovating and expanding their product portfolios to cater to the growing market needs. The competitive landscape is characterized by both established players and emerging companies striving to provide superior solutions and capture a larger share of the expanding high-brightness display market.
High Brightness Display Company Market Share
This comprehensive report provides an in-depth analysis of the High Brightness Display market, offering valuable insights for industry stakeholders, investors, and businesses seeking to navigate this dynamic landscape. The report covers the period from 2019 to 2033, with a focus on the estimated year 2025 and a forecast period spanning 2025-2033. The historical period analyzed is 2019-2024. Market values are expressed in millions.
High Brightness Display Market Concentration & Innovation
This section analyzes market concentration, highlighting the leading players and their market share, innovation drivers shaping the industry, the regulatory landscape, the presence of product substitutes, evolving end-user trends, and significant M&A activities. The analysis reveals a moderately concentrated market, with the top five players—LG, Samsung, Sony, BOE Technology Group, and AU Optronics Corporation—holding an estimated xx% of the market share in 2025. Innovation is driven primarily by advancements in LED and mini-LED technologies, pushing for higher brightness levels and improved energy efficiency. Regulatory frameworks focusing on energy consumption and environmental impact are influencing product development. Significant M&A activity, totaling an estimated $xx million between 2019 and 2024, has reshaped the competitive landscape, with larger players consolidating their market positions through acquisitions.
- Top 5 Players Market Share (2025): xx%
- M&A Deal Value (2019-2024): $xx million
- Key Innovation Drivers: LED/Mini-LED advancements, HDR technology, improved power efficiency.
- Regulatory Focus: Energy consumption standards, environmental regulations.
High Brightness Display Industry Trends & Insights
This section delves into the key trends and insights shaping the High Brightness Display market, exploring market growth drivers, technological disruptions, evolving consumer preferences, and intense competitive dynamics. The market is projected to experience a Compound Annual Growth Rate (CAGR) of xx% during the forecast period (2025-2033), driven by increasing demand from diverse sectors like digital signage, outdoor advertising, and industrial applications. Technological advancements, such as the adoption of micro-LED and advancements in HDR, are significantly impacting market growth. Consumer preferences are shifting towards higher brightness levels, improved color accuracy, and greater energy efficiency. Intense competition among major players is pushing for continuous innovation and cost optimization. Market penetration of high-brightness displays is expected to reach xx% by 2033.
- Projected CAGR (2025-2033): xx%
- Market Penetration (2033): xx%
- Key Growth Drivers: Rising demand from digital signage, advancements in display technologies, increasing adoption in industrial sectors.
- Competitive Dynamics: Intense competition, pricing pressures, focus on innovation and differentiation.
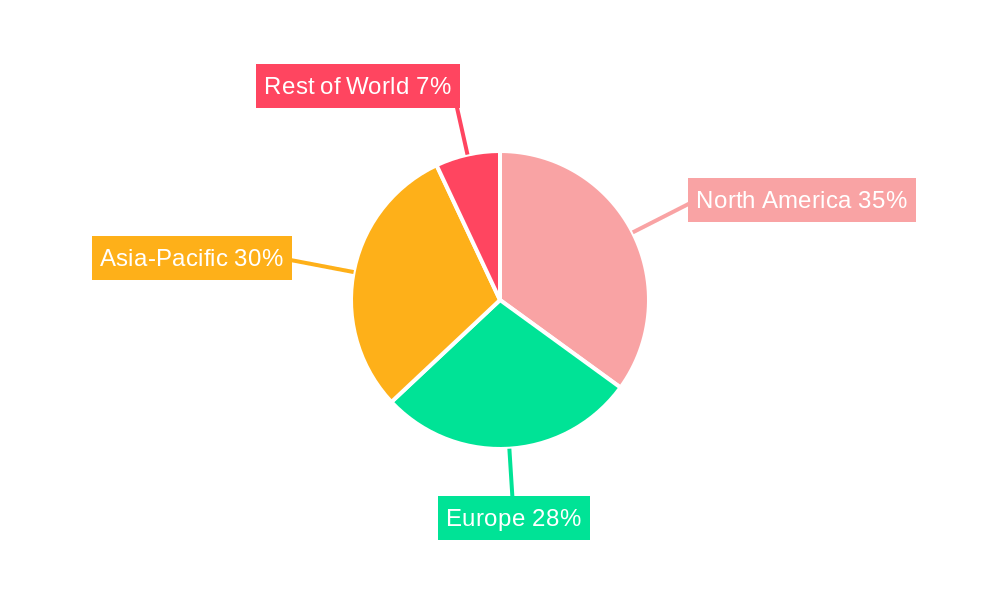
Dominant Markets & Segments in High Brightness Display
This section identifies the leading regions, countries, and segments within the High Brightness Display market. The analysis reveals that North America currently holds the largest market share, driven by strong demand from the digital signage and commercial display sectors. Key drivers for this dominance include robust economic growth, advanced infrastructure, and a high concentration of major players. However, the Asia-Pacific region is projected to experience significant growth during the forecast period due to rapid urbanization and increasing investments in infrastructure projects.
- Leading Region: North America (2025)
- Key Drivers (North America): Strong economic growth, developed infrastructure, high adoption rates.
- Growth Potential (Asia-Pacific): Rapid urbanization, infrastructure development, rising disposable income.
- Segment Dominance: The digital signage segment is expected to be the largest revenue generator throughout the forecast period, followed by the industrial and transportation sectors.
High Brightness Display Product Developments
Recent product innovations in the high-brightness display market are characterized by a focus on enhanced brightness levels, improved power efficiency, and wider color gamuts. Mini-LED and micro-LED technologies are gaining traction due to their superior performance and potential for smaller form factors. These advancements are enabling applications in diverse sectors, such as outdoor advertising, transportation, and industrial settings. The competitive advantage lies in offering superior performance, energy efficiency, and robust durability suitable for demanding environments.
Report Scope & Segmentation Analysis
This report segments the High Brightness Display market based on technology (LED, LCD, OLED, etc.), application (digital signage, outdoor advertising, industrial, etc.), and geography (North America, Europe, Asia-Pacific, etc.). Each segment exhibits unique growth trajectories and competitive dynamics. The LED segment is projected to dominate due to its cost-effectiveness and mature technology. The digital signage application segment is anticipated to show the highest growth rate driven by expanding advertising budgets.
Key Drivers of High Brightness Display Growth
The growth of the High Brightness Display market is propelled by several key factors: the increasing demand for digital signage solutions in commercial spaces and public areas; technological advancements in display technologies, resulting in higher brightness and better energy efficiency; and the expanding application of high-brightness displays in various sectors, including transportation, industrial automation, and military. Furthermore, supportive government regulations and initiatives promoting the adoption of energy-efficient display technologies are contributing significantly.
Challenges in the High Brightness Display Sector
The high-brightness display market faces several challenges, including the high initial investment costs associated with adopting advanced display technologies; the complexity and cost of manufacturing high-brightness displays, potentially impacting profitability; and intense competition among major players, leading to price pressures and reduced profit margins. The dependence on raw materials and the susceptibility to global supply chain disruptions pose further risks. These challenges could impact market growth if not effectively managed.
Emerging Opportunities in High Brightness Display
Emerging opportunities in the high-brightness display market include the growing adoption of extended reality (XR) technologies, requiring high-brightness displays for immersive experiences; the development of innovative applications in the automotive sector for infotainment and heads-up displays; and the integration of AI and machine learning capabilities to create smarter, more responsive displays. Expansion into new markets and applications, including the development of flexible and transparent high-brightness displays, presents significant future growth potential.
Leading Players in the High Brightness Display Market
- LG
- Samsung
- Sony
- Panasonic
- Sharp
- AU Optronics Corporation
- Peerless
- TVC
- Teksmart
- BOE Technology Group
- Planar
- DynaScan
- Innolux Corporation
- Tianma Microelectronics Co., Ltd.
- Display Innovations
- Iiyama
- Allsee Technologies
- Mid West
- Crystal Display Systems
- Hisense
- WINSTAR
- Himax Technologies
- Lilliput
- LifeSize Touch
- Winmate
- Armagard
- Luminati
- Litemax
Key Developments in High Brightness Display Industry
- 2022 Q3: LG Electronics launched its new series of high-brightness displays featuring improved color accuracy.
- 2023 Q1: Samsung Display announced a significant investment in micro-LED technology for high-brightness display production.
- 2024 Q2: BOE Technology Group unveiled a new generation of high-brightness displays with enhanced energy efficiency. (Further developments can be added here as they occur)
Strategic Outlook for High Brightness Display Market
The future of the high-brightness display market looks promising, driven by the ongoing technological advancements in display technologies, expanding applications across diverse sectors, and the increasing adoption of advanced display solutions. The market is poised for robust growth, fueled by innovations in micro-LED, advancements in HDR, and the rising demand for immersive and interactive experiences. Companies that invest in research and development, focus on sustainable manufacturing practices, and adapt to changing market demands are expected to thrive in this competitive landscape.
High Brightness Display Segmentation
-
1. Application
- 1.1. Advertising Media
- 1.2. Information Display
- 1.3. Sports Arena
- 1.4. Traffic and Security
- 1.5. Others
-
2. Types
- 2.1. Indoor Display
- 2.2. Outdoor Display
High Brightness Display Segmentation By Geography
-
1. North America
- 1.1. United States
- 1.2. Canada
- 1.3. Mexico
-
2. South America
- 2.1. Brazil
- 2.2. Argentina
- 2.3. Rest of South America
-
3. Europe
- 3.1. United Kingdom
- 3.2. Germany
- 3.3. France
- 3.4. Italy
- 3.5. Spain
- 3.6. Russia
- 3.7. Benelux
- 3.8. Nordics
- 3.9. Rest of Europe
-
4. Middle East & Africa
- 4.1. Turkey
- 4.2. Israel
- 4.3. GCC
- 4.4. North Africa
- 4.5. South Africa
- 4.6. Rest of Middle East & Africa
-
5. Asia Pacific
- 5.1. China
- 5.2. India
- 5.3. Japan
- 5.4. South Korea
- 5.5. ASEAN
- 5.6. Oceania
- 5.7. Rest of Asia Pacific
High Brightness Display Regional Market Share
Geographic Coverage of High Brightness Display
High Brightness Display REPORT HIGHLIGHTS
| Aspects | Details |
|---|---|
| Study Period | 2020-2034 |
| Base Year | 2025 |
| Estimated Year | 2026 |
| Forecast Period | 2026-2034 |
| Historical Period | 2020-2025 |
| Growth Rate | CAGR of 30.3% from 2020-2034 |
| Segmentation |
|
Table of Contents
- 1. Introduction
- 1.1. Research Scope
- 1.2. Market Segmentation
- 1.3. Research Methodology
- 1.4. Definitions and Assumptions
- 2. Executive Summary
- 2.1. Introduction
- 3. Market Dynamics
- 3.1. Introduction
- 3.2. Market Drivers
- 3.3. Market Restrains
- 3.4. Market Trends
- 4. Market Factor Analysis
- 4.1. Porters Five Forces
- 4.2. Supply/Value Chain
- 4.3. PESTEL analysis
- 4.4. Market Entropy
- 4.5. Patent/Trademark Analysis
- 5. Global High Brightness Display Analysis, Insights and Forecast, 2020-2032
- 5.1. Market Analysis, Insights and Forecast - by Application
- 5.1.1. Advertising Media
- 5.1.2. Information Display
- 5.1.3. Sports Arena
- 5.1.4. Traffic and Security
- 5.1.5. Others
- 5.2. Market Analysis, Insights and Forecast - by Types
- 5.2.1. Indoor Display
- 5.2.2. Outdoor Display
- 5.3. Market Analysis, Insights and Forecast - by Region
- 5.3.1. North America
- 5.3.2. South America
- 5.3.3. Europe
- 5.3.4. Middle East & Africa
- 5.3.5. Asia Pacific
- 5.1. Market Analysis, Insights and Forecast - by Application
- 6. North America High Brightness Display Analysis, Insights and Forecast, 2020-2032
- 6.1. Market Analysis, Insights and Forecast - by Application
- 6.1.1. Advertising Media
- 6.1.2. Information Display
- 6.1.3. Sports Arena
- 6.1.4. Traffic and Security
- 6.1.5. Others
- 6.2. Market Analysis, Insights and Forecast - by Types
- 6.2.1. Indoor Display
- 6.2.2. Outdoor Display
- 6.1. Market Analysis, Insights and Forecast - by Application
- 7. South America High Brightness Display Analysis, Insights and Forecast, 2020-2032
- 7.1. Market Analysis, Insights and Forecast - by Application
- 7.1.1. Advertising Media
- 7.1.2. Information Display
- 7.1.3. Sports Arena
- 7.1.4. Traffic and Security
- 7.1.5. Others
- 7.2. Market Analysis, Insights and Forecast - by Types
- 7.2.1. Indoor Display
- 7.2.2. Outdoor Display
- 7.1. Market Analysis, Insights and Forecast - by Application
- 8. Europe High Brightness Display Analysis, Insights and Forecast, 2020-2032
- 8.1. Market Analysis, Insights and Forecast - by Application
- 8.1.1. Advertising Media
- 8.1.2. Information Display
- 8.1.3. Sports Arena
- 8.1.4. Traffic and Security
- 8.1.5. Others
- 8.2. Market Analysis, Insights and Forecast - by Types
- 8.2.1. Indoor Display
- 8.2.2. Outdoor Display
- 8.1. Market Analysis, Insights and Forecast - by Application
- 9. Middle East & Africa High Brightness Display Analysis, Insights and Forecast, 2020-2032
- 9.1. Market Analysis, Insights and Forecast - by Application
- 9.1.1. Advertising Media
- 9.1.2. Information Display
- 9.1.3. Sports Arena
- 9.1.4. Traffic and Security
- 9.1.5. Others
- 9.2. Market Analysis, Insights and Forecast - by Types
- 9.2.1. Indoor Display
- 9.2.2. Outdoor Display
- 9.1. Market Analysis, Insights and Forecast - by Application
- 10. Asia Pacific High Brightness Display Analysis, Insights and Forecast, 2020-2032
- 10.1. Market Analysis, Insights and Forecast - by Application
- 10.1.1. Advertising Media
- 10.1.2. Information Display
- 10.1.3. Sports Arena
- 10.1.4. Traffic and Security
- 10.1.5. Others
- 10.2. Market Analysis, Insights and Forecast - by Types
- 10.2.1. Indoor Display
- 10.2.2. Outdoor Display
- 10.1. Market Analysis, Insights and Forecast - by Application
- 11. Competitive Analysis
- 11.1. Global Market Share Analysis 2025
- 11.2. Company Profiles
- 11.2.1 LG
- 11.2.1.1. Overview
- 11.2.1.2. Products
- 11.2.1.3. SWOT Analysis
- 11.2.1.4. Recent Developments
- 11.2.1.5. Financials (Based on Availability)
- 11.2.2 Samsung
- 11.2.2.1. Overview
- 11.2.2.2. Products
- 11.2.2.3. SWOT Analysis
- 11.2.2.4. Recent Developments
- 11.2.2.5. Financials (Based on Availability)
- 11.2.3 Sony
- 11.2.3.1. Overview
- 11.2.3.2. Products
- 11.2.3.3. SWOT Analysis
- 11.2.3.4. Recent Developments
- 11.2.3.5. Financials (Based on Availability)
- 11.2.4 Panasonic
- 11.2.4.1. Overview
- 11.2.4.2. Products
- 11.2.4.3. SWOT Analysis
- 11.2.4.4. Recent Developments
- 11.2.4.5. Financials (Based on Availability)
- 11.2.5 Sharp
- 11.2.5.1. Overview
- 11.2.5.2. Products
- 11.2.5.3. SWOT Analysis
- 11.2.5.4. Recent Developments
- 11.2.5.5. Financials (Based on Availability)
- 11.2.6 AU Optronics Corporation
- 11.2.6.1. Overview
- 11.2.6.2. Products
- 11.2.6.3. SWOT Analysis
- 11.2.6.4. Recent Developments
- 11.2.6.5. Financials (Based on Availability)
- 11.2.7 Peerless
- 11.2.7.1. Overview
- 11.2.7.2. Products
- 11.2.7.3. SWOT Analysis
- 11.2.7.4. Recent Developments
- 11.2.7.5. Financials (Based on Availability)
- 11.2.8 TVC
- 11.2.8.1. Overview
- 11.2.8.2. Products
- 11.2.8.3. SWOT Analysis
- 11.2.8.4. Recent Developments
- 11.2.8.5. Financials (Based on Availability)
- 11.2.9 Teksmart
- 11.2.9.1. Overview
- 11.2.9.2. Products
- 11.2.9.3. SWOT Analysis
- 11.2.9.4. Recent Developments
- 11.2.9.5. Financials (Based on Availability)
- 11.2.10 BOE Technology Group
- 11.2.10.1. Overview
- 11.2.10.2. Products
- 11.2.10.3. SWOT Analysis
- 11.2.10.4. Recent Developments
- 11.2.10.5. Financials (Based on Availability)
- 11.2.11 Planar
- 11.2.11.1. Overview
- 11.2.11.2. Products
- 11.2.11.3. SWOT Analysis
- 11.2.11.4. Recent Developments
- 11.2.11.5. Financials (Based on Availability)
- 11.2.12 DynaScan
- 11.2.12.1. Overview
- 11.2.12.2. Products
- 11.2.12.3. SWOT Analysis
- 11.2.12.4. Recent Developments
- 11.2.12.5. Financials (Based on Availability)
- 11.2.13 Innolux Corporation
- 11.2.13.1. Overview
- 11.2.13.2. Products
- 11.2.13.3. SWOT Analysis
- 11.2.13.4. Recent Developments
- 11.2.13.5. Financials (Based on Availability)
- 11.2.14 Tianma Microelectronics Co.
- 11.2.14.1. Overview
- 11.2.14.2. Products
- 11.2.14.3. SWOT Analysis
- 11.2.14.4. Recent Developments
- 11.2.14.5. Financials (Based on Availability)
- 11.2.15 Ltd.
- 11.2.15.1. Overview
- 11.2.15.2. Products
- 11.2.15.3. SWOT Analysis
- 11.2.15.4. Recent Developments
- 11.2.15.5. Financials (Based on Availability)
- 11.2.16 Display Innovations
- 11.2.16.1. Overview
- 11.2.16.2. Products
- 11.2.16.3. SWOT Analysis
- 11.2.16.4. Recent Developments
- 11.2.16.5. Financials (Based on Availability)
- 11.2.17 Iiyama
- 11.2.17.1. Overview
- 11.2.17.2. Products
- 11.2.17.3. SWOT Analysis
- 11.2.17.4. Recent Developments
- 11.2.17.5. Financials (Based on Availability)
- 11.2.18 Allsee Technologies
- 11.2.18.1. Overview
- 11.2.18.2. Products
- 11.2.18.3. SWOT Analysis
- 11.2.18.4. Recent Developments
- 11.2.18.5. Financials (Based on Availability)
- 11.2.19 Mid West
- 11.2.19.1. Overview
- 11.2.19.2. Products
- 11.2.19.3. SWOT Analysis
- 11.2.19.4. Recent Developments
- 11.2.19.5. Financials (Based on Availability)
- 11.2.20 Crystal Display Systems
- 11.2.20.1. Overview
- 11.2.20.2. Products
- 11.2.20.3. SWOT Analysis
- 11.2.20.4. Recent Developments
- 11.2.20.5. Financials (Based on Availability)
- 11.2.21 Hisense
- 11.2.21.1. Overview
- 11.2.21.2. Products
- 11.2.21.3. SWOT Analysis
- 11.2.21.4. Recent Developments
- 11.2.21.5. Financials (Based on Availability)
- 11.2.22 WINSTAR
- 11.2.22.1. Overview
- 11.2.22.2. Products
- 11.2.22.3. SWOT Analysis
- 11.2.22.4. Recent Developments
- 11.2.22.5. Financials (Based on Availability)
- 11.2.23 Himax Technologies
- 11.2.23.1. Overview
- 11.2.23.2. Products
- 11.2.23.3. SWOT Analysis
- 11.2.23.4. Recent Developments
- 11.2.23.5. Financials (Based on Availability)
- 11.2.24 Lilliput
- 11.2.24.1. Overview
- 11.2.24.2. Products
- 11.2.24.3. SWOT Analysis
- 11.2.24.4. Recent Developments
- 11.2.24.5. Financials (Based on Availability)
- 11.2.25 LifeSize Touch
- 11.2.25.1. Overview
- 11.2.25.2. Products
- 11.2.25.3. SWOT Analysis
- 11.2.25.4. Recent Developments
- 11.2.25.5. Financials (Based on Availability)
- 11.2.26 Winmate
- 11.2.26.1. Overview
- 11.2.26.2. Products
- 11.2.26.3. SWOT Analysis
- 11.2.26.4. Recent Developments
- 11.2.26.5. Financials (Based on Availability)
- 11.2.27 Armagard
- 11.2.27.1. Overview
- 11.2.27.2. Products
- 11.2.27.3. SWOT Analysis
- 11.2.27.4. Recent Developments
- 11.2.27.5. Financials (Based on Availability)
- 11.2.28 Luminati
- 11.2.28.1. Overview
- 11.2.28.2. Products
- 11.2.28.3. SWOT Analysis
- 11.2.28.4. Recent Developments
- 11.2.28.5. Financials (Based on Availability)
- 11.2.29 Litemax
- 11.2.29.1. Overview
- 11.2.29.2. Products
- 11.2.29.3. SWOT Analysis
- 11.2.29.4. Recent Developments
- 11.2.29.5. Financials (Based on Availability)
- 11.2.1 LG
List of Figures
- Figure 1: Global High Brightness Display Revenue Breakdown (undefined, %) by Region 2025 & 2033
- Figure 2: Global High Brightness Display Volume Breakdown (K, %) by Region 2025 & 2033
- Figure 3: North America High Brightness Display Revenue (undefined), by Application 2025 & 2033
- Figure 4: North America High Brightness Display Volume (K), by Application 2025 & 2033
- Figure 5: North America High Brightness Display Revenue Share (%), by Application 2025 & 2033
- Figure 6: North America High Brightness Display Volume Share (%), by Application 2025 & 2033
- Figure 7: North America High Brightness Display Revenue (undefined), by Types 2025 & 2033
- Figure 8: North America High Brightness Display Volume (K), by Types 2025 & 2033
- Figure 9: North America High Brightness Display Revenue Share (%), by Types 2025 & 2033
- Figure 10: North America High Brightness Display Volume Share (%), by Types 2025 & 2033
- Figure 11: North America High Brightness Display Revenue (undefined), by Country 2025 & 2033
- Figure 12: North America High Brightness Display Volume (K), by Country 2025 & 2033
- Figure 13: North America High Brightness Display Revenue Share (%), by Country 2025 & 2033
- Figure 14: North America High Brightness Display Volume Share (%), by Country 2025 & 2033
- Figure 15: South America High Brightness Display Revenue (undefined), by Application 2025 & 2033
- Figure 16: South America High Brightness Display Volume (K), by Application 2025 & 2033
- Figure 17: South America High Brightness Display Revenue Share (%), by Application 2025 & 2033
- Figure 18: South America High Brightness Display Volume Share (%), by Application 2025 & 2033
- Figure 19: South America High Brightness Display Revenue (undefined), by Types 2025 & 2033
- Figure 20: South America High Brightness Display Volume (K), by Types 2025 & 2033
- Figure 21: South America High Brightness Display Revenue Share (%), by Types 2025 & 2033
- Figure 22: South America High Brightness Display Volume Share (%), by Types 2025 & 2033
- Figure 23: South America High Brightness Display Revenue (undefined), by Country 2025 & 2033
- Figure 24: South America High Brightness Display Volume (K), by Country 2025 & 2033
- Figure 25: South America High Brightness Display Revenue Share (%), by Country 2025 & 2033
- Figure 26: South America High Brightness Display Volume Share (%), by Country 2025 & 2033
- Figure 27: Europe High Brightness Display Revenue (undefined), by Application 2025 & 2033
- Figure 28: Europe High Brightness Display Volume (K), by Application 2025 & 2033
- Figure 29: Europe High Brightness Display Revenue Share (%), by Application 2025 & 2033
- Figure 30: Europe High Brightness Display Volume Share (%), by Application 2025 & 2033
- Figure 31: Europe High Brightness Display Revenue (undefined), by Types 2025 & 2033
- Figure 32: Europe High Brightness Display Volume (K), by Types 2025 & 2033
- Figure 33: Europe High Brightness Display Revenue Share (%), by Types 2025 & 2033
- Figure 34: Europe High Brightness Display Volume Share (%), by Types 2025 & 2033
- Figure 35: Europe High Brightness Display Revenue (undefined), by Country 2025 & 2033
- Figure 36: Europe High Brightness Display Volume (K), by Country 2025 & 2033
- Figure 37: Europe High Brightness Display Revenue Share (%), by Country 2025 & 2033
- Figure 38: Europe High Brightness Display Volume Share (%), by Country 2025 & 2033
- Figure 39: Middle East & Africa High Brightness Display Revenue (undefined), by Application 2025 & 2033
- Figure 40: Middle East & Africa High Brightness Display Volume (K), by Application 2025 & 2033
- Figure 41: Middle East & Africa High Brightness Display Revenue Share (%), by Application 2025 & 2033
- Figure 42: Middle East & Africa High Brightness Display Volume Share (%), by Application 2025 & 2033
- Figure 43: Middle East & Africa High Brightness Display Revenue (undefined), by Types 2025 & 2033
- Figure 44: Middle East & Africa High Brightness Display Volume (K), by Types 2025 & 2033
- Figure 45: Middle East & Africa High Brightness Display Revenue Share (%), by Types 2025 & 2033
- Figure 46: Middle East & Africa High Brightness Display Volume Share (%), by Types 2025 & 2033
- Figure 47: Middle East & Africa High Brightness Display Revenue (undefined), by Country 2025 & 2033
- Figure 48: Middle East & Africa High Brightness Display Volume (K), by Country 2025 & 2033
- Figure 49: Middle East & Africa High Brightness Display Revenue Share (%), by Country 2025 & 2033
- Figure 50: Middle East & Africa High Brightness Display Volume Share (%), by Country 2025 & 2033
- Figure 51: Asia Pacific High Brightness Display Revenue (undefined), by Application 2025 & 2033
- Figure 52: Asia Pacific High Brightness Display Volume (K), by Application 2025 & 2033
- Figure 53: Asia Pacific High Brightness Display Revenue Share (%), by Application 2025 & 2033
- Figure 54: Asia Pacific High Brightness Display Volume Share (%), by Application 2025 & 2033
- Figure 55: Asia Pacific High Brightness Display Revenue (undefined), by Types 2025 & 2033
- Figure 56: Asia Pacific High Brightness Display Volume (K), by Types 2025 & 2033
- Figure 57: Asia Pacific High Brightness Display Revenue Share (%), by Types 2025 & 2033
- Figure 58: Asia Pacific High Brightness Display Volume Share (%), by Types 2025 & 2033
- Figure 59: Asia Pacific High Brightness Display Revenue (undefined), by Country 2025 & 2033
- Figure 60: Asia Pacific High Brightness Display Volume (K), by Country 2025 & 2033
- Figure 61: Asia Pacific High Brightness Display Revenue Share (%), by Country 2025 & 2033
- Figure 62: Asia Pacific High Brightness Display Volume Share (%), by Country 2025 & 2033
List of Tables
- Table 1: Global High Brightness Display Revenue undefined Forecast, by Application 2020 & 2033
- Table 2: Global High Brightness Display Volume K Forecast, by Application 2020 & 2033
- Table 3: Global High Brightness Display Revenue undefined Forecast, by Types 2020 & 2033
- Table 4: Global High Brightness Display Volume K Forecast, by Types 2020 & 2033
- Table 5: Global High Brightness Display Revenue undefined Forecast, by Region 2020 & 2033
- Table 6: Global High Brightness Display Volume K Forecast, by Region 2020 & 2033
- Table 7: Global High Brightness Display Revenue undefined Forecast, by Application 2020 & 2033
- Table 8: Global High Brightness Display Volume K Forecast, by Application 2020 & 2033
- Table 9: Global High Brightness Display Revenue undefined Forecast, by Types 2020 & 2033
- Table 10: Global High Brightness Display Volume K Forecast, by Types 2020 & 2033
- Table 11: Global High Brightness Display Revenue undefined Forecast, by Country 2020 & 2033
- Table 12: Global High Brightness Display Volume K Forecast, by Country 2020 & 2033
- Table 13: United States High Brightness Display Revenue (undefined) Forecast, by Application 2020 & 2033
- Table 14: United States High Brightness Display Volume (K) Forecast, by Application 2020 & 2033
- Table 15: Canada High Brightness Display Revenue (undefined) Forecast, by Application 2020 & 2033
- Table 16: Canada High Brightness Display Volume (K) Forecast, by Application 2020 & 2033
- Table 17: Mexico High Brightness Display Revenue (undefined) Forecast, by Application 2020 & 2033
- Table 18: Mexico High Brightness Display Volume (K) Forecast, by Application 2020 & 2033
- Table 19: Global High Brightness Display Revenue undefined Forecast, by Application 2020 & 2033
- Table 20: Global High Brightness Display Volume K Forecast, by Application 2020 & 2033
- Table 21: Global High Brightness Display Revenue undefined Forecast, by Types 2020 & 2033
- Table 22: Global High Brightness Display Volume K Forecast, by Types 2020 & 2033
- Table 23: Global High Brightness Display Revenue undefined Forecast, by Country 2020 & 2033
- Table 24: Global High Brightness Display Volume K Forecast, by Country 2020 & 2033
- Table 25: Brazil High Brightness Display Revenue (undefined) Forecast, by Application 2020 & 2033
- Table 26: Brazil High Brightness Display Volume (K) Forecast, by Application 2020 & 2033
- Table 27: Argentina High Brightness Display Revenue (undefined) Forecast, by Application 2020 & 2033
- Table 28: Argentina High Brightness Display Volume (K) Forecast, by Application 2020 & 2033
- Table 29: Rest of South America High Brightness Display Revenue (undefined) Forecast, by Application 2020 & 2033
- Table 30: Rest of South America High Brightness Display Volume (K) Forecast, by Application 2020 & 2033
- Table 31: Global High Brightness Display Revenue undefined Forecast, by Application 2020 & 2033
- Table 32: Global High Brightness Display Volume K Forecast, by Application 2020 & 2033
- Table 33: Global High Brightness Display Revenue undefined Forecast, by Types 2020 & 2033
- Table 34: Global High Brightness Display Volume K Forecast, by Types 2020 & 2033
- Table 35: Global High Brightness Display Revenue undefined Forecast, by Country 2020 & 2033
- Table 36: Global High Brightness Display Volume K Forecast, by Country 2020 & 2033
- Table 37: United Kingdom High Brightness Display Revenue (undefined) Forecast, by Application 2020 & 2033
- Table 38: United Kingdom High Brightness Display Volume (K) Forecast, by Application 2020 & 2033
- Table 39: Germany High Brightness Display Revenue (undefined) Forecast, by Application 2020 & 2033
- Table 40: Germany High Brightness Display Volume (K) Forecast, by Application 2020 & 2033
- Table 41: France High Brightness Display Revenue (undefined) Forecast, by Application 2020 & 2033
- Table 42: France High Brightness Display Volume (K) Forecast, by Application 2020 & 2033
- Table 43: Italy High Brightness Display Revenue (undefined) Forecast, by Application 2020 & 2033
- Table 44: Italy High Brightness Display Volume (K) Forecast, by Application 2020 & 2033
- Table 45: Spain High Brightness Display Revenue (undefined) Forecast, by Application 2020 & 2033
- Table 46: Spain High Brightness Display Volume (K) Forecast, by Application 2020 & 2033
- Table 47: Russia High Brightness Display Revenue (undefined) Forecast, by Application 2020 & 2033
- Table 48: Russia High Brightness Display Volume (K) Forecast, by Application 2020 & 2033
- Table 49: Benelux High Brightness Display Revenue (undefined) Forecast, by Application 2020 & 2033
- Table 50: Benelux High Brightness Display Volume (K) Forecast, by Application 2020 & 2033
- Table 51: Nordics High Brightness Display Revenue (undefined) Forecast, by Application 2020 & 2033
- Table 52: Nordics High Brightness Display Volume (K) Forecast, by Application 2020 & 2033
- Table 53: Rest of Europe High Brightness Display Revenue (undefined) Forecast, by Application 2020 & 2033
- Table 54: Rest of Europe High Brightness Display Volume (K) Forecast, by Application 2020 & 2033
- Table 55: Global High Brightness Display Revenue undefined Forecast, by Application 2020 & 2033
- Table 56: Global High Brightness Display Volume K Forecast, by Application 2020 & 2033
- Table 57: Global High Brightness Display Revenue undefined Forecast, by Types 2020 & 2033
- Table 58: Global High Brightness Display Volume K Forecast, by Types 2020 & 2033
- Table 59: Global High Brightness Display Revenue undefined Forecast, by Country 2020 & 2033
- Table 60: Global High Brightness Display Volume K Forecast, by Country 2020 & 2033
- Table 61: Turkey High Brightness Display Revenue (undefined) Forecast, by Application 2020 & 2033
- Table 62: Turkey High Brightness Display Volume (K) Forecast, by Application 2020 & 2033
- Table 63: Israel High Brightness Display Revenue (undefined) Forecast, by Application 2020 & 2033
- Table 64: Israel High Brightness Display Volume (K) Forecast, by Application 2020 & 2033
- Table 65: GCC High Brightness Display Revenue (undefined) Forecast, by Application 2020 & 2033
- Table 66: GCC High Brightness Display Volume (K) Forecast, by Application 2020 & 2033
- Table 67: North Africa High Brightness Display Revenue (undefined) Forecast, by Application 2020 & 2033
- Table 68: North Africa High Brightness Display Volume (K) Forecast, by Application 2020 & 2033
- Table 69: South Africa High Brightness Display Revenue (undefined) Forecast, by Application 2020 & 2033
- Table 70: South Africa High Brightness Display Volume (K) Forecast, by Application 2020 & 2033
- Table 71: Rest of Middle East & Africa High Brightness Display Revenue (undefined) Forecast, by Application 2020 & 2033
- Table 72: Rest of Middle East & Africa High Brightness Display Volume (K) Forecast, by Application 2020 & 2033
- Table 73: Global High Brightness Display Revenue undefined Forecast, by Application 2020 & 2033
- Table 74: Global High Brightness Display Volume K Forecast, by Application 2020 & 2033
- Table 75: Global High Brightness Display Revenue undefined Forecast, by Types 2020 & 2033
- Table 76: Global High Brightness Display Volume K Forecast, by Types 2020 & 2033
- Table 77: Global High Brightness Display Revenue undefined Forecast, by Country 2020 & 2033
- Table 78: Global High Brightness Display Volume K Forecast, by Country 2020 & 2033
- Table 79: China High Brightness Display Revenue (undefined) Forecast, by Application 2020 & 2033
- Table 80: China High Brightness Display Volume (K) Forecast, by Application 2020 & 2033
- Table 81: India High Brightness Display Revenue (undefined) Forecast, by Application 2020 & 2033
- Table 82: India High Brightness Display Volume (K) Forecast, by Application 2020 & 2033
- Table 83: Japan High Brightness Display Revenue (undefined) Forecast, by Application 2020 & 2033
- Table 84: Japan High Brightness Display Volume (K) Forecast, by Application 2020 & 2033
- Table 85: South Korea High Brightness Display Revenue (undefined) Forecast, by Application 2020 & 2033
- Table 86: South Korea High Brightness Display Volume (K) Forecast, by Application 2020 & 2033
- Table 87: ASEAN High Brightness Display Revenue (undefined) Forecast, by Application 2020 & 2033
- Table 88: ASEAN High Brightness Display Volume (K) Forecast, by Application 2020 & 2033
- Table 89: Oceania High Brightness Display Revenue (undefined) Forecast, by Application 2020 & 2033
- Table 90: Oceania High Brightness Display Volume (K) Forecast, by Application 2020 & 2033
- Table 91: Rest of Asia Pacific High Brightness Display Revenue (undefined) Forecast, by Application 2020 & 2033
- Table 92: Rest of Asia Pacific High Brightness Display Volume (K) Forecast, by Application 2020 & 2033
Frequently Asked Questions
1. What is the projected Compound Annual Growth Rate (CAGR) of the High Brightness Display?
The projected CAGR is approximately 30.3%.
2. Which companies are prominent players in the High Brightness Display?
Key companies in the market include LG, Samsung, Sony, Panasonic, Sharp, AU Optronics Corporation, Peerless, TVC, Teksmart, BOE Technology Group, Planar, DynaScan, Innolux Corporation, Tianma Microelectronics Co., Ltd., Display Innovations, Iiyama, Allsee Technologies, Mid West, Crystal Display Systems, Hisense, WINSTAR, Himax Technologies, Lilliput, LifeSize Touch, Winmate, Armagard, Luminati, Litemax.
3. What are the main segments of the High Brightness Display?
The market segments include Application, Types.
4. Can you provide details about the market size?
The market size is estimated to be USD XXX N/A as of 2022.
5. What are some drivers contributing to market growth?
N/A
6. What are the notable trends driving market growth?
N/A
7. Are there any restraints impacting market growth?
N/A
8. Can you provide examples of recent developments in the market?
N/A
9. What pricing options are available for accessing the report?
Pricing options include single-user, multi-user, and enterprise licenses priced at USD 4350.00, USD 6525.00, and USD 8700.00 respectively.
10. Is the market size provided in terms of value or volume?
The market size is provided in terms of value, measured in N/A and volume, measured in K.
11. Are there any specific market keywords associated with the report?
Yes, the market keyword associated with the report is "High Brightness Display," which aids in identifying and referencing the specific market segment covered.
12. How do I determine which pricing option suits my needs best?
The pricing options vary based on user requirements and access needs. Individual users may opt for single-user licenses, while businesses requiring broader access may choose multi-user or enterprise licenses for cost-effective access to the report.
13. Are there any additional resources or data provided in the High Brightness Display report?
While the report offers comprehensive insights, it's advisable to review the specific contents or supplementary materials provided to ascertain if additional resources or data are available.
14. How can I stay updated on further developments or reports in the High Brightness Display?
To stay informed about further developments, trends, and reports in the High Brightness Display, consider subscribing to industry newsletters, following relevant companies and organizations, or regularly checking reputable industry news sources and publications.
Methodology
Step 1 - Identification of Relevant Samples Size from Population Database


Step 2 - Approaches for Defining Global Market Size (Value, Volume* & Price*)

Note*: In applicable scenarios
Step 3 - Data Sources
Primary Research
- Web Analytics
- Survey Reports
- Research Institute
- Latest Research Reports
- Opinion Leaders
Secondary Research
- Annual Reports
- White Paper
- Latest Press Release
- Industry Association
- Paid Database
- Investor Presentations

Step 4 - Data Triangulation
Involves using different sources of information in order to increase the validity of a study
These sources are likely to be stakeholders in a program - participants, other researchers, program staff, other community members, and so on.
Then we put all data in single framework & apply various statistical tools to find out the dynamic on the market.
During the analysis stage, feedback from the stakeholder groups would be compared to determine areas of agreement as well as areas of divergence