
Key Insights
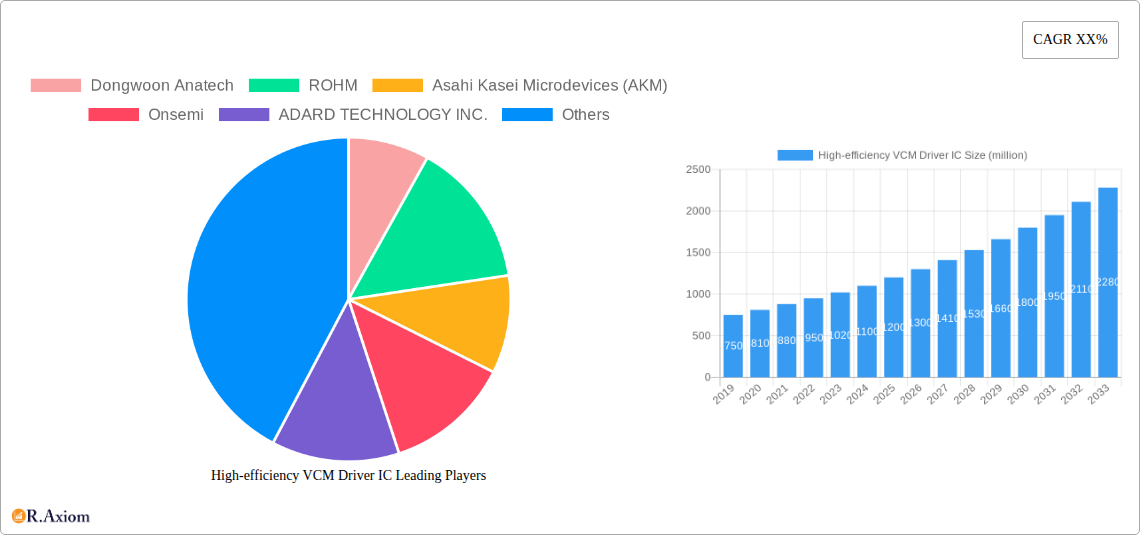
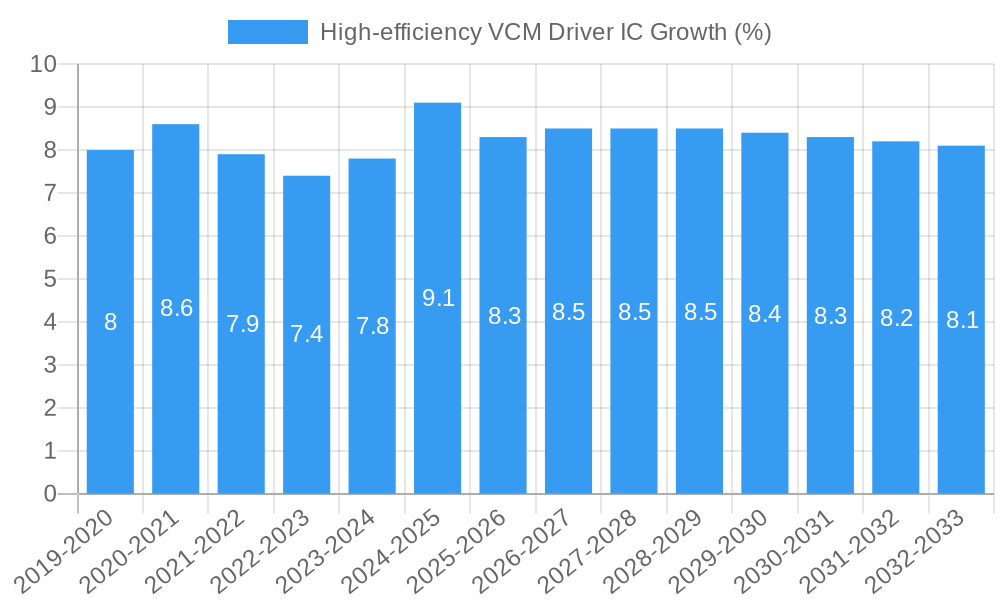
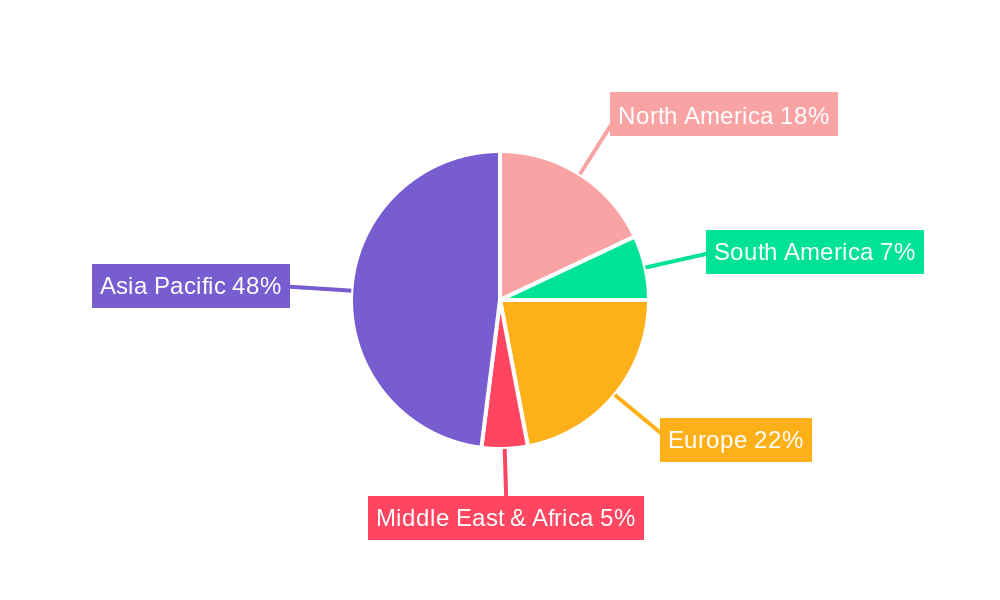
The global High-efficiency VCM Driver IC market is poised for substantial growth, projected to reach an estimated market size of approximately $1,200 million by 2025, with an anticipated Compound Annual Growth Rate (CAGR) of around 8.5% through 2033. This robust expansion is primarily fueled by the escalating demand for advanced smartphone cameras and the continuous integration of sophisticated imaging technologies across a wide range of electronic devices. The growing preference for higher resolution, superior image stabilization, and enhanced autofocus capabilities in consumer electronics directly translates into an increased need for high-efficiency VCM Driver ICs that can deliver precise and responsive performance. Furthermore, the burgeoning adoption of these ICs in automotive applications, such as advanced driver-assistance systems (ADAS) for adaptive headlights and surround-view cameras, is a significant growth driver. Emerging markets in Asia Pacific, particularly China and India, are expected to contribute significantly to this growth due to their large consumer bases and rapid technological adoption.
The market is characterized by a dynamic interplay of innovation and evolving consumer expectations. Key trends shaping the High-efficiency VCM Driver IC landscape include the development of smaller, more power-efficient driver ICs to accommodate increasingly compact device designs, and the rise of optical image stabilization (OIS) VCM Driver ICs offering enhanced camera performance in low-light conditions. The increasing complexity of camera modules also drives demand for integrated solutions. However, the market faces certain restraints, including the high research and development costs associated with cutting-edge technologies and the potential for supply chain disruptions. Intense competition among established players like Dongwoon Anatech, ROHM, and Asahi Kasei Microdevices (AKM), alongside emerging players, is fostering innovation and driving down costs, which is a positive for end-users. The market segmentation by application reveals a strong dominance of iOS and Android systems, reflecting the widespread use of these operating systems in smartphones and tablets.
This in-depth report provides a detailed examination of the global High-efficiency VCM Driver IC market. Spanning the historical period of 2019-2024, the base year of 2025, and a comprehensive forecast period extending to 2033, this analysis offers critical insights into market dynamics, technological advancements, and growth opportunities within this rapidly evolving sector. The report is designed for industry stakeholders, including manufacturers, technology providers, investors, and market analysts seeking actionable intelligence to navigate and capitalize on the high-efficiency VCM driver IC landscape. We cover key segments such as IOS System, Android System, and Other System applications, and Open-Loop VCM Driver IC, Closed-Loop VCM Driver IC, and Optical Anti-Shake (OIS) VCM Driver IC types.
High-efficiency VCM Driver IC Market Concentration & Innovation
The High-efficiency VCM Driver IC market exhibits a moderate concentration, with key players like Dongwoon Anatech, ROHM, Asahi Kasei Microdevices (AKM), Onsemi, ADARD TECHNOLOGY INC., Giantec Semiconductor Corporation, and Zinitix holding significant market shares. Innovation is a primary driver, fueled by the relentless demand for improved camera performance in smartphones and other portable electronic devices. Advancements in miniaturization, power efficiency, and enhanced autofocus speed are crucial differentiators. Regulatory frameworks, while generally supportive of technological progress, can influence product development cycles and material sourcing. The emergence of advanced camera technologies, such as periscope lenses and larger sensor sizes, directly impacts VCM driver IC requirements, pushing for higher precision and efficiency. Product substitutes, while existing in simpler autofocus mechanisms, are largely outpaced by the performance gains offered by VCM-based solutions. End-user trends strongly favor sophisticated imaging capabilities, leading to a consistent demand for cutting-edge VCM driver ICs. Mergers and acquisitions (M&A) are likely to play a role in market consolidation, with potential deal values estimated in the hundreds of millions, as companies seek to gain economies of scale and expand their technological portfolios. The market share of leading companies is estimated to range from 10% to 25% individually.
High-efficiency VCM Driver IC Industry Trends & Insights
The High-efficiency VCM Driver IC industry is experiencing robust growth, driven by several interconnected trends. The insatiable consumer demand for superior smartphone camera quality is the paramount growth driver. As mobile photography becomes increasingly sophisticated, with features like advanced zoom capabilities, AI-powered image processing, and enhanced low-light performance, the need for precise and efficient Voice Coil Motor (VCM) driver ICs intensifies. This translates to higher resolution sensors, larger apertures, and more complex optical stabilization systems, all of which necessitate advanced VCM control. Technological disruptions are a constant factor, with ongoing research and development focused on improving power efficiency, reducing latency, and enabling faster, more accurate autofocus. Innovations in semiconductor manufacturing processes and materials are enabling smaller, more powerful VCM driver ICs that consume less energy, a critical factor for battery-powered devices. Consumer preferences are evolving rapidly, with a strong emphasis on capturing professional-grade photos and videos on mobile devices. This trend fuels the demand for VCM driver ICs that can support advanced features like optical image stabilization (OIS), high-speed autofocus, and smooth zoom transitions. The competitive landscape is dynamic, characterized by intense innovation and strategic partnerships. Companies are differentiating themselves through proprietary technologies, superior performance metrics, and comprehensive product portfolios. The market penetration of high-efficiency VCM driver ICs in premium and mid-range smartphones is already substantial, and this trend is expected to continue as the technology becomes more cost-effective and integrated into a wider range of devices. The Compound Annual Growth Rate (CAGR) for the High-efficiency VCM Driver IC market is projected to be between 15% and 20% over the forecast period. The market size is estimated to reach several billion dollars by 2033.
Dominant Markets & Segments in High-efficiency VCM Driver IC
The dominance in the High-efficiency VCM Driver IC market is clearly shaped by the application landscape, with the Android System segment holding a commanding position. The sheer volume of Android devices manufactured globally, spanning from entry-level to high-end smartphones, tablets, and even smart cameras, creates a vast demand for VCM driver ICs. Economic policies in major manufacturing hubs like China, coupled with robust infrastructure for semiconductor production and assembly, further bolster this dominance. The growth drivers within the Android segment are diverse, including the rapid adoption of advanced camera features in mid-range devices, increasing smartphone replacement cycles, and the expansion of the Android ecosystem into emerging markets.
Within the Types segmentation, the Closed-Loop VCM Driver IC segment is experiencing significant growth and is poised for dominance. This is attributed to its superior performance in terms of accuracy and stability, crucial for advanced autofocus and OIS functionalities. The increasing integration of OIS in a wider array of smartphones, driven by consumer preference for blur-free images and stable video recording, directly fuels the demand for closed-loop solutions. While Open-Loop VCM Driver ICs still hold a significant market share due to their cost-effectiveness in certain applications, the trend is leaning towards the precision and reliability offered by closed-loop systems.
The IOS System segment, while smaller in terms of device volume compared to Android, represents a high-value market for VCM driver ICs. Apple's consistent focus on premium camera experiences and its premium pricing strategy ensure a strong demand for the most advanced and efficient VCM driver ICs. The technological innovation within iOS devices often sets benchmarks for the broader market, driving demand for cutting-edge solutions.
The Other System segment, encompassing applications beyond smartphones such as digital cameras, automotive camera systems, and drones, also contributes to the overall market growth. As these sectors increasingly adopt sophisticated imaging technologies, the demand for high-efficiency VCM driver ICs is expected to rise.
Key drivers for dominance in these segments include:
- Economic Policies: Favorable manufacturing incentives and trade agreements in key regions.
- Infrastructure Development: Advanced semiconductor fabrication facilities and robust supply chains.
- Consumer Preferences: Growing demand for high-quality imaging in mobile devices and other electronics.
- Technological Advancements: Continuous innovation in autofocus and image stabilization technologies.
- Market Penetration: Increasing adoption of VCM driver ICs in mid-range and budget-friendly devices.
High-efficiency VCM Driver IC Product Developments
Recent product developments in High-efficiency VCM Driver ICs are characterized by a relentless pursuit of enhanced power efficiency, reduced form factors, and improved control algorithms. Manufacturers are introducing ICs with lower quiescent current and optimized power management capabilities to extend battery life in mobile devices. Furthermore, advancements in integration are leading to smaller package sizes, enabling sleeker device designs. Competitive advantages are being forged through features like advanced diagnostics, robust noise immunity, and seamless integration with image signal processors (ISPs). These innovations are directly addressing the market's need for more sophisticated camera modules that deliver faster, more accurate, and power-efficient autofocus and optical image stabilization.
Report Scope & Segmentation Analysis
This report meticulously segments the High-efficiency VCM Driver IC market across key Application and Type categories.
Application Segments:
- IOS System: This segment caters to the premium smartphone market, demanding the highest levels of performance and efficiency. Growth projections are strong, driven by Apple's continuous innovation cycle.
- Android System: The largest segment by volume, encompassing a vast array of smartphones and other devices. Robust growth is anticipated due to the widespread adoption of VCM technology across all price points.
- Other System: This segment includes a diverse range of applications such as digital cameras, automotive cameras, and drones, offering significant growth potential as these sectors embrace advanced imaging.
Type Segments:
- Open-Loop VCM Driver IC: This segment represents a cost-effective solution for less demanding applications, though its market share is expected to gradually decrease as advanced features become mainstream.
- Closed-Loop VCM Driver IC: This segment is projected for substantial growth, driven by the increasing demand for precise and stable autofocus and OIS, crucial for high-end mobile photography.
- Optical Anti-Shake (OIS) VCM Driver IC: This specialized segment is experiencing rapid expansion as OIS becomes a standard feature in smartphones, leading to significant market share gains.
Key Drivers of High-efficiency VCM Driver IC Growth
The growth of the High-efficiency VCM Driver IC market is primarily propelled by technological advancements in smartphone camera systems, including higher resolution sensors and advanced optics. The escalating consumer demand for superior mobile photography and videography experiences acts as a significant catalyst. Furthermore, the increasing integration of Optical Image Stabilization (OIS) across a wider range of mobile devices directly fuels the demand for specialized OIS VCM driver ICs. Economic factors such as rising disposable incomes in emerging markets, leading to increased smartphone adoption, also contribute to market expansion. Regulatory support for technological innovation and efficiency standards further encourages the development and adoption of high-efficiency solutions.
Challenges in the High-efficiency VCM Driver IC Sector
Despite robust growth, the High-efficiency VCM Driver IC sector faces several challenges. Intense price competition among manufacturers, particularly in the high-volume Android segment, can squeeze profit margins. Supply chain disruptions, exacerbated by global geopolitical events and semiconductor shortages, can lead to production delays and increased costs. Evolving technological standards and the need for continuous R&D to keep pace with rapid advancements in camera technology require substantial investment. Furthermore, stringent quality control and reliability requirements for use in consumer electronics present a constant challenge.
Emerging Opportunities in High-efficiency VCM Driver IC
Emerging opportunities within the High-efficiency VCM Driver IC market are abundant. The expansion of the automotive camera market, driven by advancements in autonomous driving and advanced driver-assistance systems (ADAS), presents a significant growth avenue. The increasing popularity of foldable smartphones and other novel form factors creates a demand for compact and highly integrated VCM driver solutions. Furthermore, the growing adoption of high-efficiency VCM driver ICs in emerging IoT devices and smart home applications, such as smart doorbells and surveillance cameras, offers untapped potential. The continuous drive towards miniaturization and enhanced power efficiency in all electronic devices will continue to spur innovation and create new market niches.
Leading Players in the High-efficiency VCM Driver IC Market
- Dongwoon Anatech
- ROHM
- Asahi Kasei Microdevices (AKM)
- Onsemi
- ADARD TECHNOLOGY INC.
- Giantec Semiconductor Corporation
- Zinitix
Key Developments in High-efficiency VCM Driver IC Industry
- 2023: Launch of next-generation VCM driver ICs with enhanced power efficiency and reduced latency by leading manufacturers.
- 2022: Increased adoption of closed-loop VCM driver ICs in flagship smartphones for superior autofocus performance.
- 2021: Advancements in miniaturization leading to smaller footprint VCM driver ICs, enabling sleeker smartphone designs.
- 2020: Growing focus on integrated solutions combining VCM drivers with OIS control for enhanced camera module functionality.
- 2019: Introduction of AI-enabled autofocus algorithms impacting VCM driver IC performance requirements.
Strategic Outlook for High-efficiency VCM Driver IC Market
The strategic outlook for the High-efficiency VCM Driver IC market remains exceptionally positive. Continued innovation in camera technology, driven by consumer demand for professional-grade mobile photography, will sustain robust growth. The increasing adoption of advanced features like OIS and sophisticated autofocus systems across all smartphone segments, including mid-range devices, presents a significant expansion opportunity. Furthermore, the burgeoning automotive camera market and the integration of VCM driver ICs into emerging IoT applications are poised to diversify and amplify market demand. Companies that can offer highly integrated, power-efficient, and cost-competitive solutions will be well-positioned to capitalize on this dynamic and growing market.
High-efficiency VCM Driver IC Segmentation
-
1. Application
- 1.1. IOS System
- 1.2. Android System
- 1.3. Other System
-
2. Types
- 2.1. Open-Loop VCM Driver IC
- 2.2. Closed-Loop VCM Driver IC
- 2.3. Optical Anti-Shake (OIS) VCM Driver IC
High-efficiency VCM Driver IC Segmentation By Geography
-
1. North America
- 1.1. United States
- 1.2. Canada
- 1.3. Mexico
-
2. South America
- 2.1. Brazil
- 2.2. Argentina
- 2.3. Rest of South America
-
3. Europe
- 3.1. United Kingdom
- 3.2. Germany
- 3.3. France
- 3.4. Italy
- 3.5. Spain
- 3.6. Russia
- 3.7. Benelux
- 3.8. Nordics
- 3.9. Rest of Europe
-
4. Middle East & Africa
- 4.1. Turkey
- 4.2. Israel
- 4.3. GCC
- 4.4. North Africa
- 4.5. South Africa
- 4.6. Rest of Middle East & Africa
-
5. Asia Pacific
- 5.1. China
- 5.2. India
- 5.3. Japan
- 5.4. South Korea
- 5.5. ASEAN
- 5.6. Oceania
- 5.7. Rest of Asia Pacific
High-efficiency VCM Driver IC REPORT HIGHLIGHTS
| Aspects | Details |
|---|---|
| Study Period | 2019-2033 |
| Base Year | 2024 |
| Estimated Year | 2025 |
| Forecast Period | 2025-2033 |
| Historical Period | 2019-2024 |
| Growth Rate | CAGR of XX% from 2019-2033 |
| Segmentation |
|
Table of Contents
- 1. Introduction
- 1.1. Research Scope
- 1.2. Market Segmentation
- 1.3. Research Methodology
- 1.4. Definitions and Assumptions
- 2. Executive Summary
- 2.1. Introduction
- 3. Market Dynamics
- 3.1. Introduction
- 3.2. Market Drivers
- 3.3. Market Restrains
- 3.4. Market Trends
- 4. Market Factor Analysis
- 4.1. Porters Five Forces
- 4.2. Supply/Value Chain
- 4.3. PESTEL analysis
- 4.4. Market Entropy
- 4.5. Patent/Trademark Analysis
- 5. Global High-efficiency VCM Driver IC Analysis, Insights and Forecast, 2019-2031
- 5.1. Market Analysis, Insights and Forecast - by Application
- 5.1.1. IOS System
- 5.1.2. Android System
- 5.1.3. Other System
- 5.2. Market Analysis, Insights and Forecast - by Types
- 5.2.1. Open-Loop VCM Driver IC
- 5.2.2. Closed-Loop VCM Driver IC
- 5.2.3. Optical Anti-Shake (OIS) VCM Driver IC
- 5.3. Market Analysis, Insights and Forecast - by Region
- 5.3.1. North America
- 5.3.2. South America
- 5.3.3. Europe
- 5.3.4. Middle East & Africa
- 5.3.5. Asia Pacific
- 5.1. Market Analysis, Insights and Forecast - by Application
- 6. North America High-efficiency VCM Driver IC Analysis, Insights and Forecast, 2019-2031
- 6.1. Market Analysis, Insights and Forecast - by Application
- 6.1.1. IOS System
- 6.1.2. Android System
- 6.1.3. Other System
- 6.2. Market Analysis, Insights and Forecast - by Types
- 6.2.1. Open-Loop VCM Driver IC
- 6.2.2. Closed-Loop VCM Driver IC
- 6.2.3. Optical Anti-Shake (OIS) VCM Driver IC
- 6.1. Market Analysis, Insights and Forecast - by Application
- 7. South America High-efficiency VCM Driver IC Analysis, Insights and Forecast, 2019-2031
- 7.1. Market Analysis, Insights and Forecast - by Application
- 7.1.1. IOS System
- 7.1.2. Android System
- 7.1.3. Other System
- 7.2. Market Analysis, Insights and Forecast - by Types
- 7.2.1. Open-Loop VCM Driver IC
- 7.2.2. Closed-Loop VCM Driver IC
- 7.2.3. Optical Anti-Shake (OIS) VCM Driver IC
- 7.1. Market Analysis, Insights and Forecast - by Application
- 8. Europe High-efficiency VCM Driver IC Analysis, Insights and Forecast, 2019-2031
- 8.1. Market Analysis, Insights and Forecast - by Application
- 8.1.1. IOS System
- 8.1.2. Android System
- 8.1.3. Other System
- 8.2. Market Analysis, Insights and Forecast - by Types
- 8.2.1. Open-Loop VCM Driver IC
- 8.2.2. Closed-Loop VCM Driver IC
- 8.2.3. Optical Anti-Shake (OIS) VCM Driver IC
- 8.1. Market Analysis, Insights and Forecast - by Application
- 9. Middle East & Africa High-efficiency VCM Driver IC Analysis, Insights and Forecast, 2019-2031
- 9.1. Market Analysis, Insights and Forecast - by Application
- 9.1.1. IOS System
- 9.1.2. Android System
- 9.1.3. Other System
- 9.2. Market Analysis, Insights and Forecast - by Types
- 9.2.1. Open-Loop VCM Driver IC
- 9.2.2. Closed-Loop VCM Driver IC
- 9.2.3. Optical Anti-Shake (OIS) VCM Driver IC
- 9.1. Market Analysis, Insights and Forecast - by Application
- 10. Asia Pacific High-efficiency VCM Driver IC Analysis, Insights and Forecast, 2019-2031
- 10.1. Market Analysis, Insights and Forecast - by Application
- 10.1.1. IOS System
- 10.1.2. Android System
- 10.1.3. Other System
- 10.2. Market Analysis, Insights and Forecast - by Types
- 10.2.1. Open-Loop VCM Driver IC
- 10.2.2. Closed-Loop VCM Driver IC
- 10.2.3. Optical Anti-Shake (OIS) VCM Driver IC
- 10.1. Market Analysis, Insights and Forecast - by Application
- 11. Competitive Analysis
- 11.1. Global Market Share Analysis 2024
- 11.2. Company Profiles
- 11.2.1 Dongwoon Anatech
- 11.2.1.1. Overview
- 11.2.1.2. Products
- 11.2.1.3. SWOT Analysis
- 11.2.1.4. Recent Developments
- 11.2.1.5. Financials (Based on Availability)
- 11.2.2 ROHM
- 11.2.2.1. Overview
- 11.2.2.2. Products
- 11.2.2.3. SWOT Analysis
- 11.2.2.4. Recent Developments
- 11.2.2.5. Financials (Based on Availability)
- 11.2.3 Asahi Kasei Microdevices (AKM)
- 11.2.3.1. Overview
- 11.2.3.2. Products
- 11.2.3.3. SWOT Analysis
- 11.2.3.4. Recent Developments
- 11.2.3.5. Financials (Based on Availability)
- 11.2.4 Onsemi
- 11.2.4.1. Overview
- 11.2.4.2. Products
- 11.2.4.3. SWOT Analysis
- 11.2.4.4. Recent Developments
- 11.2.4.5. Financials (Based on Availability)
- 11.2.5 ADARD TECHNOLOGY INC.
- 11.2.5.1. Overview
- 11.2.5.2. Products
- 11.2.5.3. SWOT Analysis
- 11.2.5.4. Recent Developments
- 11.2.5.5. Financials (Based on Availability)
- 11.2.6 Giantec Semiconductor Corporation
- 11.2.6.1. Overview
- 11.2.6.2. Products
- 11.2.6.3. SWOT Analysis
- 11.2.6.4. Recent Developments
- 11.2.6.5. Financials (Based on Availability)
- 11.2.7 Zinitix
- 11.2.7.1. Overview
- 11.2.7.2. Products
- 11.2.7.3. SWOT Analysis
- 11.2.7.4. Recent Developments
- 11.2.7.5. Financials (Based on Availability)
- 11.2.1 Dongwoon Anatech
List of Figures
- Figure 1: Global High-efficiency VCM Driver IC Revenue Breakdown (million, %) by Region 2024 & 2032
- Figure 2: Global High-efficiency VCM Driver IC Volume Breakdown (K, %) by Region 2024 & 2032
- Figure 3: North America High-efficiency VCM Driver IC Revenue (million), by Application 2024 & 2032
- Figure 4: North America High-efficiency VCM Driver IC Volume (K), by Application 2024 & 2032
- Figure 5: North America High-efficiency VCM Driver IC Revenue Share (%), by Application 2024 & 2032
- Figure 6: North America High-efficiency VCM Driver IC Volume Share (%), by Application 2024 & 2032
- Figure 7: North America High-efficiency VCM Driver IC Revenue (million), by Types 2024 & 2032
- Figure 8: North America High-efficiency VCM Driver IC Volume (K), by Types 2024 & 2032
- Figure 9: North America High-efficiency VCM Driver IC Revenue Share (%), by Types 2024 & 2032
- Figure 10: North America High-efficiency VCM Driver IC Volume Share (%), by Types 2024 & 2032
- Figure 11: North America High-efficiency VCM Driver IC Revenue (million), by Country 2024 & 2032
- Figure 12: North America High-efficiency VCM Driver IC Volume (K), by Country 2024 & 2032
- Figure 13: North America High-efficiency VCM Driver IC Revenue Share (%), by Country 2024 & 2032
- Figure 14: North America High-efficiency VCM Driver IC Volume Share (%), by Country 2024 & 2032
- Figure 15: South America High-efficiency VCM Driver IC Revenue (million), by Application 2024 & 2032
- Figure 16: South America High-efficiency VCM Driver IC Volume (K), by Application 2024 & 2032
- Figure 17: South America High-efficiency VCM Driver IC Revenue Share (%), by Application 2024 & 2032
- Figure 18: South America High-efficiency VCM Driver IC Volume Share (%), by Application 2024 & 2032
- Figure 19: South America High-efficiency VCM Driver IC Revenue (million), by Types 2024 & 2032
- Figure 20: South America High-efficiency VCM Driver IC Volume (K), by Types 2024 & 2032
- Figure 21: South America High-efficiency VCM Driver IC Revenue Share (%), by Types 2024 & 2032
- Figure 22: South America High-efficiency VCM Driver IC Volume Share (%), by Types 2024 & 2032
- Figure 23: South America High-efficiency VCM Driver IC Revenue (million), by Country 2024 & 2032
- Figure 24: South America High-efficiency VCM Driver IC Volume (K), by Country 2024 & 2032
- Figure 25: South America High-efficiency VCM Driver IC Revenue Share (%), by Country 2024 & 2032
- Figure 26: South America High-efficiency VCM Driver IC Volume Share (%), by Country 2024 & 2032
- Figure 27: Europe High-efficiency VCM Driver IC Revenue (million), by Application 2024 & 2032
- Figure 28: Europe High-efficiency VCM Driver IC Volume (K), by Application 2024 & 2032
- Figure 29: Europe High-efficiency VCM Driver IC Revenue Share (%), by Application 2024 & 2032
- Figure 30: Europe High-efficiency VCM Driver IC Volume Share (%), by Application 2024 & 2032
- Figure 31: Europe High-efficiency VCM Driver IC Revenue (million), by Types 2024 & 2032
- Figure 32: Europe High-efficiency VCM Driver IC Volume (K), by Types 2024 & 2032
- Figure 33: Europe High-efficiency VCM Driver IC Revenue Share (%), by Types 2024 & 2032
- Figure 34: Europe High-efficiency VCM Driver IC Volume Share (%), by Types 2024 & 2032
- Figure 35: Europe High-efficiency VCM Driver IC Revenue (million), by Country 2024 & 2032
- Figure 36: Europe High-efficiency VCM Driver IC Volume (K), by Country 2024 & 2032
- Figure 37: Europe High-efficiency VCM Driver IC Revenue Share (%), by Country 2024 & 2032
- Figure 38: Europe High-efficiency VCM Driver IC Volume Share (%), by Country 2024 & 2032
- Figure 39: Middle East & Africa High-efficiency VCM Driver IC Revenue (million), by Application 2024 & 2032
- Figure 40: Middle East & Africa High-efficiency VCM Driver IC Volume (K), by Application 2024 & 2032
- Figure 41: Middle East & Africa High-efficiency VCM Driver IC Revenue Share (%), by Application 2024 & 2032
- Figure 42: Middle East & Africa High-efficiency VCM Driver IC Volume Share (%), by Application 2024 & 2032
- Figure 43: Middle East & Africa High-efficiency VCM Driver IC Revenue (million), by Types 2024 & 2032
- Figure 44: Middle East & Africa High-efficiency VCM Driver IC Volume (K), by Types 2024 & 2032
- Figure 45: Middle East & Africa High-efficiency VCM Driver IC Revenue Share (%), by Types 2024 & 2032
- Figure 46: Middle East & Africa High-efficiency VCM Driver IC Volume Share (%), by Types 2024 & 2032
- Figure 47: Middle East & Africa High-efficiency VCM Driver IC Revenue (million), by Country 2024 & 2032
- Figure 48: Middle East & Africa High-efficiency VCM Driver IC Volume (K), by Country 2024 & 2032
- Figure 49: Middle East & Africa High-efficiency VCM Driver IC Revenue Share (%), by Country 2024 & 2032
- Figure 50: Middle East & Africa High-efficiency VCM Driver IC Volume Share (%), by Country 2024 & 2032
- Figure 51: Asia Pacific High-efficiency VCM Driver IC Revenue (million), by Application 2024 & 2032
- Figure 52: Asia Pacific High-efficiency VCM Driver IC Volume (K), by Application 2024 & 2032
- Figure 53: Asia Pacific High-efficiency VCM Driver IC Revenue Share (%), by Application 2024 & 2032
- Figure 54: Asia Pacific High-efficiency VCM Driver IC Volume Share (%), by Application 2024 & 2032
- Figure 55: Asia Pacific High-efficiency VCM Driver IC Revenue (million), by Types 2024 & 2032
- Figure 56: Asia Pacific High-efficiency VCM Driver IC Volume (K), by Types 2024 & 2032
- Figure 57: Asia Pacific High-efficiency VCM Driver IC Revenue Share (%), by Types 2024 & 2032
- Figure 58: Asia Pacific High-efficiency VCM Driver IC Volume Share (%), by Types 2024 & 2032
- Figure 59: Asia Pacific High-efficiency VCM Driver IC Revenue (million), by Country 2024 & 2032
- Figure 60: Asia Pacific High-efficiency VCM Driver IC Volume (K), by Country 2024 & 2032
- Figure 61: Asia Pacific High-efficiency VCM Driver IC Revenue Share (%), by Country 2024 & 2032
- Figure 62: Asia Pacific High-efficiency VCM Driver IC Volume Share (%), by Country 2024 & 2032
List of Tables
- Table 1: Global High-efficiency VCM Driver IC Revenue million Forecast, by Region 2019 & 2032
- Table 2: Global High-efficiency VCM Driver IC Volume K Forecast, by Region 2019 & 2032
- Table 3: Global High-efficiency VCM Driver IC Revenue million Forecast, by Application 2019 & 2032
- Table 4: Global High-efficiency VCM Driver IC Volume K Forecast, by Application 2019 & 2032
- Table 5: Global High-efficiency VCM Driver IC Revenue million Forecast, by Types 2019 & 2032
- Table 6: Global High-efficiency VCM Driver IC Volume K Forecast, by Types 2019 & 2032
- Table 7: Global High-efficiency VCM Driver IC Revenue million Forecast, by Region 2019 & 2032
- Table 8: Global High-efficiency VCM Driver IC Volume K Forecast, by Region 2019 & 2032
- Table 9: Global High-efficiency VCM Driver IC Revenue million Forecast, by Application 2019 & 2032
- Table 10: Global High-efficiency VCM Driver IC Volume K Forecast, by Application 2019 & 2032
- Table 11: Global High-efficiency VCM Driver IC Revenue million Forecast, by Types 2019 & 2032
- Table 12: Global High-efficiency VCM Driver IC Volume K Forecast, by Types 2019 & 2032
- Table 13: Global High-efficiency VCM Driver IC Revenue million Forecast, by Country 2019 & 2032
- Table 14: Global High-efficiency VCM Driver IC Volume K Forecast, by Country 2019 & 2032
- Table 15: United States High-efficiency VCM Driver IC Revenue (million) Forecast, by Application 2019 & 2032
- Table 16: United States High-efficiency VCM Driver IC Volume (K) Forecast, by Application 2019 & 2032
- Table 17: Canada High-efficiency VCM Driver IC Revenue (million) Forecast, by Application 2019 & 2032
- Table 18: Canada High-efficiency VCM Driver IC Volume (K) Forecast, by Application 2019 & 2032
- Table 19: Mexico High-efficiency VCM Driver IC Revenue (million) Forecast, by Application 2019 & 2032
- Table 20: Mexico High-efficiency VCM Driver IC Volume (K) Forecast, by Application 2019 & 2032
- Table 21: Global High-efficiency VCM Driver IC Revenue million Forecast, by Application 2019 & 2032
- Table 22: Global High-efficiency VCM Driver IC Volume K Forecast, by Application 2019 & 2032
- Table 23: Global High-efficiency VCM Driver IC Revenue million Forecast, by Types 2019 & 2032
- Table 24: Global High-efficiency VCM Driver IC Volume K Forecast, by Types 2019 & 2032
- Table 25: Global High-efficiency VCM Driver IC Revenue million Forecast, by Country 2019 & 2032
- Table 26: Global High-efficiency VCM Driver IC Volume K Forecast, by Country 2019 & 2032
- Table 27: Brazil High-efficiency VCM Driver IC Revenue (million) Forecast, by Application 2019 & 2032
- Table 28: Brazil High-efficiency VCM Driver IC Volume (K) Forecast, by Application 2019 & 2032
- Table 29: Argentina High-efficiency VCM Driver IC Revenue (million) Forecast, by Application 2019 & 2032
- Table 30: Argentina High-efficiency VCM Driver IC Volume (K) Forecast, by Application 2019 & 2032
- Table 31: Rest of South America High-efficiency VCM Driver IC Revenue (million) Forecast, by Application 2019 & 2032
- Table 32: Rest of South America High-efficiency VCM Driver IC Volume (K) Forecast, by Application 2019 & 2032
- Table 33: Global High-efficiency VCM Driver IC Revenue million Forecast, by Application 2019 & 2032
- Table 34: Global High-efficiency VCM Driver IC Volume K Forecast, by Application 2019 & 2032
- Table 35: Global High-efficiency VCM Driver IC Revenue million Forecast, by Types 2019 & 2032
- Table 36: Global High-efficiency VCM Driver IC Volume K Forecast, by Types 2019 & 2032
- Table 37: Global High-efficiency VCM Driver IC Revenue million Forecast, by Country 2019 & 2032
- Table 38: Global High-efficiency VCM Driver IC Volume K Forecast, by Country 2019 & 2032
- Table 39: United Kingdom High-efficiency VCM Driver IC Revenue (million) Forecast, by Application 2019 & 2032
- Table 40: United Kingdom High-efficiency VCM Driver IC Volume (K) Forecast, by Application 2019 & 2032
- Table 41: Germany High-efficiency VCM Driver IC Revenue (million) Forecast, by Application 2019 & 2032
- Table 42: Germany High-efficiency VCM Driver IC Volume (K) Forecast, by Application 2019 & 2032
- Table 43: France High-efficiency VCM Driver IC Revenue (million) Forecast, by Application 2019 & 2032
- Table 44: France High-efficiency VCM Driver IC Volume (K) Forecast, by Application 2019 & 2032
- Table 45: Italy High-efficiency VCM Driver IC Revenue (million) Forecast, by Application 2019 & 2032
- Table 46: Italy High-efficiency VCM Driver IC Volume (K) Forecast, by Application 2019 & 2032
- Table 47: Spain High-efficiency VCM Driver IC Revenue (million) Forecast, by Application 2019 & 2032
- Table 48: Spain High-efficiency VCM Driver IC Volume (K) Forecast, by Application 2019 & 2032
- Table 49: Russia High-efficiency VCM Driver IC Revenue (million) Forecast, by Application 2019 & 2032
- Table 50: Russia High-efficiency VCM Driver IC Volume (K) Forecast, by Application 2019 & 2032
- Table 51: Benelux High-efficiency VCM Driver IC Revenue (million) Forecast, by Application 2019 & 2032
- Table 52: Benelux High-efficiency VCM Driver IC Volume (K) Forecast, by Application 2019 & 2032
- Table 53: Nordics High-efficiency VCM Driver IC Revenue (million) Forecast, by Application 2019 & 2032
- Table 54: Nordics High-efficiency VCM Driver IC Volume (K) Forecast, by Application 2019 & 2032
- Table 55: Rest of Europe High-efficiency VCM Driver IC Revenue (million) Forecast, by Application 2019 & 2032
- Table 56: Rest of Europe High-efficiency VCM Driver IC Volume (K) Forecast, by Application 2019 & 2032
- Table 57: Global High-efficiency VCM Driver IC Revenue million Forecast, by Application 2019 & 2032
- Table 58: Global High-efficiency VCM Driver IC Volume K Forecast, by Application 2019 & 2032
- Table 59: Global High-efficiency VCM Driver IC Revenue million Forecast, by Types 2019 & 2032
- Table 60: Global High-efficiency VCM Driver IC Volume K Forecast, by Types 2019 & 2032
- Table 61: Global High-efficiency VCM Driver IC Revenue million Forecast, by Country 2019 & 2032
- Table 62: Global High-efficiency VCM Driver IC Volume K Forecast, by Country 2019 & 2032
- Table 63: Turkey High-efficiency VCM Driver IC Revenue (million) Forecast, by Application 2019 & 2032
- Table 64: Turkey High-efficiency VCM Driver IC Volume (K) Forecast, by Application 2019 & 2032
- Table 65: Israel High-efficiency VCM Driver IC Revenue (million) Forecast, by Application 2019 & 2032
- Table 66: Israel High-efficiency VCM Driver IC Volume (K) Forecast, by Application 2019 & 2032
- Table 67: GCC High-efficiency VCM Driver IC Revenue (million) Forecast, by Application 2019 & 2032
- Table 68: GCC High-efficiency VCM Driver IC Volume (K) Forecast, by Application 2019 & 2032
- Table 69: North Africa High-efficiency VCM Driver IC Revenue (million) Forecast, by Application 2019 & 2032
- Table 70: North Africa High-efficiency VCM Driver IC Volume (K) Forecast, by Application 2019 & 2032
- Table 71: South Africa High-efficiency VCM Driver IC Revenue (million) Forecast, by Application 2019 & 2032
- Table 72: South Africa High-efficiency VCM Driver IC Volume (K) Forecast, by Application 2019 & 2032
- Table 73: Rest of Middle East & Africa High-efficiency VCM Driver IC Revenue (million) Forecast, by Application 2019 & 2032
- Table 74: Rest of Middle East & Africa High-efficiency VCM Driver IC Volume (K) Forecast, by Application 2019 & 2032
- Table 75: Global High-efficiency VCM Driver IC Revenue million Forecast, by Application 2019 & 2032
- Table 76: Global High-efficiency VCM Driver IC Volume K Forecast, by Application 2019 & 2032
- Table 77: Global High-efficiency VCM Driver IC Revenue million Forecast, by Types 2019 & 2032
- Table 78: Global High-efficiency VCM Driver IC Volume K Forecast, by Types 2019 & 2032
- Table 79: Global High-efficiency VCM Driver IC Revenue million Forecast, by Country 2019 & 2032
- Table 80: Global High-efficiency VCM Driver IC Volume K Forecast, by Country 2019 & 2032
- Table 81: China High-efficiency VCM Driver IC Revenue (million) Forecast, by Application 2019 & 2032
- Table 82: China High-efficiency VCM Driver IC Volume (K) Forecast, by Application 2019 & 2032
- Table 83: India High-efficiency VCM Driver IC Revenue (million) Forecast, by Application 2019 & 2032
- Table 84: India High-efficiency VCM Driver IC Volume (K) Forecast, by Application 2019 & 2032
- Table 85: Japan High-efficiency VCM Driver IC Revenue (million) Forecast, by Application 2019 & 2032
- Table 86: Japan High-efficiency VCM Driver IC Volume (K) Forecast, by Application 2019 & 2032
- Table 87: South Korea High-efficiency VCM Driver IC Revenue (million) Forecast, by Application 2019 & 2032
- Table 88: South Korea High-efficiency VCM Driver IC Volume (K) Forecast, by Application 2019 & 2032
- Table 89: ASEAN High-efficiency VCM Driver IC Revenue (million) Forecast, by Application 2019 & 2032
- Table 90: ASEAN High-efficiency VCM Driver IC Volume (K) Forecast, by Application 2019 & 2032
- Table 91: Oceania High-efficiency VCM Driver IC Revenue (million) Forecast, by Application 2019 & 2032
- Table 92: Oceania High-efficiency VCM Driver IC Volume (K) Forecast, by Application 2019 & 2032
- Table 93: Rest of Asia Pacific High-efficiency VCM Driver IC Revenue (million) Forecast, by Application 2019 & 2032
- Table 94: Rest of Asia Pacific High-efficiency VCM Driver IC Volume (K) Forecast, by Application 2019 & 2032
Frequently Asked Questions
1. What is the projected Compound Annual Growth Rate (CAGR) of the High-efficiency VCM Driver IC?
The projected CAGR is approximately XX%.
2. Which companies are prominent players in the High-efficiency VCM Driver IC?
Key companies in the market include Dongwoon Anatech, ROHM, Asahi Kasei Microdevices (AKM), Onsemi, ADARD TECHNOLOGY INC., Giantec Semiconductor Corporation, Zinitix.
3. What are the main segments of the High-efficiency VCM Driver IC?
The market segments include Application, Types.
4. Can you provide details about the market size?
The market size is estimated to be USD XXX million as of 2022.
5. What are some drivers contributing to market growth?
N/A
6. What are the notable trends driving market growth?
N/A
7. Are there any restraints impacting market growth?
N/A
8. Can you provide examples of recent developments in the market?
N/A
9. What pricing options are available for accessing the report?
Pricing options include single-user, multi-user, and enterprise licenses priced at USD 4350.00, USD 6525.00, and USD 8700.00 respectively.
10. Is the market size provided in terms of value or volume?
The market size is provided in terms of value, measured in million and volume, measured in K.
11. Are there any specific market keywords associated with the report?
Yes, the market keyword associated with the report is "High-efficiency VCM Driver IC," which aids in identifying and referencing the specific market segment covered.
12. How do I determine which pricing option suits my needs best?
The pricing options vary based on user requirements and access needs. Individual users may opt for single-user licenses, while businesses requiring broader access may choose multi-user or enterprise licenses for cost-effective access to the report.
13. Are there any additional resources or data provided in the High-efficiency VCM Driver IC report?
While the report offers comprehensive insights, it's advisable to review the specific contents or supplementary materials provided to ascertain if additional resources or data are available.
14. How can I stay updated on further developments or reports in the High-efficiency VCM Driver IC?
To stay informed about further developments, trends, and reports in the High-efficiency VCM Driver IC, consider subscribing to industry newsletters, following relevant companies and organizations, or regularly checking reputable industry news sources and publications.
Methodology
Step 1 - Identification of Relevant Samples Size from Population Database


Step 2 - Approaches for Defining Global Market Size (Value, Volume* & Price*)

Note*: In applicable scenarios
Step 3 - Data Sources
Primary Research
- Web Analytics
- Survey Reports
- Research Institute
- Latest Research Reports
- Opinion Leaders
Secondary Research
- Annual Reports
- White Paper
- Latest Press Release
- Industry Association
- Paid Database
- Investor Presentations

Step 4 - Data Triangulation
Involves using different sources of information in order to increase the validity of a study
These sources are likely to be stakeholders in a program - participants, other researchers, program staff, other community members, and so on.
Then we put all data in single framework & apply various statistical tools to find out the dynamic on the market.
During the analysis stage, feedback from the stakeholder groups would be compared to determine areas of agreement as well as areas of divergence


