Key Insights
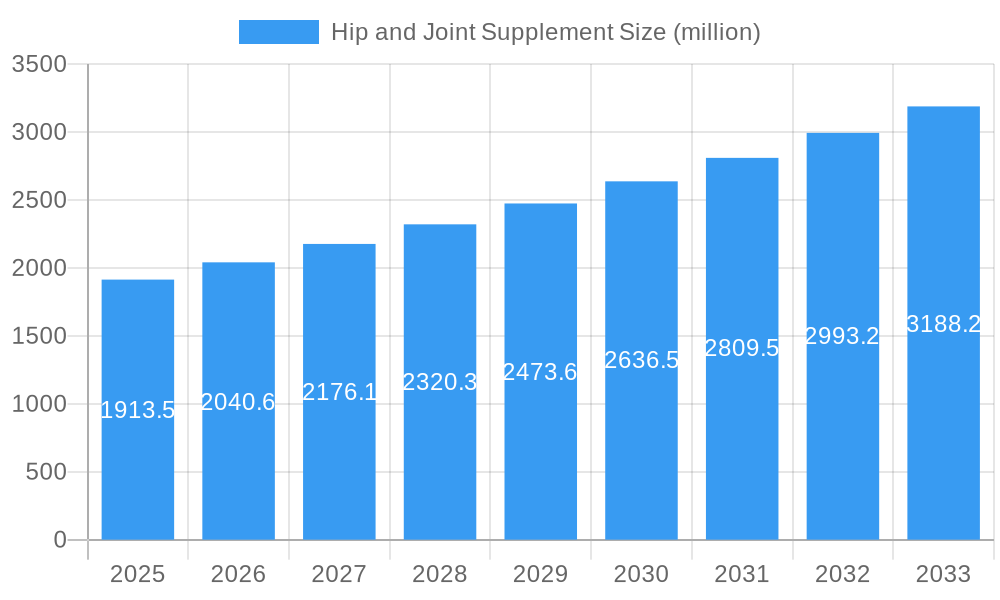
The global hip and joint supplement market, valued at $1913.5 million in 2025, is projected to experience robust growth, driven by an increasing aging pet population and rising pet ownership. A compound annual growth rate (CAGR) of 6.5% from 2025 to 2033 indicates a significant market expansion. This growth is fueled by increasing pet owner awareness of joint health issues in aging animals, coupled with the availability of innovative and effective supplement formulations. Key market drivers include the rising prevalence of osteoarthritis and hip dysplasia in dogs and cats, leading pet owners to seek preventative and therapeutic solutions. Furthermore, the increasing humanization of pets and willingness to spend on their healthcare contributes significantly to market expansion. Competitive forces are shaping the market landscape, with established players like Mars, Nestle Purina, and Blue Buffalo competing alongside emerging brands focusing on specialized formulations and natural ingredients. The market is segmented based on ingredient type (e.g., glucosamine, chondroitin), pet type (dogs, cats), and distribution channel (veterinary clinics, online retailers, pet stores). Growth will be influenced by factors like increasing research and development in joint health supplements, the expansion of e-commerce platforms for pet products, and the evolving preferences of pet owners towards natural and holistic solutions.
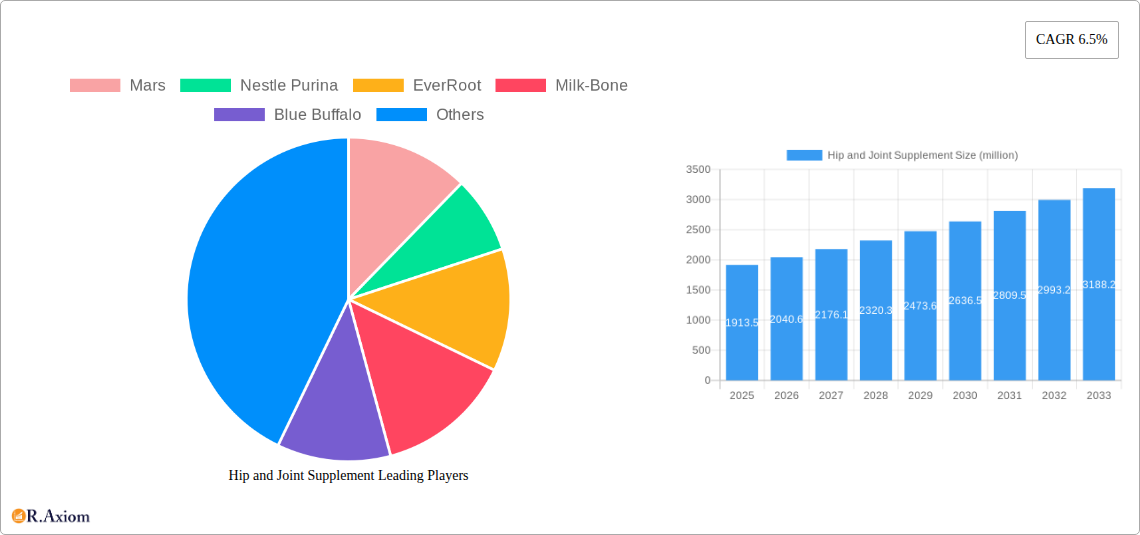
Hip and Joint Supplement Market Size (In Billion)
The market's growth trajectory is expected to continue, propelled by ongoing advancements in supplement technology and the increasing demand for premium pet care products. However, potential restraints include fluctuating raw material prices and regulatory hurdles related to ingredient standardization and safety. Strategic partnerships between supplement manufacturers and veterinary professionals will likely play a crucial role in enhancing market penetration and consumer trust. Geographic expansion, particularly in emerging markets with growing pet ownership rates, presents substantial growth opportunities. The focus will shift towards personalized supplement regimens tailored to the specific needs of individual pets, further enhancing the market's potential.
Hip and Joint Supplement Company Market Share
This detailed report provides a comprehensive analysis of the global hip and joint supplement market, projecting a market value exceeding $XX million by 2033. The study period covers 2019-2033, with 2025 serving as both the base and estimated year. The forecast period spans 2025-2033, and the historical period encompasses 2019-2024. This report is invaluable for industry stakeholders, including manufacturers like Mars, Nestle Purina, EverRoot, Milk-Bone, Blue Buffalo, VetIQ, JPK Nutri, maxxipaws, Unicharm, OSCAR Pet Foods, Affinity Petcare, MoonShine, Yantai China Pet Foods, GREENIES, Wagg, Petpal Tech, DogKind, and retailers specializing in pet treats and chews.
Hip and Joint Supplement Market Concentration & Innovation
This section analyzes market concentration, innovation drivers, regulatory frameworks, product substitutes, end-user trends, and M&A activities within the hip and joint supplement market. The market exhibits a moderately concentrated structure, with the top five players holding an estimated XX% market share in 2025. Several factors drive innovation, including the increasing demand for natural ingredients, advancements in delivery systems (e.g., chewables, liquids), and the development of targeted formulations for specific breeds and conditions. Regulatory frameworks vary across regions, impacting product approvals and labeling requirements. Competition from alternative therapies, like physiotherapy and surgery, also influences market dynamics. M&A activity has been significant, with XX major deals totaling over $XX million in the past five years, largely driven by companies seeking to expand their product portfolios and geographic reach.
- Market Share: Top 5 players - XX% (2025)
- M&A Deal Value: >$XX million (2020-2024)
- Key Innovation Drivers: Natural ingredients, advanced delivery systems, targeted formulations.
Hip and Joint Supplement Industry Trends & Insights
The global hip and joint supplement market is experiencing robust growth, driven by several key factors. The aging pet population in developed countries, coupled with increasing pet ownership, fuels demand for products that support joint health. Technological advancements in ingredient sourcing and formulation lead to higher efficacy and improved palatability. Consumer preferences are shifting towards natural and organic supplements, creating opportunities for brands emphasizing transparency and sustainability. Competitive dynamics are intense, with established players focusing on brand building and product diversification, while smaller companies leverage innovation and niche market targeting. The market is expected to exhibit a Compound Annual Growth Rate (CAGR) of XX% during the forecast period, with market penetration increasing from XX% in 2025 to XX% by 2033.
Dominant Markets & Segments in Hip and Joint Supplement
The North American market currently dominates the global hip and joint supplement sector, driven by high pet ownership rates, strong disposable incomes, and increased awareness of pet health. Key drivers include:
- Strong Consumer Spending: High disposable income among pet owners.
- High Pet Ownership Rates: Significant number of pets across various age groups.
- Developed Veterinary Infrastructure: Extensive access to veterinary care and diagnosis.
The market is segmented by pet type (dogs, cats, etc.), product type (tablets, chews, liquids), and ingredient type (glucosamine, chondroitin, etc.). The dog segment holds the largest market share due to higher pet ownership numbers and a greater prevalence of joint-related issues in larger breeds.
Hip and Joint Supplement Product Developments
Recent product innovations have focused on improving bioavailability, palatability, and efficacy. This includes the use of novel delivery systems like liposomal encapsulation, the incorporation of synergistic ingredient combinations, and the development of personalized formulations based on breed-specific needs. These advancements enhance market fit by addressing consumer demand for products that are both effective and convenient to administer.
Report Scope & Segmentation Analysis
This report segments the market by region (North America, Europe, Asia-Pacific, etc.), pet type (dogs, cats, horses, etc.), product type (tablets, capsules, liquids, chews), ingredient type (glucosamine, chondroitin, MSM, etc.), and distribution channel (veterinary clinics, pet stores, online retailers). Each segment’s growth projections, market sizes, and competitive dynamics are analyzed in detail. Growth projections vary across segments, with the dog segment and North American region expected to exhibit the highest growth rates.
Key Drivers of Hip and Joint Supplement Growth
Several factors contribute to the market's expansion:
- Rising Pet Ownership: Globally increasing pet ownership is a major driver.
- Aging Pet Population: An increasing number of older pets requiring joint support.
- Growing Awareness of Pet Health: Increased consumer awareness leads to higher demand.
- Technological Advancements: Innovation in formulation and delivery systems.
Challenges in the Hip and Joint Supplement Sector
Significant challenges include:
- Stringent Regulatory Requirements: Varying regulations across different regions increase compliance costs.
- Fluctuating Raw Material Prices: Price volatility for key ingredients impacts profitability.
- Intense Competition: The market's competitiveness necessitates continuous innovation and marketing efforts.
Emerging Opportunities in Hip and Joint Supplement
Emerging opportunities arise from:
- Functional Food Integration: Incorporating supplements into pet food enhances convenience.
- Personalized Nutrition: Tailoring supplements based on individual pet needs.
- Expansion into Emerging Markets: Untapped potential in developing countries with growing pet ownership.
Leading Players in the Hip and Joint Supplement Market
- Mars
- Nestle Purina
- EverRoot
- Milk-Bone
- Blue Buffalo
- VetIQ
- JPK Nutri
- maxxipaws
- Unicharm
- OSCAR Pet Foods
- Affinity Petcare
- MoonShine
- Yantai China Pet Foods
- GREENIES
- Wagg
- Petpal Tech
- DogKind
- Pet Treats
- Pet Chews
Key Developments in Hip and Joint Supplement Industry
- 2022-Q4: Mars launched a new line of hip and joint supplements formulated with omega-3 fatty acids.
- 2023-Q1: Nestle Purina acquired a smaller competitor, expanding its product portfolio.
- 2024-Q2: Several companies introduced sustainable sourcing initiatives for key ingredients. (Further developments will be added in the full report)
Strategic Outlook for Hip and Joint Supplement Market
The hip and joint supplement market is poised for continued growth, fueled by evolving consumer preferences, technological advancements, and the expanding pet care sector. Strategic opportunities exist in developing innovative products, optimizing supply chains, and capitalizing on emerging markets. Companies focusing on differentiation, sustainability, and customer engagement are expected to achieve the strongest growth.
Hip and Joint Supplement Segmentation
-
1. Application
- 1.1. Pet Dog
- 1.2. Pet Cat
- 1.3. Others
-
2. Types
- 2.1. Biscuits
- 2.2. Soft Treats
- 2.3. Chewable Tablets
- 2.4. Others
Hip and Joint Supplement Segmentation By Geography
-
1. North America
- 1.1. United States
- 1.2. Canada
- 1.3. Mexico
-
2. South America
- 2.1. Brazil
- 2.2. Argentina
- 2.3. Rest of South America
-
3. Europe
- 3.1. United Kingdom
- 3.2. Germany
- 3.3. France
- 3.4. Italy
- 3.5. Spain
- 3.6. Russia
- 3.7. Benelux
- 3.8. Nordics
- 3.9. Rest of Europe
-
4. Middle East & Africa
- 4.1. Turkey
- 4.2. Israel
- 4.3. GCC
- 4.4. North Africa
- 4.5. South Africa
- 4.6. Rest of Middle East & Africa
-
5. Asia Pacific
- 5.1. China
- 5.2. India
- 5.3. Japan
- 5.4. South Korea
- 5.5. ASEAN
- 5.6. Oceania
- 5.7. Rest of Asia Pacific
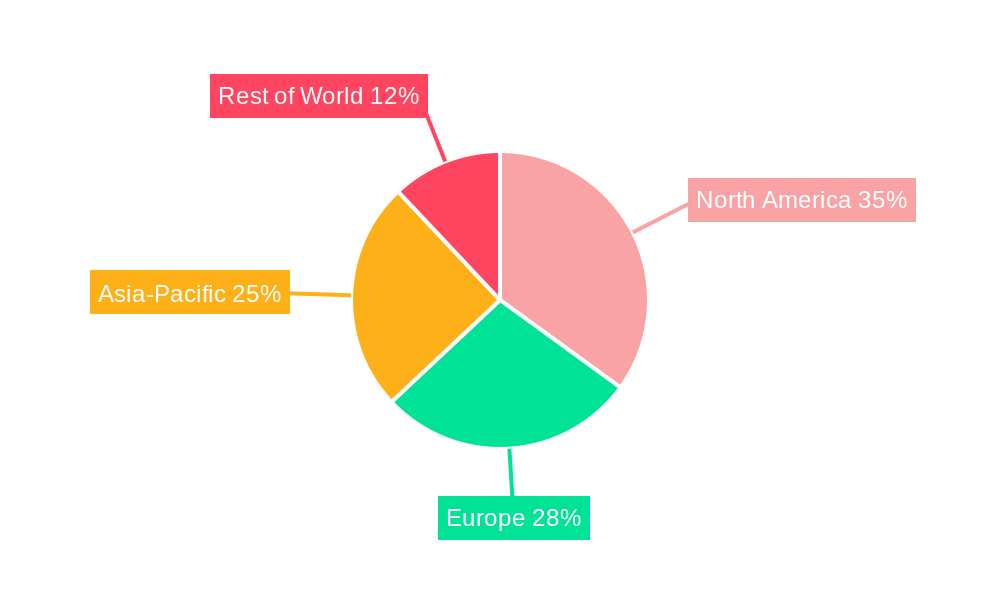
Hip and Joint Supplement Regional Market Share
Geographic Coverage of Hip and Joint Supplement
Hip and Joint Supplement REPORT HIGHLIGHTS
| Aspects | Details |
|---|---|
| Study Period | 2020-2034 |
| Base Year | 2025 |
| Estimated Year | 2026 |
| Forecast Period | 2026-2034 |
| Historical Period | 2020-2025 |
| Growth Rate | CAGR of 6.5% from 2020-2034 |
| Segmentation |
|
Table of Contents
- 1. Introduction
- 1.1. Research Scope
- 1.2. Market Segmentation
- 1.3. Research Methodology
- 1.4. Definitions and Assumptions
- 2. Executive Summary
- 2.1. Introduction
- 3. Market Dynamics
- 3.1. Introduction
- 3.2. Market Drivers
- 3.3. Market Restrains
- 3.4. Market Trends
- 4. Market Factor Analysis
- 4.1. Porters Five Forces
- 4.2. Supply/Value Chain
- 4.3. PESTEL analysis
- 4.4. Market Entropy
- 4.5. Patent/Trademark Analysis
- 5. Global Hip and Joint Supplement Analysis, Insights and Forecast, 2020-2032
- 5.1. Market Analysis, Insights and Forecast - by Application
- 5.1.1. Pet Dog
- 5.1.2. Pet Cat
- 5.1.3. Others
- 5.2. Market Analysis, Insights and Forecast - by Types
- 5.2.1. Biscuits
- 5.2.2. Soft Treats
- 5.2.3. Chewable Tablets
- 5.2.4. Others
- 5.3. Market Analysis, Insights and Forecast - by Region
- 5.3.1. North America
- 5.3.2. South America
- 5.3.3. Europe
- 5.3.4. Middle East & Africa
- 5.3.5. Asia Pacific
- 5.1. Market Analysis, Insights and Forecast - by Application
- 6. North America Hip and Joint Supplement Analysis, Insights and Forecast, 2020-2032
- 6.1. Market Analysis, Insights and Forecast - by Application
- 6.1.1. Pet Dog
- 6.1.2. Pet Cat
- 6.1.3. Others
- 6.2. Market Analysis, Insights and Forecast - by Types
- 6.2.1. Biscuits
- 6.2.2. Soft Treats
- 6.2.3. Chewable Tablets
- 6.2.4. Others
- 6.1. Market Analysis, Insights and Forecast - by Application
- 7. South America Hip and Joint Supplement Analysis, Insights and Forecast, 2020-2032
- 7.1. Market Analysis, Insights and Forecast - by Application
- 7.1.1. Pet Dog
- 7.1.2. Pet Cat
- 7.1.3. Others
- 7.2. Market Analysis, Insights and Forecast - by Types
- 7.2.1. Biscuits
- 7.2.2. Soft Treats
- 7.2.3. Chewable Tablets
- 7.2.4. Others
- 7.1. Market Analysis, Insights and Forecast - by Application
- 8. Europe Hip and Joint Supplement Analysis, Insights and Forecast, 2020-2032
- 8.1. Market Analysis, Insights and Forecast - by Application
- 8.1.1. Pet Dog
- 8.1.2. Pet Cat
- 8.1.3. Others
- 8.2. Market Analysis, Insights and Forecast - by Types
- 8.2.1. Biscuits
- 8.2.2. Soft Treats
- 8.2.3. Chewable Tablets
- 8.2.4. Others
- 8.1. Market Analysis, Insights and Forecast - by Application
- 9. Middle East & Africa Hip and Joint Supplement Analysis, Insights and Forecast, 2020-2032
- 9.1. Market Analysis, Insights and Forecast - by Application
- 9.1.1. Pet Dog
- 9.1.2. Pet Cat
- 9.1.3. Others
- 9.2. Market Analysis, Insights and Forecast - by Types
- 9.2.1. Biscuits
- 9.2.2. Soft Treats
- 9.2.3. Chewable Tablets
- 9.2.4. Others
- 9.1. Market Analysis, Insights and Forecast - by Application
- 10. Asia Pacific Hip and Joint Supplement Analysis, Insights and Forecast, 2020-2032
- 10.1. Market Analysis, Insights and Forecast - by Application
- 10.1.1. Pet Dog
- 10.1.2. Pet Cat
- 10.1.3. Others
- 10.2. Market Analysis, Insights and Forecast - by Types
- 10.2.1. Biscuits
- 10.2.2. Soft Treats
- 10.2.3. Chewable Tablets
- 10.2.4. Others
- 10.1. Market Analysis, Insights and Forecast - by Application
- 11. Competitive Analysis
- 11.1. Global Market Share Analysis 2025
- 11.2. Company Profiles
- 11.2.1 Mars
- 11.2.1.1. Overview
- 11.2.1.2. Products
- 11.2.1.3. SWOT Analysis
- 11.2.1.4. Recent Developments
- 11.2.1.5. Financials (Based on Availability)
- 11.2.2 Nestle Purina
- 11.2.2.1. Overview
- 11.2.2.2. Products
- 11.2.2.3. SWOT Analysis
- 11.2.2.4. Recent Developments
- 11.2.2.5. Financials (Based on Availability)
- 11.2.3 EverRoot
- 11.2.3.1. Overview
- 11.2.3.2. Products
- 11.2.3.3. SWOT Analysis
- 11.2.3.4. Recent Developments
- 11.2.3.5. Financials (Based on Availability)
- 11.2.4 Milk-Bone
- 11.2.4.1. Overview
- 11.2.4.2. Products
- 11.2.4.3. SWOT Analysis
- 11.2.4.4. Recent Developments
- 11.2.4.5. Financials (Based on Availability)
- 11.2.5 Blue Buffalo
- 11.2.5.1. Overview
- 11.2.5.2. Products
- 11.2.5.3. SWOT Analysis
- 11.2.5.4. Recent Developments
- 11.2.5.5. Financials (Based on Availability)
- 11.2.6 VetIQ
- 11.2.6.1. Overview
- 11.2.6.2. Products
- 11.2.6.3. SWOT Analysis
- 11.2.6.4. Recent Developments
- 11.2.6.5. Financials (Based on Availability)
- 11.2.7 JPK Nutri
- 11.2.7.1. Overview
- 11.2.7.2. Products
- 11.2.7.3. SWOT Analysis
- 11.2.7.4. Recent Developments
- 11.2.7.5. Financials (Based on Availability)
- 11.2.8 maxxipaws
- 11.2.8.1. Overview
- 11.2.8.2. Products
- 11.2.8.3. SWOT Analysis
- 11.2.8.4. Recent Developments
- 11.2.8.5. Financials (Based on Availability)
- 11.2.9 Unicharm
- 11.2.9.1. Overview
- 11.2.9.2. Products
- 11.2.9.3. SWOT Analysis
- 11.2.9.4. Recent Developments
- 11.2.9.5. Financials (Based on Availability)
- 11.2.10 OSCAR Pet Foods
- 11.2.10.1. Overview
- 11.2.10.2. Products
- 11.2.10.3. SWOT Analysis
- 11.2.10.4. Recent Developments
- 11.2.10.5. Financials (Based on Availability)
- 11.2.11 Affinity Petcare
- 11.2.11.1. Overview
- 11.2.11.2. Products
- 11.2.11.3. SWOT Analysis
- 11.2.11.4. Recent Developments
- 11.2.11.5. Financials (Based on Availability)
- 11.2.12 MoonShine
- 11.2.12.1. Overview
- 11.2.12.2. Products
- 11.2.12.3. SWOT Analysis
- 11.2.12.4. Recent Developments
- 11.2.12.5. Financials (Based on Availability)
- 11.2.13 Yantai China Pet Foods
- 11.2.13.1. Overview
- 11.2.13.2. Products
- 11.2.13.3. SWOT Analysis
- 11.2.13.4. Recent Developments
- 11.2.13.5. Financials (Based on Availability)
- 11.2.14 GREENIES
- 11.2.14.1. Overview
- 11.2.14.2. Products
- 11.2.14.3. SWOT Analysis
- 11.2.14.4. Recent Developments
- 11.2.14.5. Financials (Based on Availability)
- 11.2.15 Wagg
- 11.2.15.1. Overview
- 11.2.15.2. Products
- 11.2.15.3. SWOT Analysis
- 11.2.15.4. Recent Developments
- 11.2.15.5. Financials (Based on Availability)
- 11.2.16 Petpal Tech
- 11.2.16.1. Overview
- 11.2.16.2. Products
- 11.2.16.3. SWOT Analysis
- 11.2.16.4. Recent Developments
- 11.2.16.5. Financials (Based on Availability)
- 11.2.17 DogKind
- 11.2.17.1. Overview
- 11.2.17.2. Products
- 11.2.17.3. SWOT Analysis
- 11.2.17.4. Recent Developments
- 11.2.17.5. Financials (Based on Availability)
- 11.2.18 Pet Treats
- 11.2.18.1. Overview
- 11.2.18.2. Products
- 11.2.18.3. SWOT Analysis
- 11.2.18.4. Recent Developments
- 11.2.18.5. Financials (Based on Availability)
- 11.2.19 Pet Chews
- 11.2.19.1. Overview
- 11.2.19.2. Products
- 11.2.19.3. SWOT Analysis
- 11.2.19.4. Recent Developments
- 11.2.19.5. Financials (Based on Availability)
- 11.2.1 Mars
List of Figures
- Figure 1: Global Hip and Joint Supplement Revenue Breakdown (million, %) by Region 2025 & 2033
- Figure 2: Global Hip and Joint Supplement Volume Breakdown (K, %) by Region 2025 & 2033
- Figure 3: North America Hip and Joint Supplement Revenue (million), by Application 2025 & 2033
- Figure 4: North America Hip and Joint Supplement Volume (K), by Application 2025 & 2033
- Figure 5: North America Hip and Joint Supplement Revenue Share (%), by Application 2025 & 2033
- Figure 6: North America Hip and Joint Supplement Volume Share (%), by Application 2025 & 2033
- Figure 7: North America Hip and Joint Supplement Revenue (million), by Types 2025 & 2033
- Figure 8: North America Hip and Joint Supplement Volume (K), by Types 2025 & 2033
- Figure 9: North America Hip and Joint Supplement Revenue Share (%), by Types 2025 & 2033
- Figure 10: North America Hip and Joint Supplement Volume Share (%), by Types 2025 & 2033
- Figure 11: North America Hip and Joint Supplement Revenue (million), by Country 2025 & 2033
- Figure 12: North America Hip and Joint Supplement Volume (K), by Country 2025 & 2033
- Figure 13: North America Hip and Joint Supplement Revenue Share (%), by Country 2025 & 2033
- Figure 14: North America Hip and Joint Supplement Volume Share (%), by Country 2025 & 2033
- Figure 15: South America Hip and Joint Supplement Revenue (million), by Application 2025 & 2033
- Figure 16: South America Hip and Joint Supplement Volume (K), by Application 2025 & 2033
- Figure 17: South America Hip and Joint Supplement Revenue Share (%), by Application 2025 & 2033
- Figure 18: South America Hip and Joint Supplement Volume Share (%), by Application 2025 & 2033
- Figure 19: South America Hip and Joint Supplement Revenue (million), by Types 2025 & 2033
- Figure 20: South America Hip and Joint Supplement Volume (K), by Types 2025 & 2033
- Figure 21: South America Hip and Joint Supplement Revenue Share (%), by Types 2025 & 2033
- Figure 22: South America Hip and Joint Supplement Volume Share (%), by Types 2025 & 2033
- Figure 23: South America Hip and Joint Supplement Revenue (million), by Country 2025 & 2033
- Figure 24: South America Hip and Joint Supplement Volume (K), by Country 2025 & 2033
- Figure 25: South America Hip and Joint Supplement Revenue Share (%), by Country 2025 & 2033
- Figure 26: South America Hip and Joint Supplement Volume Share (%), by Country 2025 & 2033
- Figure 27: Europe Hip and Joint Supplement Revenue (million), by Application 2025 & 2033
- Figure 28: Europe Hip and Joint Supplement Volume (K), by Application 2025 & 2033
- Figure 29: Europe Hip and Joint Supplement Revenue Share (%), by Application 2025 & 2033
- Figure 30: Europe Hip and Joint Supplement Volume Share (%), by Application 2025 & 2033
- Figure 31: Europe Hip and Joint Supplement Revenue (million), by Types 2025 & 2033
- Figure 32: Europe Hip and Joint Supplement Volume (K), by Types 2025 & 2033
- Figure 33: Europe Hip and Joint Supplement Revenue Share (%), by Types 2025 & 2033
- Figure 34: Europe Hip and Joint Supplement Volume Share (%), by Types 2025 & 2033
- Figure 35: Europe Hip and Joint Supplement Revenue (million), by Country 2025 & 2033
- Figure 36: Europe Hip and Joint Supplement Volume (K), by Country 2025 & 2033
- Figure 37: Europe Hip and Joint Supplement Revenue Share (%), by Country 2025 & 2033
- Figure 38: Europe Hip and Joint Supplement Volume Share (%), by Country 2025 & 2033
- Figure 39: Middle East & Africa Hip and Joint Supplement Revenue (million), by Application 2025 & 2033
- Figure 40: Middle East & Africa Hip and Joint Supplement Volume (K), by Application 2025 & 2033
- Figure 41: Middle East & Africa Hip and Joint Supplement Revenue Share (%), by Application 2025 & 2033
- Figure 42: Middle East & Africa Hip and Joint Supplement Volume Share (%), by Application 2025 & 2033
- Figure 43: Middle East & Africa Hip and Joint Supplement Revenue (million), by Types 2025 & 2033
- Figure 44: Middle East & Africa Hip and Joint Supplement Volume (K), by Types 2025 & 2033
- Figure 45: Middle East & Africa Hip and Joint Supplement Revenue Share (%), by Types 2025 & 2033
- Figure 46: Middle East & Africa Hip and Joint Supplement Volume Share (%), by Types 2025 & 2033
- Figure 47: Middle East & Africa Hip and Joint Supplement Revenue (million), by Country 2025 & 2033
- Figure 48: Middle East & Africa Hip and Joint Supplement Volume (K), by Country 2025 & 2033
- Figure 49: Middle East & Africa Hip and Joint Supplement Revenue Share (%), by Country 2025 & 2033
- Figure 50: Middle East & Africa Hip and Joint Supplement Volume Share (%), by Country 2025 & 2033
- Figure 51: Asia Pacific Hip and Joint Supplement Revenue (million), by Application 2025 & 2033
- Figure 52: Asia Pacific Hip and Joint Supplement Volume (K), by Application 2025 & 2033
- Figure 53: Asia Pacific Hip and Joint Supplement Revenue Share (%), by Application 2025 & 2033
- Figure 54: Asia Pacific Hip and Joint Supplement Volume Share (%), by Application 2025 & 2033
- Figure 55: Asia Pacific Hip and Joint Supplement Revenue (million), by Types 2025 & 2033
- Figure 56: Asia Pacific Hip and Joint Supplement Volume (K), by Types 2025 & 2033
- Figure 57: Asia Pacific Hip and Joint Supplement Revenue Share (%), by Types 2025 & 2033
- Figure 58: Asia Pacific Hip and Joint Supplement Volume Share (%), by Types 2025 & 2033
- Figure 59: Asia Pacific Hip and Joint Supplement Revenue (million), by Country 2025 & 2033
- Figure 60: Asia Pacific Hip and Joint Supplement Volume (K), by Country 2025 & 2033
- Figure 61: Asia Pacific Hip and Joint Supplement Revenue Share (%), by Country 2025 & 2033
- Figure 62: Asia Pacific Hip and Joint Supplement Volume Share (%), by Country 2025 & 2033
List of Tables
- Table 1: Global Hip and Joint Supplement Revenue million Forecast, by Application 2020 & 2033
- Table 2: Global Hip and Joint Supplement Volume K Forecast, by Application 2020 & 2033
- Table 3: Global Hip and Joint Supplement Revenue million Forecast, by Types 2020 & 2033
- Table 4: Global Hip and Joint Supplement Volume K Forecast, by Types 2020 & 2033
- Table 5: Global Hip and Joint Supplement Revenue million Forecast, by Region 2020 & 2033
- Table 6: Global Hip and Joint Supplement Volume K Forecast, by Region 2020 & 2033
- Table 7: Global Hip and Joint Supplement Revenue million Forecast, by Application 2020 & 2033
- Table 8: Global Hip and Joint Supplement Volume K Forecast, by Application 2020 & 2033
- Table 9: Global Hip and Joint Supplement Revenue million Forecast, by Types 2020 & 2033
- Table 10: Global Hip and Joint Supplement Volume K Forecast, by Types 2020 & 2033
- Table 11: Global Hip and Joint Supplement Revenue million Forecast, by Country 2020 & 2033
- Table 12: Global Hip and Joint Supplement Volume K Forecast, by Country 2020 & 2033
- Table 13: United States Hip and Joint Supplement Revenue (million) Forecast, by Application 2020 & 2033
- Table 14: United States Hip and Joint Supplement Volume (K) Forecast, by Application 2020 & 2033
- Table 15: Canada Hip and Joint Supplement Revenue (million) Forecast, by Application 2020 & 2033
- Table 16: Canada Hip and Joint Supplement Volume (K) Forecast, by Application 2020 & 2033
- Table 17: Mexico Hip and Joint Supplement Revenue (million) Forecast, by Application 2020 & 2033
- Table 18: Mexico Hip and Joint Supplement Volume (K) Forecast, by Application 2020 & 2033
- Table 19: Global Hip and Joint Supplement Revenue million Forecast, by Application 2020 & 2033
- Table 20: Global Hip and Joint Supplement Volume K Forecast, by Application 2020 & 2033
- Table 21: Global Hip and Joint Supplement Revenue million Forecast, by Types 2020 & 2033
- Table 22: Global Hip and Joint Supplement Volume K Forecast, by Types 2020 & 2033
- Table 23: Global Hip and Joint Supplement Revenue million Forecast, by Country 2020 & 2033
- Table 24: Global Hip and Joint Supplement Volume K Forecast, by Country 2020 & 2033
- Table 25: Brazil Hip and Joint Supplement Revenue (million) Forecast, by Application 2020 & 2033
- Table 26: Brazil Hip and Joint Supplement Volume (K) Forecast, by Application 2020 & 2033
- Table 27: Argentina Hip and Joint Supplement Revenue (million) Forecast, by Application 2020 & 2033
- Table 28: Argentina Hip and Joint Supplement Volume (K) Forecast, by Application 2020 & 2033
- Table 29: Rest of South America Hip and Joint Supplement Revenue (million) Forecast, by Application 2020 & 2033
- Table 30: Rest of South America Hip and Joint Supplement Volume (K) Forecast, by Application 2020 & 2033
- Table 31: Global Hip and Joint Supplement Revenue million Forecast, by Application 2020 & 2033
- Table 32: Global Hip and Joint Supplement Volume K Forecast, by Application 2020 & 2033
- Table 33: Global Hip and Joint Supplement Revenue million Forecast, by Types 2020 & 2033
- Table 34: Global Hip and Joint Supplement Volume K Forecast, by Types 2020 & 2033
- Table 35: Global Hip and Joint Supplement Revenue million Forecast, by Country 2020 & 2033
- Table 36: Global Hip and Joint Supplement Volume K Forecast, by Country 2020 & 2033
- Table 37: United Kingdom Hip and Joint Supplement Revenue (million) Forecast, by Application 2020 & 2033
- Table 38: United Kingdom Hip and Joint Supplement Volume (K) Forecast, by Application 2020 & 2033
- Table 39: Germany Hip and Joint Supplement Revenue (million) Forecast, by Application 2020 & 2033
- Table 40: Germany Hip and Joint Supplement Volume (K) Forecast, by Application 2020 & 2033
- Table 41: France Hip and Joint Supplement Revenue (million) Forecast, by Application 2020 & 2033
- Table 42: France Hip and Joint Supplement Volume (K) Forecast, by Application 2020 & 2033
- Table 43: Italy Hip and Joint Supplement Revenue (million) Forecast, by Application 2020 & 2033
- Table 44: Italy Hip and Joint Supplement Volume (K) Forecast, by Application 2020 & 2033
- Table 45: Spain Hip and Joint Supplement Revenue (million) Forecast, by Application 2020 & 2033
- Table 46: Spain Hip and Joint Supplement Volume (K) Forecast, by Application 2020 & 2033
- Table 47: Russia Hip and Joint Supplement Revenue (million) Forecast, by Application 2020 & 2033
- Table 48: Russia Hip and Joint Supplement Volume (K) Forecast, by Application 2020 & 2033
- Table 49: Benelux Hip and Joint Supplement Revenue (million) Forecast, by Application 2020 & 2033
- Table 50: Benelux Hip and Joint Supplement Volume (K) Forecast, by Application 2020 & 2033
- Table 51: Nordics Hip and Joint Supplement Revenue (million) Forecast, by Application 2020 & 2033
- Table 52: Nordics Hip and Joint Supplement Volume (K) Forecast, by Application 2020 & 2033
- Table 53: Rest of Europe Hip and Joint Supplement Revenue (million) Forecast, by Application 2020 & 2033
- Table 54: Rest of Europe Hip and Joint Supplement Volume (K) Forecast, by Application 2020 & 2033
- Table 55: Global Hip and Joint Supplement Revenue million Forecast, by Application 2020 & 2033
- Table 56: Global Hip and Joint Supplement Volume K Forecast, by Application 2020 & 2033
- Table 57: Global Hip and Joint Supplement Revenue million Forecast, by Types 2020 & 2033
- Table 58: Global Hip and Joint Supplement Volume K Forecast, by Types 2020 & 2033
- Table 59: Global Hip and Joint Supplement Revenue million Forecast, by Country 2020 & 2033
- Table 60: Global Hip and Joint Supplement Volume K Forecast, by Country 2020 & 2033
- Table 61: Turkey Hip and Joint Supplement Revenue (million) Forecast, by Application 2020 & 2033
- Table 62: Turkey Hip and Joint Supplement Volume (K) Forecast, by Application 2020 & 2033
- Table 63: Israel Hip and Joint Supplement Revenue (million) Forecast, by Application 2020 & 2033
- Table 64: Israel Hip and Joint Supplement Volume (K) Forecast, by Application 2020 & 2033
- Table 65: GCC Hip and Joint Supplement Revenue (million) Forecast, by Application 2020 & 2033
- Table 66: GCC Hip and Joint Supplement Volume (K) Forecast, by Application 2020 & 2033
- Table 67: North Africa Hip and Joint Supplement Revenue (million) Forecast, by Application 2020 & 2033
- Table 68: North Africa Hip and Joint Supplement Volume (K) Forecast, by Application 2020 & 2033
- Table 69: South Africa Hip and Joint Supplement Revenue (million) Forecast, by Application 2020 & 2033
- Table 70: South Africa Hip and Joint Supplement Volume (K) Forecast, by Application 2020 & 2033
- Table 71: Rest of Middle East & Africa Hip and Joint Supplement Revenue (million) Forecast, by Application 2020 & 2033
- Table 72: Rest of Middle East & Africa Hip and Joint Supplement Volume (K) Forecast, by Application 2020 & 2033
- Table 73: Global Hip and Joint Supplement Revenue million Forecast, by Application 2020 & 2033
- Table 74: Global Hip and Joint Supplement Volume K Forecast, by Application 2020 & 2033
- Table 75: Global Hip and Joint Supplement Revenue million Forecast, by Types 2020 & 2033
- Table 76: Global Hip and Joint Supplement Volume K Forecast, by Types 2020 & 2033
- Table 77: Global Hip and Joint Supplement Revenue million Forecast, by Country 2020 & 2033
- Table 78: Global Hip and Joint Supplement Volume K Forecast, by Country 2020 & 2033
- Table 79: China Hip and Joint Supplement Revenue (million) Forecast, by Application 2020 & 2033
- Table 80: China Hip and Joint Supplement Volume (K) Forecast, by Application 2020 & 2033
- Table 81: India Hip and Joint Supplement Revenue (million) Forecast, by Application 2020 & 2033
- Table 82: India Hip and Joint Supplement Volume (K) Forecast, by Application 2020 & 2033
- Table 83: Japan Hip and Joint Supplement Revenue (million) Forecast, by Application 2020 & 2033
- Table 84: Japan Hip and Joint Supplement Volume (K) Forecast, by Application 2020 & 2033
- Table 85: South Korea Hip and Joint Supplement Revenue (million) Forecast, by Application 2020 & 2033
- Table 86: South Korea Hip and Joint Supplement Volume (K) Forecast, by Application 2020 & 2033
- Table 87: ASEAN Hip and Joint Supplement Revenue (million) Forecast, by Application 2020 & 2033
- Table 88: ASEAN Hip and Joint Supplement Volume (K) Forecast, by Application 2020 & 2033
- Table 89: Oceania Hip and Joint Supplement Revenue (million) Forecast, by Application 2020 & 2033
- Table 90: Oceania Hip and Joint Supplement Volume (K) Forecast, by Application 2020 & 2033
- Table 91: Rest of Asia Pacific Hip and Joint Supplement Revenue (million) Forecast, by Application 2020 & 2033
- Table 92: Rest of Asia Pacific Hip and Joint Supplement Volume (K) Forecast, by Application 2020 & 2033
Frequently Asked Questions
1. What is the projected Compound Annual Growth Rate (CAGR) of the Hip and Joint Supplement?
The projected CAGR is approximately 6.5%.
2. Which companies are prominent players in the Hip and Joint Supplement?
Key companies in the market include Mars, Nestle Purina, EverRoot, Milk-Bone, Blue Buffalo, VetIQ, JPK Nutri, maxxipaws, Unicharm, OSCAR Pet Foods, Affinity Petcare, MoonShine, Yantai China Pet Foods, GREENIES, Wagg, Petpal Tech, DogKind, Pet Treats, Pet Chews.
3. What are the main segments of the Hip and Joint Supplement?
The market segments include Application, Types.
4. Can you provide details about the market size?
The market size is estimated to be USD 1913.5 million as of 2022.
5. What are some drivers contributing to market growth?
N/A
6. What are the notable trends driving market growth?
N/A
7. Are there any restraints impacting market growth?
N/A
8. Can you provide examples of recent developments in the market?
N/A
9. What pricing options are available for accessing the report?
Pricing options include single-user, multi-user, and enterprise licenses priced at USD 3350.00, USD 5025.00, and USD 6700.00 respectively.
10. Is the market size provided in terms of value or volume?
The market size is provided in terms of value, measured in million and volume, measured in K.
11. Are there any specific market keywords associated with the report?
Yes, the market keyword associated with the report is "Hip and Joint Supplement," which aids in identifying and referencing the specific market segment covered.
12. How do I determine which pricing option suits my needs best?
The pricing options vary based on user requirements and access needs. Individual users may opt for single-user licenses, while businesses requiring broader access may choose multi-user or enterprise licenses for cost-effective access to the report.
13. Are there any additional resources or data provided in the Hip and Joint Supplement report?
While the report offers comprehensive insights, it's advisable to review the specific contents or supplementary materials provided to ascertain if additional resources or data are available.
14. How can I stay updated on further developments or reports in the Hip and Joint Supplement?
To stay informed about further developments, trends, and reports in the Hip and Joint Supplement, consider subscribing to industry newsletters, following relevant companies and organizations, or regularly checking reputable industry news sources and publications.
Methodology
Step 1 - Identification of Relevant Samples Size from Population Database


Step 2 - Approaches for Defining Global Market Size (Value, Volume* & Price*)

Note*: In applicable scenarios
Step 3 - Data Sources
Primary Research
- Web Analytics
- Survey Reports
- Research Institute
- Latest Research Reports
- Opinion Leaders
Secondary Research
- Annual Reports
- White Paper
- Latest Press Release
- Industry Association
- Paid Database
- Investor Presentations

Step 4 - Data Triangulation
Involves using different sources of information in order to increase the validity of a study
These sources are likely to be stakeholders in a program - participants, other researchers, program staff, other community members, and so on.
Then we put all data in single framework & apply various statistical tools to find out the dynamic on the market.
During the analysis stage, feedback from the stakeholder groups would be compared to determine areas of agreement as well as areas of divergence

