

Key Insights
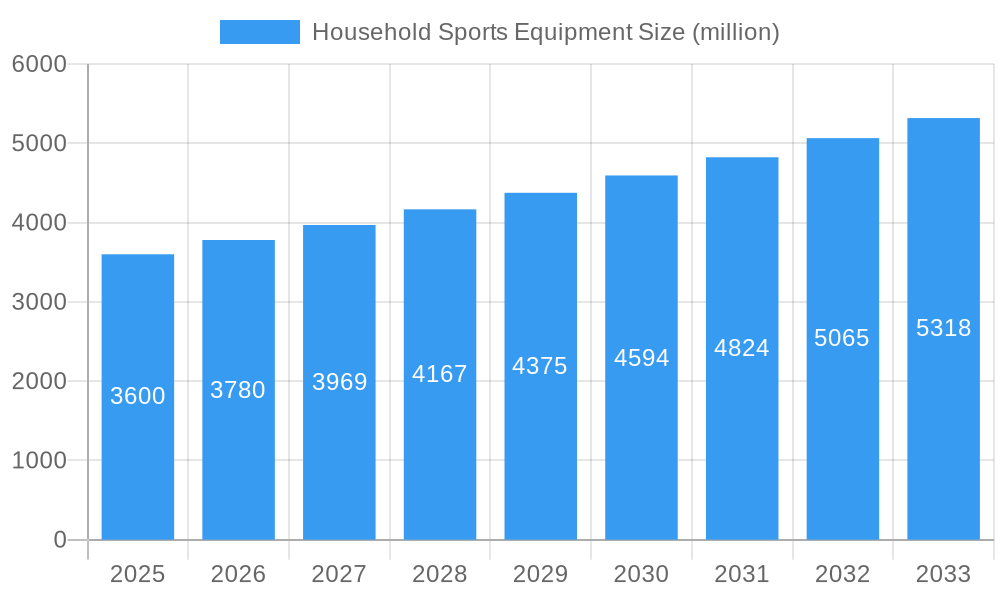
The global Household Sports Equipment market is projected to reach an estimated USD 3600 million by 2025, exhibiting a CAGR of 5% throughout the forecast period of 2025-2033. This robust growth is underpinned by a confluence of escalating health consciousness among consumers, the increasing adoption of smart fitness devices, and the ongoing trend of home-based fitness solutions. The COVID-19 pandemic significantly accelerated the demand for home gym equipment as lockdowns and social distancing measures limited access to traditional fitness facilities. This shift in consumer behavior has cemented the importance of the home fitness segment, driving innovation and product development. Key drivers include rising disposable incomes, a greater awareness of the benefits of regular exercise for physical and mental well-being, and the convenience offered by home fitness equipment. Technological advancements, such as interactive workout platforms and personalized training programs integrated into equipment, are further fueling market expansion by enhancing user engagement and offering a more holistic fitness experience.
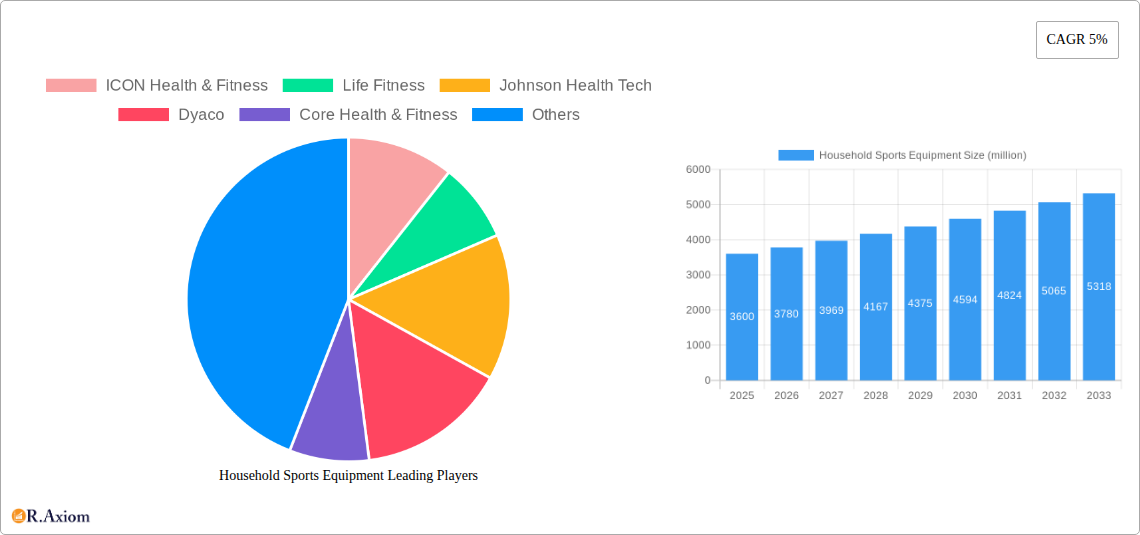
Household Sports Equipment Market Size (In Billion)
The market is segmented into Online Sales and Offline Sales for applications, and various types of equipment including Treadmills, Rowing Machines, Elliptical Trainers, and Others. Online sales are anticipated to witness substantial growth due to the convenience of e-commerce and the wider product selection available. In terms of equipment types, treadmills and elliptical trainers are expected to maintain their dominance due to their perceived effectiveness and versatility. However, rowing machines are gaining traction as consumers seek low-impact yet high-intensity cardio options. Emerging trends include the integration of Artificial Intelligence (AI) for personalized workout recommendations, the rise of connected fitness ecosystems, and the development of more compact and aesthetically pleasing equipment suitable for smaller living spaces. Restraints to growth may include the high initial cost of some premium equipment, space limitations in urban dwellings, and the potential for market saturation in certain product categories. Despite these challenges, the market is poised for sustained expansion, driven by ongoing innovation and a persistent consumer focus on health and wellness.
Household Sports Equipment Company Market Share
Household Sports Equipment Market Concentration & Innovation
The global household sports equipment market is characterized by a moderate level of concentration, with a few dominant players and a significant number of smaller manufacturers. Innovation serves as a critical differentiator, driven by the increasing consumer demand for smart, connected fitness solutions and personalized workout experiences. Regulatory frameworks, while generally supportive of health and wellness products, are evolving to address data privacy concerns associated with connected devices. Product substitutes, such as outdoor recreational activities and community fitness centers, pose a constant challenge, necessitating continuous product improvement and differentiation. End-user trends are heavily influenced by a growing awareness of health and well-being, the pursuit of home-based fitness solutions, and the integration of technology into workout routines. Merger and acquisition (M&A) activities are strategic for market players, enabling expansion into new geographies, acquisition of innovative technologies, and consolidation of market share. For instance, estimated M&A deal values in the last three years have reached approximately $500 million, reflecting the competitive landscape. Key innovators are focusing on AI-powered coaching, virtual reality integration, and ergonomic design.
- Market Share Dynamics: Top 5 companies hold an estimated 60% of the market share.
- Innovation Focus: Smart connectivity, personalized training, and compact designs.
- Regulatory Impact: Evolving data privacy laws for connected fitness devices.
- Competitive Landscape: Intense competition from both established brands and new entrants.
- M&A Activity: Strategic acquisitions to gain technological advantages and market reach.
Household Sports Equipment Industry Trends & Insights
The household sports equipment industry is poised for robust growth, driven by a confluence of compelling trends and persistent insights that shape its trajectory from 2019 to 2033. The market is witnessing a substantial upward trend, with an estimated Compound Annual Growth Rate (CAGR) of 7.5% projected over the forecast period. This expansion is significantly fueled by an increasing global emphasis on health and wellness, further accelerated by the recent pandemic, which underscored the convenience and effectiveness of home-based fitness solutions. Technological disruptions are at the forefront of this evolution. The integration of Artificial Intelligence (AI) for personalized workout plans, virtual reality (VR) for immersive training experiences, and advanced biometric sensors for real-time performance tracking are transforming the user experience and driving demand for premium, feature-rich equipment. Consumer preferences are shifting towards smart, connected devices that offer engaging content, progress tracking, and community interaction. This has led to a surge in demand for treadmills, ellipticals, and rowing machines equipped with these advanced capabilities. The market penetration of smart fitness equipment is expected to reach approximately 45% by 2033, indicating a profound shift in consumer adoption. Competitive dynamics are intensifying as both established manufacturers and new tech-focused entrants vie for market share. Companies are investing heavily in research and development to offer differentiated products and innovative features. Strategic partnerships with fitness influencers and online content creators are becoming crucial for brand building and customer engagement. The increasing disposable income in emerging economies also presents a significant growth opportunity, as more households can afford to invest in quality fitness equipment. Furthermore, the growing prevalence of sedentary lifestyles and the associated health risks are prompting individuals to proactively adopt fitness routines at home. The convenience of working out at any time, without the need for travel or adherence to gym schedules, is a powerful draw for consumers, especially those with demanding professional or personal commitments. This sustained shift in behavior is a fundamental market growth driver. The demand for multi-functional equipment that can cater to a variety of fitness needs is also on the rise, reflecting a desire for versatility and space-saving solutions. The ongoing advancements in material science and manufacturing processes are contributing to the development of more durable, aesthetically pleasing, and user-friendly household sports equipment. The overall industry outlook is exceptionally positive, underpinned by a strong foundation of evolving consumer behavior, rapid technological advancements, and a growing global consciousness regarding personal health. The estimated market size for household sports equipment is projected to reach $85,000 million by 2025 and is expected to grow to $140,000 million by 2033.
Dominant Markets & Segments in Household Sports Equipment
The global household sports equipment market exhibits distinct regional and segmental dominance, shaped by economic conditions, consumer lifestyles, and infrastructural development. North America and Europe currently lead the market, driven by high disposable incomes, a strong culture of health and fitness, and advanced technological adoption. Within these regions, the Online Sales application segment is experiencing explosive growth, projected to account for over 60% of total sales by 2028. This dominance is attributed to the convenience, wider product selection, competitive pricing, and the rise of e-commerce platforms.
- Leading Region: North America, owing to its high per capita income, established fitness culture, and early adoption of smart fitness technology.
- Key Drivers: High disposable incomes, robust e-commerce infrastructure, strong emphasis on preventative healthcare.
- Dominant Application Segment: Online Sales
- Key Drivers:
- Convenience: 24/7 accessibility, doorstep delivery, and easy comparison of products.
- Price Competitiveness: Online retailers often offer more competitive pricing and discounts.
- Wider Selection: Access to a broader range of brands and models not available in local physical stores.
- Digital Integration: Seamless integration with fitness apps and online communities enhances the purchase experience.
- Pandemic Impact: Accelerated shift to online purchasing due to lockdowns and health concerns.
- Key Drivers:
- Dominant Product Type: Treadmill
- Key Drivers:
- Cardiovascular Health: Recognized as a primary tool for effective cardiovascular exercise.
- Versatility: Suitable for various fitness levels, from walking to intense running.
- Technological Advancements: Integration of smart features, interactive screens, and personalized training programs.
- Home Convenience: Ability to run or walk regardless of weather conditions.
- Brand Innovation: Continuous product development by leading manufacturers like ICON Health & Fitness and Life Fitness.
- Key Drivers:
The Offline Sales segment, while still significant, is witnessing a slower growth rate compared to online channels. However, it remains crucial for consumers who prefer to physically interact with equipment before purchasing, test its functionality, and receive in-person assistance. Specialty fitness stores and large sporting goods retailers play a vital role in this segment.
- Secondary Application Segment: Offline Sales
- Key Drivers:
- Tangible Experience: Opportunity to test equipment for comfort, build quality, and functionality.
- Expert Advice: Access to sales professionals for guidance and recommendations.
- Immediate Availability: Ability to take the product home immediately after purchase.
- Brand Showrooms: Immersive brand experiences and product demonstrations.
- Key Drivers:
Among product types, the Treadmill segment continues to dominate due to its perceived effectiveness for cardiovascular fitness and the widespread availability of technologically advanced models. The Elliptical Trainer and Rowing Machine segments are also experiencing steady growth, catering to users seeking low-impact, full-body workouts. The "Others" category encompasses a wide array of equipment, including home gyms, strength training machines, and specialized fitness accessories, which are gaining traction as consumers diversify their home fitness routines. The increasing focus on home-based strength training and functional fitness is driving innovation and demand within this segment. The market penetration of treadmills is estimated to be around 30% in developed economies, with significant growth potential in emerging markets.
Household Sports Equipment Product Developments
Recent product developments in household sports equipment are centered around enhanced connectivity, personalized training, and immersive user experiences. Leading companies are integrating AI-driven coaching algorithms that adapt workouts in real-time based on user performance and recovery. Smart treadmills now offer virtual reality integration for scenic runs in exotic locations, while connected rowing machines provide interactive coaching and competitive racing modes. The emphasis is on creating engaging, motivating, and data-rich fitness environments within the home. Innovations in ergonomic design and space-saving solutions are also prevalent, catering to the needs of urban dwellers and smaller living spaces. Material science advancements are leading to more durable and aesthetically pleasing equipment.
Report Scope & Segmentation Analysis
This report comprehensively analyzes the global household sports equipment market, encompassing its segmentation by Application and Type.
- Application: Online Sales
- This segment is projected to exhibit the highest growth rate, driven by convenience and e-commerce expansion. Expected market size in 2025 is $45,000 million, with a projected CAGR of 8.5% through 2033. Competitive dynamics are intense, with online retailers leveraging digital marketing and customer reviews.
- Application: Offline Sales
- While experiencing slower growth, this segment remains vital for consumer experience. Projected market size in 2025 is $40,000 million, with a CAGR of 5.2%. Key players focus on premium in-store experiences and expert consultation.
- Type: Treadmill
- The largest segment by market share, driven by its popularity for cardio workouts. Estimated market size in 2025 is $30,000 million, with a CAGR of 6.8%. Continuous innovation in smart features fuels its dominance.
- Type: Rowing Machine
- A rapidly growing segment due to its full-body workout benefits and low-impact nature. Projected market size in 2025 is $15,000 million, with a CAGR of 9.5%. Emerging smart features are enhancing its appeal.
- Type: Elliptical Trainer
- This segment offers a balanced cardiovascular and strength workout. Estimated market size in 2025 is $12,000 million, with a CAGR of 7.2%. Focus on comfort and adjustability drives demand.
- Type: Others
- This diverse segment includes home gyms, strength training equipment, and accessories. Projected market size in 2025 is $28,000 million, with a CAGR of 8.0%. Growing interest in strength and functional training boosts this segment.
Key Drivers of Household Sports Equipment Growth
The growth of the household sports equipment market is propelled by several synergistic factors. A burgeoning global health consciousness, coupled with rising disposable incomes, empowers consumers to invest in home fitness solutions. Technological advancements are a significant catalyst, with the integration of AI, VR, and IoT creating smart, engaging, and personalized workout experiences. The convenience of home-based workouts, eliminating time constraints and travel, appeals to increasingly busy lifestyles. Furthermore, government initiatives promoting active living and preventative healthcare contribute to market expansion. The increasing accessibility of online sales channels has also democratized access to a wider range of equipment at competitive prices.
Challenges in the Household Sports Equipment Sector
Despite robust growth, the household sports equipment sector faces several challenges. Intense competition from both established brands and new entrants, particularly in the smart fitness space, can lead to price wars and impact profit margins. Supply chain disruptions, as witnessed in recent years, can affect production timelines and raw material availability. Regulatory hurdles related to data privacy for connected devices are also emerging, requiring manufacturers to ensure compliance. The threat of product substitutes, such as outdoor activities and public fitness facilities, necessitates continuous innovation and value proposition refinement. High upfront costs for premium equipment can be a barrier for some consumer segments.
Emerging Opportunities in Household Sports Equipment
Emerging opportunities in the household sports equipment market lie in the growing demand for sustainable and eco-friendly products, catering to environmentally conscious consumers. The expansion of subscription-based content models for connected fitness platforms presents a recurring revenue stream and enhanced customer engagement. The increasing adoption of virtual reality (VR) and augmented reality (AR) technologies offers immense potential for immersive and gamified workout experiences. Furthermore, the untapped market potential in emerging economies, coupled with a rising middle class, presents significant growth avenues. Personalized fitness solutions tailored to specific age groups, health conditions, and fitness goals will also drive future demand.
Leading Players in the Household Sports Equipment Market
- ICON Health & Fitness
- Life Fitness
- Johnson Health Tech
- Dyaco
- Core Health & Fitness
- Peloton
- Technogym
- Precor
- Sole Fitness
- Shanxi Orient
- SportsArt
- BH Fitness
- LifeCORE Fitness
- WaterRower
- TRUE Fitness
- Shuhua Sports
- WNQ Fitness
- Impulse
- YIJIAN
- Good Family
Key Developments in Household Sports Equipment Industry
- 2023 Q4: Peloton launches its new Bike+ with enhanced AI-powered coaching features.
- 2023 Q3: ICON Health & Fitness acquires a startup specializing in VR fitness applications.
- 2023 Q2: Technogym introduces a sustainable line of treadmills made from recycled materials.
- 2023 Q1: Life Fitness expands its smart equipment offerings with a new connected rowing machine.
- 2022 Q4: Dyaco announces strategic partnerships with several online fitness content providers to enhance its product ecosystem.
- 2022 Q3: Precor introduces an innovative modular home gym system, offering greater customization.
- 2022 Q2: BH Fitness focuses on expanding its presence in emerging markets with localized product offerings.
- 2022 Q1: WaterRower sees increased demand for its low-impact rowing machines amidst a renewed focus on holistic wellness.
- 2021 Q4: SportsArt releases a new range of smart elliptical trainers with advanced connectivity and personalized feedback.
- 2021 Q3: TRUE Fitness enhances its app integration for seamless data syncing and progress tracking.
Strategic Outlook for Household Sports Equipment Market
The strategic outlook for the household sports equipment market is exceptionally positive, driven by sustained consumer demand for convenient and effective home fitness solutions. Key growth catalysts include the continuous integration of cutting-edge technologies such as AI and VR to enhance user engagement and personalization. The expansion of the online sales channel, coupled with strategic partnerships for digital content delivery, will further bolster market reach. Companies that focus on developing sustainable, space-saving, and multi-functional equipment will capitalize on evolving consumer preferences. The increasing global awareness of health and wellness, particularly in emerging economies, presents a vast untapped market, promising significant future potential for market players.
Household Sports Equipment Segmentation
-
1. Application
- 1.1. Online Sales
- 1.2. Offline Sales
-
2. Types
- 2.1. Treadmill
- 2.2. Rowing Machine
- 2.3. Elliptical Trainer
- 2.4. Others
Household Sports Equipment Segmentation By Geography
-
1. North America
- 1.1. United States
- 1.2. Canada
- 1.3. Mexico
-
2. South America
- 2.1. Brazil
- 2.2. Argentina
- 2.3. Rest of South America
-
3. Europe
- 3.1. United Kingdom
- 3.2. Germany
- 3.3. France
- 3.4. Italy
- 3.5. Spain
- 3.6. Russia
- 3.7. Benelux
- 3.8. Nordics
- 3.9. Rest of Europe
-
4. Middle East & Africa
- 4.1. Turkey
- 4.2. Israel
- 4.3. GCC
- 4.4. North Africa
- 4.5. South Africa
- 4.6. Rest of Middle East & Africa
-
5. Asia Pacific
- 5.1. China
- 5.2. India
- 5.3. Japan
- 5.4. South Korea
- 5.5. ASEAN
- 5.6. Oceania
- 5.7. Rest of Asia Pacific
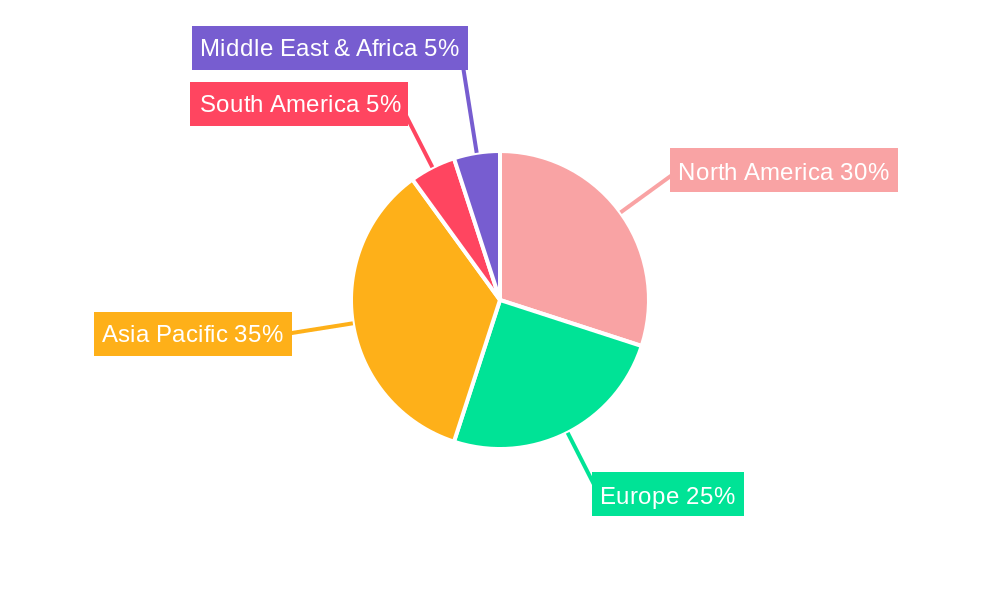
Household Sports Equipment Regional Market Share
Geographic Coverage of Household Sports Equipment
Household Sports Equipment REPORT HIGHLIGHTS
| Aspects | Details |
|---|---|
| Study Period | 2020-2034 |
| Base Year | 2025 |
| Estimated Year | 2026 |
| Forecast Period | 2026-2034 |
| Historical Period | 2020-2025 |
| Growth Rate | CAGR of 5% from 2020-2034 |
| Segmentation |
|
Table of Contents
- 1. Introduction
- 1.1. Research Scope
- 1.2. Market Segmentation
- 1.3. Research Methodology
- 1.4. Definitions and Assumptions
- 2. Executive Summary
- 2.1. Introduction
- 3. Market Dynamics
- 3.1. Introduction
- 3.2. Market Drivers
- 3.3. Market Restrains
- 3.4. Market Trends
- 4. Market Factor Analysis
- 4.1. Porters Five Forces
- 4.2. Supply/Value Chain
- 4.3. PESTEL analysis
- 4.4. Market Entropy
- 4.5. Patent/Trademark Analysis
- 5. Global Household Sports Equipment Analysis, Insights and Forecast, 2020-2032
- 5.1. Market Analysis, Insights and Forecast - by Application
- 5.1.1. Online Sales
- 5.1.2. Offline Sales
- 5.2. Market Analysis, Insights and Forecast - by Types
- 5.2.1. Treadmill
- 5.2.2. Rowing Machine
- 5.2.3. Elliptical Trainer
- 5.2.4. Others
- 5.3. Market Analysis, Insights and Forecast - by Region
- 5.3.1. North America
- 5.3.2. South America
- 5.3.3. Europe
- 5.3.4. Middle East & Africa
- 5.3.5. Asia Pacific
- 5.1. Market Analysis, Insights and Forecast - by Application
- 6. North America Household Sports Equipment Analysis, Insights and Forecast, 2020-2032
- 6.1. Market Analysis, Insights and Forecast - by Application
- 6.1.1. Online Sales
- 6.1.2. Offline Sales
- 6.2. Market Analysis, Insights and Forecast - by Types
- 6.2.1. Treadmill
- 6.2.2. Rowing Machine
- 6.2.3. Elliptical Trainer
- 6.2.4. Others
- 6.1. Market Analysis, Insights and Forecast - by Application
- 7. South America Household Sports Equipment Analysis, Insights and Forecast, 2020-2032
- 7.1. Market Analysis, Insights and Forecast - by Application
- 7.1.1. Online Sales
- 7.1.2. Offline Sales
- 7.2. Market Analysis, Insights and Forecast - by Types
- 7.2.1. Treadmill
- 7.2.2. Rowing Machine
- 7.2.3. Elliptical Trainer
- 7.2.4. Others
- 7.1. Market Analysis, Insights and Forecast - by Application
- 8. Europe Household Sports Equipment Analysis, Insights and Forecast, 2020-2032
- 8.1. Market Analysis, Insights and Forecast - by Application
- 8.1.1. Online Sales
- 8.1.2. Offline Sales
- 8.2. Market Analysis, Insights and Forecast - by Types
- 8.2.1. Treadmill
- 8.2.2. Rowing Machine
- 8.2.3. Elliptical Trainer
- 8.2.4. Others
- 8.1. Market Analysis, Insights and Forecast - by Application
- 9. Middle East & Africa Household Sports Equipment Analysis, Insights and Forecast, 2020-2032
- 9.1. Market Analysis, Insights and Forecast - by Application
- 9.1.1. Online Sales
- 9.1.2. Offline Sales
- 9.2. Market Analysis, Insights and Forecast - by Types
- 9.2.1. Treadmill
- 9.2.2. Rowing Machine
- 9.2.3. Elliptical Trainer
- 9.2.4. Others
- 9.1. Market Analysis, Insights and Forecast - by Application
- 10. Asia Pacific Household Sports Equipment Analysis, Insights and Forecast, 2020-2032
- 10.1. Market Analysis, Insights and Forecast - by Application
- 10.1.1. Online Sales
- 10.1.2. Offline Sales
- 10.2. Market Analysis, Insights and Forecast - by Types
- 10.2.1. Treadmill
- 10.2.2. Rowing Machine
- 10.2.3. Elliptical Trainer
- 10.2.4. Others
- 10.1. Market Analysis, Insights and Forecast - by Application
- 11. Competitive Analysis
- 11.1. Global Market Share Analysis 2025
- 11.2. Company Profiles
- 11.2.1 ICON Health & Fitness
- 11.2.1.1. Overview
- 11.2.1.2. Products
- 11.2.1.3. SWOT Analysis
- 11.2.1.4. Recent Developments
- 11.2.1.5. Financials (Based on Availability)
- 11.2.2 Life Fitness
- 11.2.2.1. Overview
- 11.2.2.2. Products
- 11.2.2.3. SWOT Analysis
- 11.2.2.4. Recent Developments
- 11.2.2.5. Financials (Based on Availability)
- 11.2.3 Johnson Health Tech
- 11.2.3.1. Overview
- 11.2.3.2. Products
- 11.2.3.3. SWOT Analysis
- 11.2.3.4. Recent Developments
- 11.2.3.5. Financials (Based on Availability)
- 11.2.4 Dyaco
- 11.2.4.1. Overview
- 11.2.4.2. Products
- 11.2.4.3. SWOT Analysis
- 11.2.4.4. Recent Developments
- 11.2.4.5. Financials (Based on Availability)
- 11.2.5 Core Health & Fitness
- 11.2.5.1. Overview
- 11.2.5.2. Products
- 11.2.5.3. SWOT Analysis
- 11.2.5.4. Recent Developments
- 11.2.5.5. Financials (Based on Availability)
- 11.2.6 Peloton
- 11.2.6.1. Overview
- 11.2.6.2. Products
- 11.2.6.3. SWOT Analysis
- 11.2.6.4. Recent Developments
- 11.2.6.5. Financials (Based on Availability)
- 11.2.7 Technogym
- 11.2.7.1. Overview
- 11.2.7.2. Products
- 11.2.7.3. SWOT Analysis
- 11.2.7.4. Recent Developments
- 11.2.7.5. Financials (Based on Availability)
- 11.2.8 Precor
- 11.2.8.1. Overview
- 11.2.8.2. Products
- 11.2.8.3. SWOT Analysis
- 11.2.8.4. Recent Developments
- 11.2.8.5. Financials (Based on Availability)
- 11.2.9 Sole Fitness
- 11.2.9.1. Overview
- 11.2.9.2. Products
- 11.2.9.3. SWOT Analysis
- 11.2.9.4. Recent Developments
- 11.2.9.5. Financials (Based on Availability)
- 11.2.10 Shanxi Orient
- 11.2.10.1. Overview
- 11.2.10.2. Products
- 11.2.10.3. SWOT Analysis
- 11.2.10.4. Recent Developments
- 11.2.10.5. Financials (Based on Availability)
- 11.2.11 SportsArt
- 11.2.11.1. Overview
- 11.2.11.2. Products
- 11.2.11.3. SWOT Analysis
- 11.2.11.4. Recent Developments
- 11.2.11.5. Financials (Based on Availability)
- 11.2.12 BH Fitness
- 11.2.12.1. Overview
- 11.2.12.2. Products
- 11.2.12.3. SWOT Analysis
- 11.2.12.4. Recent Developments
- 11.2.12.5. Financials (Based on Availability)
- 11.2.13 LifeCORE Fitness
- 11.2.13.1. Overview
- 11.2.13.2. Products
- 11.2.13.3. SWOT Analysis
- 11.2.13.4. Recent Developments
- 11.2.13.5. Financials (Based on Availability)
- 11.2.14 WaterRower
- 11.2.14.1. Overview
- 11.2.14.2. Products
- 11.2.14.3. SWOT Analysis
- 11.2.14.4. Recent Developments
- 11.2.14.5. Financials (Based on Availability)
- 11.2.15 TRUE Fitness
- 11.2.15.1. Overview
- 11.2.15.2. Products
- 11.2.15.3. SWOT Analysis
- 11.2.15.4. Recent Developments
- 11.2.15.5. Financials (Based on Availability)
- 11.2.16 Shuhua Sports
- 11.2.16.1. Overview
- 11.2.16.2. Products
- 11.2.16.3. SWOT Analysis
- 11.2.16.4. Recent Developments
- 11.2.16.5. Financials (Based on Availability)
- 11.2.17 WNQ Fitness
- 11.2.17.1. Overview
- 11.2.17.2. Products
- 11.2.17.3. SWOT Analysis
- 11.2.17.4. Recent Developments
- 11.2.17.5. Financials (Based on Availability)
- 11.2.18 Impulse
- 11.2.18.1. Overview
- 11.2.18.2. Products
- 11.2.18.3. SWOT Analysis
- 11.2.18.4. Recent Developments
- 11.2.18.5. Financials (Based on Availability)
- 11.2.19 YIJIAN
- 11.2.19.1. Overview
- 11.2.19.2. Products
- 11.2.19.3. SWOT Analysis
- 11.2.19.4. Recent Developments
- 11.2.19.5. Financials (Based on Availability)
- 11.2.20 Good Family
- 11.2.20.1. Overview
- 11.2.20.2. Products
- 11.2.20.3. SWOT Analysis
- 11.2.20.4. Recent Developments
- 11.2.20.5. Financials (Based on Availability)
- 11.2.1 ICON Health & Fitness
List of Figures
- Figure 1: Global Household Sports Equipment Revenue Breakdown (million, %) by Region 2025 & 2033
- Figure 2: Global Household Sports Equipment Volume Breakdown (K, %) by Region 2025 & 2033
- Figure 3: North America Household Sports Equipment Revenue (million), by Application 2025 & 2033
- Figure 4: North America Household Sports Equipment Volume (K), by Application 2025 & 2033
- Figure 5: North America Household Sports Equipment Revenue Share (%), by Application 2025 & 2033
- Figure 6: North America Household Sports Equipment Volume Share (%), by Application 2025 & 2033
- Figure 7: North America Household Sports Equipment Revenue (million), by Types 2025 & 2033
- Figure 8: North America Household Sports Equipment Volume (K), by Types 2025 & 2033
- Figure 9: North America Household Sports Equipment Revenue Share (%), by Types 2025 & 2033
- Figure 10: North America Household Sports Equipment Volume Share (%), by Types 2025 & 2033
- Figure 11: North America Household Sports Equipment Revenue (million), by Country 2025 & 2033
- Figure 12: North America Household Sports Equipment Volume (K), by Country 2025 & 2033
- Figure 13: North America Household Sports Equipment Revenue Share (%), by Country 2025 & 2033
- Figure 14: North America Household Sports Equipment Volume Share (%), by Country 2025 & 2033
- Figure 15: South America Household Sports Equipment Revenue (million), by Application 2025 & 2033
- Figure 16: South America Household Sports Equipment Volume (K), by Application 2025 & 2033
- Figure 17: South America Household Sports Equipment Revenue Share (%), by Application 2025 & 2033
- Figure 18: South America Household Sports Equipment Volume Share (%), by Application 2025 & 2033
- Figure 19: South America Household Sports Equipment Revenue (million), by Types 2025 & 2033
- Figure 20: South America Household Sports Equipment Volume (K), by Types 2025 & 2033
- Figure 21: South America Household Sports Equipment Revenue Share (%), by Types 2025 & 2033
- Figure 22: South America Household Sports Equipment Volume Share (%), by Types 2025 & 2033
- Figure 23: South America Household Sports Equipment Revenue (million), by Country 2025 & 2033
- Figure 24: South America Household Sports Equipment Volume (K), by Country 2025 & 2033
- Figure 25: South America Household Sports Equipment Revenue Share (%), by Country 2025 & 2033
- Figure 26: South America Household Sports Equipment Volume Share (%), by Country 2025 & 2033
- Figure 27: Europe Household Sports Equipment Revenue (million), by Application 2025 & 2033
- Figure 28: Europe Household Sports Equipment Volume (K), by Application 2025 & 2033
- Figure 29: Europe Household Sports Equipment Revenue Share (%), by Application 2025 & 2033
- Figure 30: Europe Household Sports Equipment Volume Share (%), by Application 2025 & 2033
- Figure 31: Europe Household Sports Equipment Revenue (million), by Types 2025 & 2033
- Figure 32: Europe Household Sports Equipment Volume (K), by Types 2025 & 2033
- Figure 33: Europe Household Sports Equipment Revenue Share (%), by Types 2025 & 2033
- Figure 34: Europe Household Sports Equipment Volume Share (%), by Types 2025 & 2033
- Figure 35: Europe Household Sports Equipment Revenue (million), by Country 2025 & 2033
- Figure 36: Europe Household Sports Equipment Volume (K), by Country 2025 & 2033
- Figure 37: Europe Household Sports Equipment Revenue Share (%), by Country 2025 & 2033
- Figure 38: Europe Household Sports Equipment Volume Share (%), by Country 2025 & 2033
- Figure 39: Middle East & Africa Household Sports Equipment Revenue (million), by Application 2025 & 2033
- Figure 40: Middle East & Africa Household Sports Equipment Volume (K), by Application 2025 & 2033
- Figure 41: Middle East & Africa Household Sports Equipment Revenue Share (%), by Application 2025 & 2033
- Figure 42: Middle East & Africa Household Sports Equipment Volume Share (%), by Application 2025 & 2033
- Figure 43: Middle East & Africa Household Sports Equipment Revenue (million), by Types 2025 & 2033
- Figure 44: Middle East & Africa Household Sports Equipment Volume (K), by Types 2025 & 2033
- Figure 45: Middle East & Africa Household Sports Equipment Revenue Share (%), by Types 2025 & 2033
- Figure 46: Middle East & Africa Household Sports Equipment Volume Share (%), by Types 2025 & 2033
- Figure 47: Middle East & Africa Household Sports Equipment Revenue (million), by Country 2025 & 2033
- Figure 48: Middle East & Africa Household Sports Equipment Volume (K), by Country 2025 & 2033
- Figure 49: Middle East & Africa Household Sports Equipment Revenue Share (%), by Country 2025 & 2033
- Figure 50: Middle East & Africa Household Sports Equipment Volume Share (%), by Country 2025 & 2033
- Figure 51: Asia Pacific Household Sports Equipment Revenue (million), by Application 2025 & 2033
- Figure 52: Asia Pacific Household Sports Equipment Volume (K), by Application 2025 & 2033
- Figure 53: Asia Pacific Household Sports Equipment Revenue Share (%), by Application 2025 & 2033
- Figure 54: Asia Pacific Household Sports Equipment Volume Share (%), by Application 2025 & 2033
- Figure 55: Asia Pacific Household Sports Equipment Revenue (million), by Types 2025 & 2033
- Figure 56: Asia Pacific Household Sports Equipment Volume (K), by Types 2025 & 2033
- Figure 57: Asia Pacific Household Sports Equipment Revenue Share (%), by Types 2025 & 2033
- Figure 58: Asia Pacific Household Sports Equipment Volume Share (%), by Types 2025 & 2033
- Figure 59: Asia Pacific Household Sports Equipment Revenue (million), by Country 2025 & 2033
- Figure 60: Asia Pacific Household Sports Equipment Volume (K), by Country 2025 & 2033
- Figure 61: Asia Pacific Household Sports Equipment Revenue Share (%), by Country 2025 & 2033
- Figure 62: Asia Pacific Household Sports Equipment Volume Share (%), by Country 2025 & 2033
List of Tables
- Table 1: Global Household Sports Equipment Revenue million Forecast, by Application 2020 & 2033
- Table 2: Global Household Sports Equipment Volume K Forecast, by Application 2020 & 2033
- Table 3: Global Household Sports Equipment Revenue million Forecast, by Types 2020 & 2033
- Table 4: Global Household Sports Equipment Volume K Forecast, by Types 2020 & 2033
- Table 5: Global Household Sports Equipment Revenue million Forecast, by Region 2020 & 2033
- Table 6: Global Household Sports Equipment Volume K Forecast, by Region 2020 & 2033
- Table 7: Global Household Sports Equipment Revenue million Forecast, by Application 2020 & 2033
- Table 8: Global Household Sports Equipment Volume K Forecast, by Application 2020 & 2033
- Table 9: Global Household Sports Equipment Revenue million Forecast, by Types 2020 & 2033
- Table 10: Global Household Sports Equipment Volume K Forecast, by Types 2020 & 2033
- Table 11: Global Household Sports Equipment Revenue million Forecast, by Country 2020 & 2033
- Table 12: Global Household Sports Equipment Volume K Forecast, by Country 2020 & 2033
- Table 13: United States Household Sports Equipment Revenue (million) Forecast, by Application 2020 & 2033
- Table 14: United States Household Sports Equipment Volume (K) Forecast, by Application 2020 & 2033
- Table 15: Canada Household Sports Equipment Revenue (million) Forecast, by Application 2020 & 2033
- Table 16: Canada Household Sports Equipment Volume (K) Forecast, by Application 2020 & 2033
- Table 17: Mexico Household Sports Equipment Revenue (million) Forecast, by Application 2020 & 2033
- Table 18: Mexico Household Sports Equipment Volume (K) Forecast, by Application 2020 & 2033
- Table 19: Global Household Sports Equipment Revenue million Forecast, by Application 2020 & 2033
- Table 20: Global Household Sports Equipment Volume K Forecast, by Application 2020 & 2033
- Table 21: Global Household Sports Equipment Revenue million Forecast, by Types 2020 & 2033
- Table 22: Global Household Sports Equipment Volume K Forecast, by Types 2020 & 2033
- Table 23: Global Household Sports Equipment Revenue million Forecast, by Country 2020 & 2033
- Table 24: Global Household Sports Equipment Volume K Forecast, by Country 2020 & 2033
- Table 25: Brazil Household Sports Equipment Revenue (million) Forecast, by Application 2020 & 2033
- Table 26: Brazil Household Sports Equipment Volume (K) Forecast, by Application 2020 & 2033
- Table 27: Argentina Household Sports Equipment Revenue (million) Forecast, by Application 2020 & 2033
- Table 28: Argentina Household Sports Equipment Volume (K) Forecast, by Application 2020 & 2033
- Table 29: Rest of South America Household Sports Equipment Revenue (million) Forecast, by Application 2020 & 2033
- Table 30: Rest of South America Household Sports Equipment Volume (K) Forecast, by Application 2020 & 2033
- Table 31: Global Household Sports Equipment Revenue million Forecast, by Application 2020 & 2033
- Table 32: Global Household Sports Equipment Volume K Forecast, by Application 2020 & 2033
- Table 33: Global Household Sports Equipment Revenue million Forecast, by Types 2020 & 2033
- Table 34: Global Household Sports Equipment Volume K Forecast, by Types 2020 & 2033
- Table 35: Global Household Sports Equipment Revenue million Forecast, by Country 2020 & 2033
- Table 36: Global Household Sports Equipment Volume K Forecast, by Country 2020 & 2033
- Table 37: United Kingdom Household Sports Equipment Revenue (million) Forecast, by Application 2020 & 2033
- Table 38: United Kingdom Household Sports Equipment Volume (K) Forecast, by Application 2020 & 2033
- Table 39: Germany Household Sports Equipment Revenue (million) Forecast, by Application 2020 & 2033
- Table 40: Germany Household Sports Equipment Volume (K) Forecast, by Application 2020 & 2033
- Table 41: France Household Sports Equipment Revenue (million) Forecast, by Application 2020 & 2033
- Table 42: France Household Sports Equipment Volume (K) Forecast, by Application 2020 & 2033
- Table 43: Italy Household Sports Equipment Revenue (million) Forecast, by Application 2020 & 2033
- Table 44: Italy Household Sports Equipment Volume (K) Forecast, by Application 2020 & 2033
- Table 45: Spain Household Sports Equipment Revenue (million) Forecast, by Application 2020 & 2033
- Table 46: Spain Household Sports Equipment Volume (K) Forecast, by Application 2020 & 2033
- Table 47: Russia Household Sports Equipment Revenue (million) Forecast, by Application 2020 & 2033
- Table 48: Russia Household Sports Equipment Volume (K) Forecast, by Application 2020 & 2033
- Table 49: Benelux Household Sports Equipment Revenue (million) Forecast, by Application 2020 & 2033
- Table 50: Benelux Household Sports Equipment Volume (K) Forecast, by Application 2020 & 2033
- Table 51: Nordics Household Sports Equipment Revenue (million) Forecast, by Application 2020 & 2033
- Table 52: Nordics Household Sports Equipment Volume (K) Forecast, by Application 2020 & 2033
- Table 53: Rest of Europe Household Sports Equipment Revenue (million) Forecast, by Application 2020 & 2033
- Table 54: Rest of Europe Household Sports Equipment Volume (K) Forecast, by Application 2020 & 2033
- Table 55: Global Household Sports Equipment Revenue million Forecast, by Application 2020 & 2033
- Table 56: Global Household Sports Equipment Volume K Forecast, by Application 2020 & 2033
- Table 57: Global Household Sports Equipment Revenue million Forecast, by Types 2020 & 2033
- Table 58: Global Household Sports Equipment Volume K Forecast, by Types 2020 & 2033
- Table 59: Global Household Sports Equipment Revenue million Forecast, by Country 2020 & 2033
- Table 60: Global Household Sports Equipment Volume K Forecast, by Country 2020 & 2033
- Table 61: Turkey Household Sports Equipment Revenue (million) Forecast, by Application 2020 & 2033
- Table 62: Turkey Household Sports Equipment Volume (K) Forecast, by Application 2020 & 2033
- Table 63: Israel Household Sports Equipment Revenue (million) Forecast, by Application 2020 & 2033
- Table 64: Israel Household Sports Equipment Volume (K) Forecast, by Application 2020 & 2033
- Table 65: GCC Household Sports Equipment Revenue (million) Forecast, by Application 2020 & 2033
- Table 66: GCC Household Sports Equipment Volume (K) Forecast, by Application 2020 & 2033
- Table 67: North Africa Household Sports Equipment Revenue (million) Forecast, by Application 2020 & 2033
- Table 68: North Africa Household Sports Equipment Volume (K) Forecast, by Application 2020 & 2033
- Table 69: South Africa Household Sports Equipment Revenue (million) Forecast, by Application 2020 & 2033
- Table 70: South Africa Household Sports Equipment Volume (K) Forecast, by Application 2020 & 2033
- Table 71: Rest of Middle East & Africa Household Sports Equipment Revenue (million) Forecast, by Application 2020 & 2033
- Table 72: Rest of Middle East & Africa Household Sports Equipment Volume (K) Forecast, by Application 2020 & 2033
- Table 73: Global Household Sports Equipment Revenue million Forecast, by Application 2020 & 2033
- Table 74: Global Household Sports Equipment Volume K Forecast, by Application 2020 & 2033
- Table 75: Global Household Sports Equipment Revenue million Forecast, by Types 2020 & 2033
- Table 76: Global Household Sports Equipment Volume K Forecast, by Types 2020 & 2033
- Table 77: Global Household Sports Equipment Revenue million Forecast, by Country 2020 & 2033
- Table 78: Global Household Sports Equipment Volume K Forecast, by Country 2020 & 2033
- Table 79: China Household Sports Equipment Revenue (million) Forecast, by Application 2020 & 2033
- Table 80: China Household Sports Equipment Volume (K) Forecast, by Application 2020 & 2033
- Table 81: India Household Sports Equipment Revenue (million) Forecast, by Application 2020 & 2033
- Table 82: India Household Sports Equipment Volume (K) Forecast, by Application 2020 & 2033
- Table 83: Japan Household Sports Equipment Revenue (million) Forecast, by Application 2020 & 2033
- Table 84: Japan Household Sports Equipment Volume (K) Forecast, by Application 2020 & 2033
- Table 85: South Korea Household Sports Equipment Revenue (million) Forecast, by Application 2020 & 2033
- Table 86: South Korea Household Sports Equipment Volume (K) Forecast, by Application 2020 & 2033
- Table 87: ASEAN Household Sports Equipment Revenue (million) Forecast, by Application 2020 & 2033
- Table 88: ASEAN Household Sports Equipment Volume (K) Forecast, by Application 2020 & 2033
- Table 89: Oceania Household Sports Equipment Revenue (million) Forecast, by Application 2020 & 2033
- Table 90: Oceania Household Sports Equipment Volume (K) Forecast, by Application 2020 & 2033
- Table 91: Rest of Asia Pacific Household Sports Equipment Revenue (million) Forecast, by Application 2020 & 2033
- Table 92: Rest of Asia Pacific Household Sports Equipment Volume (K) Forecast, by Application 2020 & 2033
Frequently Asked Questions
1. What is the projected Compound Annual Growth Rate (CAGR) of the Household Sports Equipment?
The projected CAGR is approximately 5%.
2. Which companies are prominent players in the Household Sports Equipment?
Key companies in the market include ICON Health & Fitness, Life Fitness, Johnson Health Tech, Dyaco, Core Health & Fitness, Peloton, Technogym, Precor, Sole Fitness, Shanxi Orient, SportsArt, BH Fitness, LifeCORE Fitness, WaterRower, TRUE Fitness, Shuhua Sports, WNQ Fitness, Impulse, YIJIAN, Good Family.
3. What are the main segments of the Household Sports Equipment?
The market segments include Application, Types.
4. Can you provide details about the market size?
The market size is estimated to be USD 3600 million as of 2022.
5. What are some drivers contributing to market growth?
N/A
6. What are the notable trends driving market growth?
N/A
7. Are there any restraints impacting market growth?
N/A
8. Can you provide examples of recent developments in the market?
N/A
9. What pricing options are available for accessing the report?
Pricing options include single-user, multi-user, and enterprise licenses priced at USD 3350.00, USD 5025.00, and USD 6700.00 respectively.
10. Is the market size provided in terms of value or volume?
The market size is provided in terms of value, measured in million and volume, measured in K.
11. Are there any specific market keywords associated with the report?
Yes, the market keyword associated with the report is "Household Sports Equipment," which aids in identifying and referencing the specific market segment covered.
12. How do I determine which pricing option suits my needs best?
The pricing options vary based on user requirements and access needs. Individual users may opt for single-user licenses, while businesses requiring broader access may choose multi-user or enterprise licenses for cost-effective access to the report.
13. Are there any additional resources or data provided in the Household Sports Equipment report?
While the report offers comprehensive insights, it's advisable to review the specific contents or supplementary materials provided to ascertain if additional resources or data are available.
14. How can I stay updated on further developments or reports in the Household Sports Equipment?
To stay informed about further developments, trends, and reports in the Household Sports Equipment, consider subscribing to industry newsletters, following relevant companies and organizations, or regularly checking reputable industry news sources and publications.
Methodology
Step 1 - Identification of Relevant Samples Size from Population Database


Step 2 - Approaches for Defining Global Market Size (Value, Volume* & Price*)

Note*: In applicable scenarios
Step 3 - Data Sources
Primary Research
- Web Analytics
- Survey Reports
- Research Institute
- Latest Research Reports
- Opinion Leaders
Secondary Research
- Annual Reports
- White Paper
- Latest Press Release
- Industry Association
- Paid Database
- Investor Presentations

Step 4 - Data Triangulation
Involves using different sources of information in order to increase the validity of a study
These sources are likely to be stakeholders in a program - participants, other researchers, program staff, other community members, and so on.
Then we put all data in single framework & apply various statistical tools to find out the dynamic on the market.
During the analysis stage, feedback from the stakeholder groups would be compared to determine areas of agreement as well as areas of divergence