

Key Insights
The global hydrogen gas market is poised for significant expansion, projected to reach $204.86 billion by 2025 and grow at a compound annual growth rate (CAGR) of 8.6% from 2025 to 2033. This growth is propelled by the escalating demand for clean energy alternatives across key sectors, including transportation (fuel cell vehicles), industrial applications (ammonia and methanol production, refining), and power generation. Increasing global environmental consciousness and stringent emission regulations are primary market drivers. While ammonia production and methanol synthesis will continue to be dominant applications, the burgeoning fuel cell vehicle sector represents a substantial future opportunity. Advancements in hydrogen production, storage technologies, and the development of robust distribution networks, such as pipelines and high-pressure tube trailers, will further accelerate market expansion. However, high production costs, limited infrastructure, and safety considerations in handling and storage may present near-term growth constraints. The market is segmented by distribution channels (pipelines, high-pressure tube trailers, cylinders) and applications (ammonia, methanol, refining, direct reduced iron (DRI), fuel cell vehicles (FCVs), and others). Regionally, Asia Pacific, led by China and India, is expected to dominate due to significant investments in renewable energy and industrial development. North America and Europe will also be crucial markets, supported by favorable government policies and the increasing adoption of hydrogen technologies.
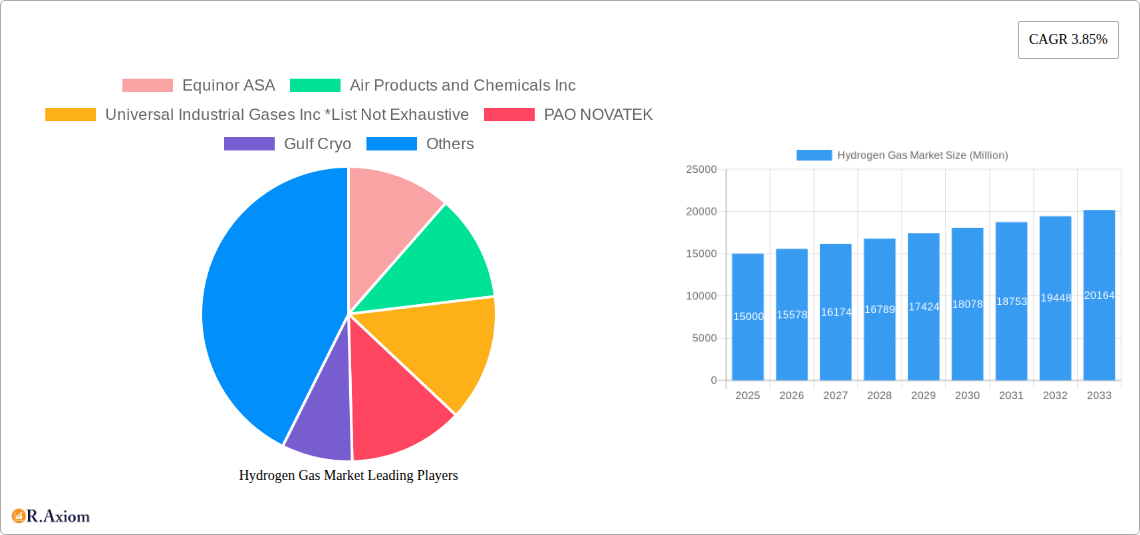
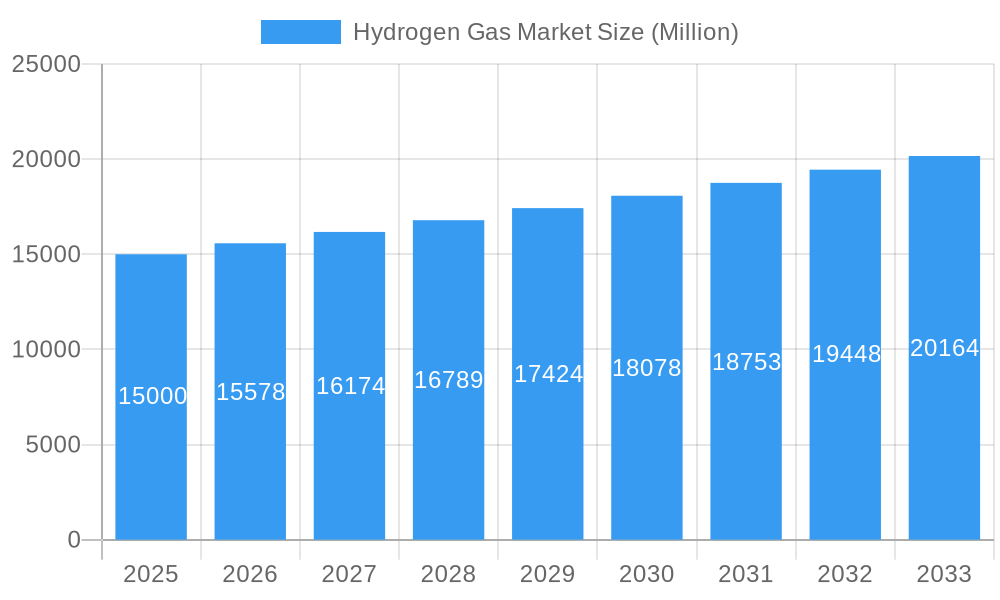
Hydrogen Gas Market Market Size (In Billion)
The competitive landscape features a blend of established multinational corporations and agile regional enterprises. Key industry players, including Equinor ASA, Air Products and Chemicals Inc., Linde plc, and Air Liquide, leverage their extensive infrastructure and expertise. Emerging players are focusing on specialized applications and innovative solutions. The market anticipates a rise in mergers and acquisitions, strategic collaborations, and technological breakthroughs, reshaping the competitive environment. Overcoming infrastructure bottlenecks, addressing cost inefficiencies, and ensuring the safety and reliability of hydrogen technologies will be critical for unlocking the market's full potential.
Hydrogen Gas Market Company Market Share
This comprehensive report offers in-depth analysis and actionable insights into the Hydrogen Gas Market for industry stakeholders, investors, and strategic decision-makers. Covering the period from 2019 to 2033, with a base year of 2025, the report meticulously examines market dynamics, competitive strategies, and growth prospects in this rapidly evolving sector. The market size for 2025 is estimated at $204.86 billion, with a forecasted CAGR of 8.6% from 2025 to 2033. The analysis is underpinned by a robust methodology integrating extensive primary and secondary research for accurate and reliable market intelligence.
Hydrogen Gas Market Market Concentration & Innovation
The hydrogen gas market is characterized by a dynamic competitive landscape, showcasing a spectrum of global behemoths and agile regional specialists. While definitive market share data for individual entities is subject to continuous evolution, dominant players such as Linde plc, Air Liquide, and Air Products and Chemicals Inc. consistently command substantial portions of the market. Projections indicate that the collective market share of the top five enterprises is anticipated to reach approximately [Insert XX]% by 2025. Innovation is a pivotal catalyst, with persistent advancements across hydrogen production methodologies (including but not limited to electrolysis and steam methane reforming), sophisticated storage systems, and robust distribution networks. The increasing stringency of environmental mandates across diverse geographies is a powerful impetus for the adoption of cleaner hydrogen generation techniques, thereby fostering innovation, particularly in the realm of green hydrogen technologies. While conventional substitutes like natural gas and other fossil fuels continue to pose competition, their inherent lifecycle emissions are increasingly driving a strategic pivot towards hydrogen. Emerging end-user trends underscore a burgeoning demand across a multitude of sectors, prominently featuring transportation (with the rise of fuel cell vehicles), essential industrial processes (such as refining and ammonia synthesis), and power generation.
Mergers and acquisitions (M&A) have played a significant role in shaping the hydrogen market in recent years. Although specific financial figures for these transactions are frequently proprietary, a number of high-profile acquisitions and strategic consolidations underscore the industry's ongoing consolidation and expansionary trajectory. For instance, the acquisition of Triton Power by Equinor and SSE Thermal exemplifies the strategic investments aimed at integrating hydrogen into existing energy infrastructures. The cumulative value of M&A deals within the hydrogen gas market between 2019 and 2024 is estimated to be in the vicinity of [Insert XX] Million.
Hydrogen Gas Market Industry Trends & Insights
The hydrogen gas market is currently experiencing a period of vigorous expansion, propelled by a confluence of significant growth drivers. The escalating demand for cleaner energy alternatives, fundamentally driven by global climate change imperatives and increasingly stringent emission regulations, stands as a primary catalyst for this market ascent. Supportive government initiatives, including financial incentives, subsidies, and policy frameworks specifically designed to champion hydrogen as a clean energy carrier, are further accelerating market penetration. Concurrently, technological breakthroughs are instrumental in reducing the cost of hydrogen production and enhancing its overall efficiency, thereby improving its competitiveness against established traditional energy sources. This has culminated in a substantial augmentation of global hydrogen production capacity, with the market share of green hydrogen projected to ascend from an estimated [Insert XX]% in 2025 to [Insert XX]% by 2033. Furthermore, a growing consumer preference for sustainable and environmentally conscious energy solutions is bolstering the demand for green hydrogen, which is produced utilizing renewable energy sources. Nevertheless, the competitive landscape remains intensely contested, with both established industry leaders and agile new entrants actively vying for market dominance through relentless innovation, aggressive cost optimization strategies, and the forging of strategic alliances.
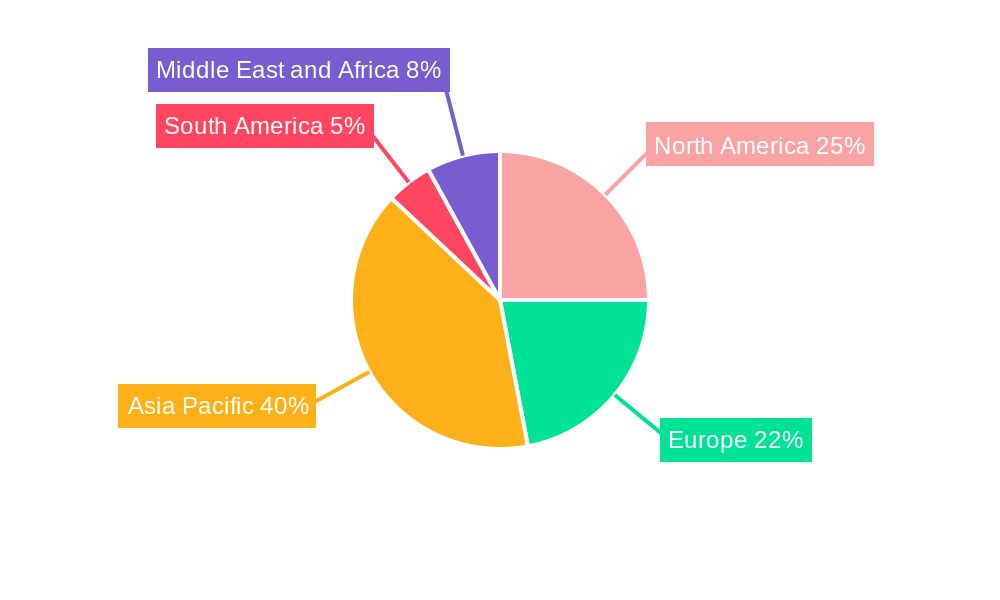
Dominant Markets & Segments in Hydrogen Gas Market
The hydrogen gas market demonstrates significant regional variations in growth and adoption. Currently, xx is considered the dominant region, driven by strong government support, robust industrial infrastructure, and a large demand across various sectors. Other regions are also showing significant growth potential, influenced by factors such as the availability of renewable energy resources and favorable government policies.
Key Drivers by Segment:
Distribution:
- Pipelines: Large-scale hydrogen infrastructure development is crucial for widespread adoption; investment in pipeline networks is a key driver.
- High-Pressure Tube Trailers: Cost-effective short-to-medium distance transportation solutions are increasingly important, driving growth in this segment.
- Cylinders: Small-scale, on-site hydrogen storage and distribution remain essential for niche applications, ensuring continued market presence.
Application:
- Ammonia: The significant role of hydrogen in ammonia production (a key fertilizer component) creates substantial demand.
- Methanol: Hydrogen’s importance in methanol synthesis for various applications ensures continued market growth.
- Refining: Growing demand for cleaner refining processes is steadily boosting hydrogen’s role in this sector.
- Direct Reduced Iron (DRI): Hydrogen’s use in DRI production is gaining traction, leading to increased demand.
- Fuel Cell Vehicles (FCV): The increasing adoption of FCVs, particularly in certain regions, represents a significant emerging market driver.
- Other Applications: Other diverse hydrogen applications (e.g., in metal processing) demonstrate a broader potential for market expansion.
Hydrogen Gas Market Product Developments
Recent product advancements are primarily focused on optimizing hydrogen production efficiency, enhancing storage capabilities, and refining transportation methodologies. State-of-the-art electrolysis technologies are now achieving higher hydrogen yields while simultaneously reducing energy consumption. Innovations in materials science are yielding more efficient and inherently safer hydrogen storage solutions, encompassing high-pressure containment systems and advanced solid-state storage technologies. Developments in hydrogen transportation, such as cutting-edge pipeline technologies and specialized cryogenic tankers, are significantly improving the feasibility and economics of long-distance hydrogen distribution. These collective advancements are instrumental in bolstering market competitiveness and facilitating the broader adoption of hydrogen across a diverse array of industrial and commercial applications.
Report Scope & Segmentation Analysis
This report meticulously segments the hydrogen gas market based on distinct distribution channels, including pipelines, high-pressure tube trailers, and cylinders, alongside a comprehensive analysis of its diverse applications. Key application segments analyzed include Ammonia production, Methanol synthesis, refining processes, Direct Reduced Iron (DRI) manufacturing, Fuel Cell Vehicles (FCVs), and other emergent applications. The growth trajectory, market valuation, and competitive dynamics of each segment are thoroughly examined. For instance, the pipelines segment is poised for substantial expansion, fueled by significant investments in dedicated hydrogen infrastructure. Conversely, the growth of the Fuel Cell Vehicle segment is intrinsically linked to the pace of FCV adoption rates. The "Other Applications" segment demonstrates considerable promise due to ongoing research and the development of novel and diverse industrial uses for hydrogen.
Key Drivers of Hydrogen Gas Market Growth
Several factors propel the hydrogen gas market's growth. Firstly, the increasing urgency to mitigate climate change, coupled with stringent environmental regulations, drives the shift towards cleaner energy sources. Secondly, technological advancements, particularly in electrolysis and fuel cell technologies, are reducing costs and improving efficiency, making hydrogen more competitive. Lastly, supportive government policies, including subsidies and incentives, are boosting investments in hydrogen production, storage, and distribution infrastructure.
Challenges in the Hydrogen Gas Market Sector
The hydrogen gas market faces several challenges. High production costs, particularly for green hydrogen, remain a major barrier to widespread adoption. The lack of established and extensive hydrogen infrastructure in many regions hinders its widespread distribution and application. Furthermore, safety concerns surrounding hydrogen storage and transportation require addressing to ensure public acceptance and adoption. Competitive pressure from established fossil fuel-based energy sources is another critical challenge. Currently, the cost of green hydrogen is estimated to be xx% higher compared to grey hydrogen, impacting market penetration.
Emerging Opportunities in Hydrogen Gas Market
The hydrogen gas market presents a landscape rich with emerging opportunities. The escalating demand for hydrogen within the transportation sector, particularly its application in fuel cell vehicles, represents a significant avenue for expansion. The development of novel hydrogen storage materials and advanced technologies holds the potential to drastically improve safety standards and reduce overall costs. Furthermore, strategic entry into new and developing markets, such as the establishment of large-scale, long-distance hydrogen transportation networks and the integration of hydrogen into existing and future energy systems, offers substantial potential for sustained growth and market leadership.
Leading Players in the Hydrogen Gas Market Market
- Equinor ASA
- Air Products and Chemicals Inc
- Universal Industrial Gases Inc
- PAO NOVATEK
- Gulf Cryo
- Lords Chloro Alkali Limited
- Gujarat Alkalies and Chemicals Limited
- Matheson Tri-Gas Inc
- BASF SE
- Aditya Birla Chemicals
- Linde plc
- TAIYO NIPPON SANSO CORPORATION
- Air Liquide
- Messer SE & Co KGaA
Key Developments in Hydrogen Gas Market Industry
- June 2022: BASF and Shell successfully evaluated and de-risked BASF's Puristar R0-20 and Sorbead Adsorption Technology for green hydrogen production, paving the way for more efficient purification and dehydration processes.
- June 2022: Equinor and SSE Thermal's acquisition of Triton Power, including the Saltend Power Station, signifies a major step towards integrating hydrogen into existing energy infrastructure in the UK. The planned conversion to up to 30% hydrogen by 2027, with an ambition of 100%, showcases the significant shift towards hydrogen utilization in power generation.
- July 2022: The joint development agreement between Air Products and VPI for the Humber Hydrogen Hub ('H3') project underscores the growing momentum in large-scale green hydrogen production facilities. The planned 800 MW facility demonstrates significant investment in the sector.
Strategic Outlook for Hydrogen Gas Market Market
The future of the hydrogen gas market appears bright, driven by growing global demand, technological advancements, and supportive government policies. As the cost of green hydrogen continues to decline and infrastructure develops, widespread adoption across various sectors is expected. Strategic partnerships, technological breakthroughs, and expansion into emerging markets will be crucial factors shaping the industry's landscape in the years to come. The market is poised for significant growth, presenting considerable opportunities for investors and industry players alike.
Hydrogen Gas Market Segmentation
-
1. Distribution
- 1.1. Pipelines
- 1.2. High-pressure Tube Trailers
- 1.3. Cylinders
-
2. Application
- 2.1. Ammonia
- 2.2. Methanol
- 2.3. Refining
- 2.4. Direct Reduced Iron (DRI)
- 2.5. Fuel Cell Vehicles (FCV)
- 2.6. Other Ap
Hydrogen Gas Market Segmentation By Geography
-
1. Asia Pacific
- 1.1. China
- 1.2. India
- 1.3. Japan
- 1.4. South Korea
- 1.5. Malaysia
- 1.6. Thailand
- 1.7. Indonesia
- 1.8. Vietnam
- 1.9. Rest of Asia Pacific
-
2. North America
- 2.1. United States
- 2.2. Canada
- 2.3. Mexico
-
3. Europe
- 3.1. Germany
- 3.2. United Kingdom
- 3.3. Italy
- 3.4. France
- 3.5. Spain
- 3.6. NORDIC
- 3.7. Turkey
- 3.8. Russia
- 3.9. Rest of Europe
-
4. South America
- 4.1. Brazil
- 4.2. Argentina
- 4.3. Colombia
- 4.4. Rest of South America
-
5. Middle East and Africa
- 5.1. Saudi Arabia
- 5.2. South Africa
- 5.3. Nigeria
- 5.4. Qatar
- 5.5. Egypt
- 5.6. United Arab Emirates
- 5.7. Rest of Middle East and Africa
Hydrogen Gas Market Regional Market Share
Geographic Coverage of Hydrogen Gas Market
Hydrogen Gas Market REPORT HIGHLIGHTS
| Aspects | Details |
|---|---|
| Study Period | 2020-2034 |
| Base Year | 2025 |
| Estimated Year | 2026 |
| Forecast Period | 2026-2034 |
| Historical Period | 2020-2025 |
| Growth Rate | CAGR of 8.6% from 2020-2034 |
| Segmentation |
|
Table of Contents
- 1. Introduction
- 1.1. Research Scope
- 1.2. Market Segmentation
- 1.3. Research Objective
- 1.4. Definitions and Assumptions
- 2. Executive Summary
- 2.1. Market Snapshot
- 3. Market Dynamics
- 3.1. Market Drivers
- 3.2. Market Restrains
- 3.3. Market Trends
- 3.4. Market Opportunities
- 4. Market Factor Analysis
- 4.1. Porters Five Forces
- 4.1.1. Bargaining Power of Suppliers
- 4.1.2. Bargaining Power of Buyers
- 4.1.3. Threat of New Entrants
- 4.1.4. Threat of Substitutes
- 4.1.5. Competitive Rivalry
- 4.2. PESTEL analysis
- 4.3. BCG Analysis
- 4.3.1. Stars (High Growth, High Market Share)
- 4.3.2. Cash Cows (Low Growth, High Market Share)
- 4.3.3. Question Mark (High Growth, Low Market Share)
- 4.3.4. Dogs (Low Growth, Low Market Share)
- 4.4. Ansoff Matrix Analysis
- 4.5. Supply Chain Analysis
- 4.6. Regulatory Landscape
- 4.7. Current Market Potential and Opportunity Assessment (TAM–SAM–SOM Framework)
- 4.8. RAX Analyst Note
- 4.1. Porters Five Forces
- 5. Market Analysis, Insights and Forecast 2021-2033
- 5.1. Market Analysis, Insights and Forecast - by Distribution
- 5.1.1. Pipelines
- 5.1.2. High-pressure Tube Trailers
- 5.1.3. Cylinders
- 5.2. Market Analysis, Insights and Forecast - by Application
- 5.2.1. Ammonia
- 5.2.2. Methanol
- 5.2.3. Refining
- 5.2.4. Direct Reduced Iron (DRI)
- 5.2.5. Fuel Cell Vehicles (FCV)
- 5.2.6. Other Ap
- 5.3. Market Analysis, Insights and Forecast - by Region
- 5.3.1. Asia Pacific
- 5.3.2. North America
- 5.3.3. Europe
- 5.3.4. South America
- 5.3.5. Middle East and Africa
- 5.1. Market Analysis, Insights and Forecast - by Distribution
- 6. Global Hydrogen Gas Market Analysis, Insights and Forecast, 2021-2033
- 6.1. Market Analysis, Insights and Forecast - by Distribution
- 6.1.1. Pipelines
- 6.1.2. High-pressure Tube Trailers
- 6.1.3. Cylinders
- 6.2. Market Analysis, Insights and Forecast - by Application
- 6.2.1. Ammonia
- 6.2.2. Methanol
- 6.2.3. Refining
- 6.2.4. Direct Reduced Iron (DRI)
- 6.2.5. Fuel Cell Vehicles (FCV)
- 6.2.6. Other Ap
- 6.1. Market Analysis, Insights and Forecast - by Distribution
- 7. Asia Pacific Hydrogen Gas Market Analysis, Insights and Forecast, 2020-2032
- 7.1. Market Analysis, Insights and Forecast - by Distribution
- 7.1.1. Pipelines
- 7.1.2. High-pressure Tube Trailers
- 7.1.3. Cylinders
- 7.2. Market Analysis, Insights and Forecast - by Application
- 7.2.1. Ammonia
- 7.2.2. Methanol
- 7.2.3. Refining
- 7.2.4. Direct Reduced Iron (DRI)
- 7.2.5. Fuel Cell Vehicles (FCV)
- 7.2.6. Other Ap
- 7.1. Market Analysis, Insights and Forecast - by Distribution
- 8. North America Hydrogen Gas Market Analysis, Insights and Forecast, 2020-2032
- 8.1. Market Analysis, Insights and Forecast - by Distribution
- 8.1.1. Pipelines
- 8.1.2. High-pressure Tube Trailers
- 8.1.3. Cylinders
- 8.2. Market Analysis, Insights and Forecast - by Application
- 8.2.1. Ammonia
- 8.2.2. Methanol
- 8.2.3. Refining
- 8.2.4. Direct Reduced Iron (DRI)
- 8.2.5. Fuel Cell Vehicles (FCV)
- 8.2.6. Other Ap
- 8.1. Market Analysis, Insights and Forecast - by Distribution
- 9. Europe Hydrogen Gas Market Analysis, Insights and Forecast, 2020-2032
- 9.1. Market Analysis, Insights and Forecast - by Distribution
- 9.1.1. Pipelines
- 9.1.2. High-pressure Tube Trailers
- 9.1.3. Cylinders
- 9.2. Market Analysis, Insights and Forecast - by Application
- 9.2.1. Ammonia
- 9.2.2. Methanol
- 9.2.3. Refining
- 9.2.4. Direct Reduced Iron (DRI)
- 9.2.5. Fuel Cell Vehicles (FCV)
- 9.2.6. Other Ap
- 9.1. Market Analysis, Insights and Forecast - by Distribution
- 10. South America Hydrogen Gas Market Analysis, Insights and Forecast, 2020-2032
- 10.1. Market Analysis, Insights and Forecast - by Distribution
- 10.1.1. Pipelines
- 10.1.2. High-pressure Tube Trailers
- 10.1.3. Cylinders
- 10.2. Market Analysis, Insights and Forecast - by Application
- 10.2.1. Ammonia
- 10.2.2. Methanol
- 10.2.3. Refining
- 10.2.4. Direct Reduced Iron (DRI)
- 10.2.5. Fuel Cell Vehicles (FCV)
- 10.2.6. Other Ap
- 10.1. Market Analysis, Insights and Forecast - by Distribution
- 11. Middle East and Africa Hydrogen Gas Market Analysis, Insights and Forecast, 2020-2032
- 11.1. Market Analysis, Insights and Forecast - by Distribution
- 11.1.1. Pipelines
- 11.1.2. High-pressure Tube Trailers
- 11.1.3. Cylinders
- 11.2. Market Analysis, Insights and Forecast - by Application
- 11.2.1. Ammonia
- 11.2.2. Methanol
- 11.2.3. Refining
- 11.2.4. Direct Reduced Iron (DRI)
- 11.2.5. Fuel Cell Vehicles (FCV)
- 11.2.6. Other Ap
- 11.1. Market Analysis, Insights and Forecast - by Distribution
- 12. Competitive Analysis
- 12.1. Company Profiles
- 12.1.1 Equinor ASA
- 12.1.1.1. Company Overview
- 12.1.1.2. Products
- 12.1.1.3. Company Financials
- 12.1.1.4. SWOT Analysis
- 12.1.2 Air Products and Chemicals Inc
- 12.1.2.1. Company Overview
- 12.1.2.2. Products
- 12.1.2.3. Company Financials
- 12.1.2.4. SWOT Analysis
- 12.1.3 Universal Industrial Gases Inc *List Not Exhaustive
- 12.1.3.1. Company Overview
- 12.1.3.2. Products
- 12.1.3.3. Company Financials
- 12.1.3.4. SWOT Analysis
- 12.1.4 PAO NOVATEK
- 12.1.4.1. Company Overview
- 12.1.4.2. Products
- 12.1.4.3. Company Financials
- 12.1.4.4. SWOT Analysis
- 12.1.5 Gulf Cryo
- 12.1.5.1. Company Overview
- 12.1.5.2. Products
- 12.1.5.3. Company Financials
- 12.1.5.4. SWOT Analysis
- 12.1.6 Lords Chloro Alkali Limited
- 12.1.6.1. Company Overview
- 12.1.6.2. Products
- 12.1.6.3. Company Financials
- 12.1.6.4. SWOT Analysis
- 12.1.7 Gujarat Alkalies and Chemicals Limited
- 12.1.7.1. Company Overview
- 12.1.7.2. Products
- 12.1.7.3. Company Financials
- 12.1.7.4. SWOT Analysis
- 12.1.8 Matheson Tri-Gas Inc
- 12.1.8.1. Company Overview
- 12.1.8.2. Products
- 12.1.8.3. Company Financials
- 12.1.8.4. SWOT Analysis
- 12.1.9 BASF SE
- 12.1.9.1. Company Overview
- 12.1.9.2. Products
- 12.1.9.3. Company Financials
- 12.1.9.4. SWOT Analysis
- 12.1.10 Aditya Birla Chemicals
- 12.1.10.1. Company Overview
- 12.1.10.2. Products
- 12.1.10.3. Company Financials
- 12.1.10.4. SWOT Analysis
- 12.1.11 Linde plc
- 12.1.11.1. Company Overview
- 12.1.11.2. Products
- 12.1.11.3. Company Financials
- 12.1.11.4. SWOT Analysis
- 12.1.12 TAIYO NIPPON SANSO CORPORATION
- 12.1.12.1. Company Overview
- 12.1.12.2. Products
- 12.1.12.3. Company Financials
- 12.1.12.4. SWOT Analysis
- 12.1.13 Air Liquide
- 12.1.13.1. Company Overview
- 12.1.13.2. Products
- 12.1.13.3. Company Financials
- 12.1.13.4. SWOT Analysis
- 12.1.14 Messer SE & Co KGaA
- 12.1.14.1. Company Overview
- 12.1.14.2. Products
- 12.1.14.3. Company Financials
- 12.1.14.4. SWOT Analysis
- 12.1.1 Equinor ASA
- 12.2. Market Entropy
- 12.2.1 Company's Key Areas Served
- 12.2.2 Recent Developments
- 12.3. Company Market Share Analysis 2025
- 12.3.1 Top 5 Companies Market Share Analysis
- 12.3.2 Top 3 Companies Market Share Analysis
- 12.4. List of Potential Customers
- 13. Research Methodology
List of Figures
- Figure 1: Global Hydrogen Gas Market Revenue Breakdown (billion, %) by Region 2025 & 2033
- Figure 2: Global Hydrogen Gas Market Volume Breakdown (Million, %) by Region 2025 & 2033
- Figure 3: Asia Pacific Hydrogen Gas Market Revenue (billion), by Distribution 2025 & 2033
- Figure 4: Asia Pacific Hydrogen Gas Market Volume (Million), by Distribution 2025 & 2033
- Figure 5: Asia Pacific Hydrogen Gas Market Revenue Share (%), by Distribution 2025 & 2033
- Figure 6: Asia Pacific Hydrogen Gas Market Volume Share (%), by Distribution 2025 & 2033
- Figure 7: Asia Pacific Hydrogen Gas Market Revenue (billion), by Application 2025 & 2033
- Figure 8: Asia Pacific Hydrogen Gas Market Volume (Million), by Application 2025 & 2033
- Figure 9: Asia Pacific Hydrogen Gas Market Revenue Share (%), by Application 2025 & 2033
- Figure 10: Asia Pacific Hydrogen Gas Market Volume Share (%), by Application 2025 & 2033
- Figure 11: Asia Pacific Hydrogen Gas Market Revenue (billion), by Country 2025 & 2033
- Figure 12: Asia Pacific Hydrogen Gas Market Volume (Million), by Country 2025 & 2033
- Figure 13: Asia Pacific Hydrogen Gas Market Revenue Share (%), by Country 2025 & 2033
- Figure 14: Asia Pacific Hydrogen Gas Market Volume Share (%), by Country 2025 & 2033
- Figure 15: North America Hydrogen Gas Market Revenue (billion), by Distribution 2025 & 2033
- Figure 16: North America Hydrogen Gas Market Volume (Million), by Distribution 2025 & 2033
- Figure 17: North America Hydrogen Gas Market Revenue Share (%), by Distribution 2025 & 2033
- Figure 18: North America Hydrogen Gas Market Volume Share (%), by Distribution 2025 & 2033
- Figure 19: North America Hydrogen Gas Market Revenue (billion), by Application 2025 & 2033
- Figure 20: North America Hydrogen Gas Market Volume (Million), by Application 2025 & 2033
- Figure 21: North America Hydrogen Gas Market Revenue Share (%), by Application 2025 & 2033
- Figure 22: North America Hydrogen Gas Market Volume Share (%), by Application 2025 & 2033
- Figure 23: North America Hydrogen Gas Market Revenue (billion), by Country 2025 & 2033
- Figure 24: North America Hydrogen Gas Market Volume (Million), by Country 2025 & 2033
- Figure 25: North America Hydrogen Gas Market Revenue Share (%), by Country 2025 & 2033
- Figure 26: North America Hydrogen Gas Market Volume Share (%), by Country 2025 & 2033
- Figure 27: Europe Hydrogen Gas Market Revenue (billion), by Distribution 2025 & 2033
- Figure 28: Europe Hydrogen Gas Market Volume (Million), by Distribution 2025 & 2033
- Figure 29: Europe Hydrogen Gas Market Revenue Share (%), by Distribution 2025 & 2033
- Figure 30: Europe Hydrogen Gas Market Volume Share (%), by Distribution 2025 & 2033
- Figure 31: Europe Hydrogen Gas Market Revenue (billion), by Application 2025 & 2033
- Figure 32: Europe Hydrogen Gas Market Volume (Million), by Application 2025 & 2033
- Figure 33: Europe Hydrogen Gas Market Revenue Share (%), by Application 2025 & 2033
- Figure 34: Europe Hydrogen Gas Market Volume Share (%), by Application 2025 & 2033
- Figure 35: Europe Hydrogen Gas Market Revenue (billion), by Country 2025 & 2033
- Figure 36: Europe Hydrogen Gas Market Volume (Million), by Country 2025 & 2033
- Figure 37: Europe Hydrogen Gas Market Revenue Share (%), by Country 2025 & 2033
- Figure 38: Europe Hydrogen Gas Market Volume Share (%), by Country 2025 & 2033
- Figure 39: South America Hydrogen Gas Market Revenue (billion), by Distribution 2025 & 2033
- Figure 40: South America Hydrogen Gas Market Volume (Million), by Distribution 2025 & 2033
- Figure 41: South America Hydrogen Gas Market Revenue Share (%), by Distribution 2025 & 2033
- Figure 42: South America Hydrogen Gas Market Volume Share (%), by Distribution 2025 & 2033
- Figure 43: South America Hydrogen Gas Market Revenue (billion), by Application 2025 & 2033
- Figure 44: South America Hydrogen Gas Market Volume (Million), by Application 2025 & 2033
- Figure 45: South America Hydrogen Gas Market Revenue Share (%), by Application 2025 & 2033
- Figure 46: South America Hydrogen Gas Market Volume Share (%), by Application 2025 & 2033
- Figure 47: South America Hydrogen Gas Market Revenue (billion), by Country 2025 & 2033
- Figure 48: South America Hydrogen Gas Market Volume (Million), by Country 2025 & 2033
- Figure 49: South America Hydrogen Gas Market Revenue Share (%), by Country 2025 & 2033
- Figure 50: South America Hydrogen Gas Market Volume Share (%), by Country 2025 & 2033
- Figure 51: Middle East and Africa Hydrogen Gas Market Revenue (billion), by Distribution 2025 & 2033
- Figure 52: Middle East and Africa Hydrogen Gas Market Volume (Million), by Distribution 2025 & 2033
- Figure 53: Middle East and Africa Hydrogen Gas Market Revenue Share (%), by Distribution 2025 & 2033
- Figure 54: Middle East and Africa Hydrogen Gas Market Volume Share (%), by Distribution 2025 & 2033
- Figure 55: Middle East and Africa Hydrogen Gas Market Revenue (billion), by Application 2025 & 2033
- Figure 56: Middle East and Africa Hydrogen Gas Market Volume (Million), by Application 2025 & 2033
- Figure 57: Middle East and Africa Hydrogen Gas Market Revenue Share (%), by Application 2025 & 2033
- Figure 58: Middle East and Africa Hydrogen Gas Market Volume Share (%), by Application 2025 & 2033
- Figure 59: Middle East and Africa Hydrogen Gas Market Revenue (billion), by Country 2025 & 2033
- Figure 60: Middle East and Africa Hydrogen Gas Market Volume (Million), by Country 2025 & 2033
- Figure 61: Middle East and Africa Hydrogen Gas Market Revenue Share (%), by Country 2025 & 2033
- Figure 62: Middle East and Africa Hydrogen Gas Market Volume Share (%), by Country 2025 & 2033
List of Tables
- Table 1: Global Hydrogen Gas Market Revenue billion Forecast, by Distribution 2020 & 2033
- Table 2: Global Hydrogen Gas Market Volume Million Forecast, by Distribution 2020 & 2033
- Table 3: Global Hydrogen Gas Market Revenue billion Forecast, by Application 2020 & 2033
- Table 4: Global Hydrogen Gas Market Volume Million Forecast, by Application 2020 & 2033
- Table 5: Global Hydrogen Gas Market Revenue billion Forecast, by Region 2020 & 2033
- Table 6: Global Hydrogen Gas Market Volume Million Forecast, by Region 2020 & 2033
- Table 7: Global Hydrogen Gas Market Revenue billion Forecast, by Distribution 2020 & 2033
- Table 8: Global Hydrogen Gas Market Volume Million Forecast, by Distribution 2020 & 2033
- Table 9: Global Hydrogen Gas Market Revenue billion Forecast, by Application 2020 & 2033
- Table 10: Global Hydrogen Gas Market Volume Million Forecast, by Application 2020 & 2033
- Table 11: Global Hydrogen Gas Market Revenue billion Forecast, by Country 2020 & 2033
- Table 12: Global Hydrogen Gas Market Volume Million Forecast, by Country 2020 & 2033
- Table 13: China Hydrogen Gas Market Revenue (billion) Forecast, by Application 2020 & 2033
- Table 14: China Hydrogen Gas Market Volume (Million) Forecast, by Application 2020 & 2033
- Table 15: India Hydrogen Gas Market Revenue (billion) Forecast, by Application 2020 & 2033
- Table 16: India Hydrogen Gas Market Volume (Million) Forecast, by Application 2020 & 2033
- Table 17: Japan Hydrogen Gas Market Revenue (billion) Forecast, by Application 2020 & 2033
- Table 18: Japan Hydrogen Gas Market Volume (Million) Forecast, by Application 2020 & 2033
- Table 19: South Korea Hydrogen Gas Market Revenue (billion) Forecast, by Application 2020 & 2033
- Table 20: South Korea Hydrogen Gas Market Volume (Million) Forecast, by Application 2020 & 2033
- Table 21: Malaysia Hydrogen Gas Market Revenue (billion) Forecast, by Application 2020 & 2033
- Table 22: Malaysia Hydrogen Gas Market Volume (Million) Forecast, by Application 2020 & 2033
- Table 23: Thailand Hydrogen Gas Market Revenue (billion) Forecast, by Application 2020 & 2033
- Table 24: Thailand Hydrogen Gas Market Volume (Million) Forecast, by Application 2020 & 2033
- Table 25: Indonesia Hydrogen Gas Market Revenue (billion) Forecast, by Application 2020 & 2033
- Table 26: Indonesia Hydrogen Gas Market Volume (Million) Forecast, by Application 2020 & 2033
- Table 27: Vietnam Hydrogen Gas Market Revenue (billion) Forecast, by Application 2020 & 2033
- Table 28: Vietnam Hydrogen Gas Market Volume (Million) Forecast, by Application 2020 & 2033
- Table 29: Rest of Asia Pacific Hydrogen Gas Market Revenue (billion) Forecast, by Application 2020 & 2033
- Table 30: Rest of Asia Pacific Hydrogen Gas Market Volume (Million) Forecast, by Application 2020 & 2033
- Table 31: Global Hydrogen Gas Market Revenue billion Forecast, by Distribution 2020 & 2033
- Table 32: Global Hydrogen Gas Market Volume Million Forecast, by Distribution 2020 & 2033
- Table 33: Global Hydrogen Gas Market Revenue billion Forecast, by Application 2020 & 2033
- Table 34: Global Hydrogen Gas Market Volume Million Forecast, by Application 2020 & 2033
- Table 35: Global Hydrogen Gas Market Revenue billion Forecast, by Country 2020 & 2033
- Table 36: Global Hydrogen Gas Market Volume Million Forecast, by Country 2020 & 2033
- Table 37: United States Hydrogen Gas Market Revenue (billion) Forecast, by Application 2020 & 2033
- Table 38: United States Hydrogen Gas Market Volume (Million) Forecast, by Application 2020 & 2033
- Table 39: Canada Hydrogen Gas Market Revenue (billion) Forecast, by Application 2020 & 2033
- Table 40: Canada Hydrogen Gas Market Volume (Million) Forecast, by Application 2020 & 2033
- Table 41: Mexico Hydrogen Gas Market Revenue (billion) Forecast, by Application 2020 & 2033
- Table 42: Mexico Hydrogen Gas Market Volume (Million) Forecast, by Application 2020 & 2033
- Table 43: Global Hydrogen Gas Market Revenue billion Forecast, by Distribution 2020 & 2033
- Table 44: Global Hydrogen Gas Market Volume Million Forecast, by Distribution 2020 & 2033
- Table 45: Global Hydrogen Gas Market Revenue billion Forecast, by Application 2020 & 2033
- Table 46: Global Hydrogen Gas Market Volume Million Forecast, by Application 2020 & 2033
- Table 47: Global Hydrogen Gas Market Revenue billion Forecast, by Country 2020 & 2033
- Table 48: Global Hydrogen Gas Market Volume Million Forecast, by Country 2020 & 2033
- Table 49: Germany Hydrogen Gas Market Revenue (billion) Forecast, by Application 2020 & 2033
- Table 50: Germany Hydrogen Gas Market Volume (Million) Forecast, by Application 2020 & 2033
- Table 51: United Kingdom Hydrogen Gas Market Revenue (billion) Forecast, by Application 2020 & 2033
- Table 52: United Kingdom Hydrogen Gas Market Volume (Million) Forecast, by Application 2020 & 2033
- Table 53: Italy Hydrogen Gas Market Revenue (billion) Forecast, by Application 2020 & 2033
- Table 54: Italy Hydrogen Gas Market Volume (Million) Forecast, by Application 2020 & 2033
- Table 55: France Hydrogen Gas Market Revenue (billion) Forecast, by Application 2020 & 2033
- Table 56: France Hydrogen Gas Market Volume (Million) Forecast, by Application 2020 & 2033
- Table 57: Spain Hydrogen Gas Market Revenue (billion) Forecast, by Application 2020 & 2033
- Table 58: Spain Hydrogen Gas Market Volume (Million) Forecast, by Application 2020 & 2033
- Table 59: NORDIC Hydrogen Gas Market Revenue (billion) Forecast, by Application 2020 & 2033
- Table 60: NORDIC Hydrogen Gas Market Volume (Million) Forecast, by Application 2020 & 2033
- Table 61: Turkey Hydrogen Gas Market Revenue (billion) Forecast, by Application 2020 & 2033
- Table 62: Turkey Hydrogen Gas Market Volume (Million) Forecast, by Application 2020 & 2033
- Table 63: Russia Hydrogen Gas Market Revenue (billion) Forecast, by Application 2020 & 2033
- Table 64: Russia Hydrogen Gas Market Volume (Million) Forecast, by Application 2020 & 2033
- Table 65: Rest of Europe Hydrogen Gas Market Revenue (billion) Forecast, by Application 2020 & 2033
- Table 66: Rest of Europe Hydrogen Gas Market Volume (Million) Forecast, by Application 2020 & 2033
- Table 67: Global Hydrogen Gas Market Revenue billion Forecast, by Distribution 2020 & 2033
- Table 68: Global Hydrogen Gas Market Volume Million Forecast, by Distribution 2020 & 2033
- Table 69: Global Hydrogen Gas Market Revenue billion Forecast, by Application 2020 & 2033
- Table 70: Global Hydrogen Gas Market Volume Million Forecast, by Application 2020 & 2033
- Table 71: Global Hydrogen Gas Market Revenue billion Forecast, by Country 2020 & 2033
- Table 72: Global Hydrogen Gas Market Volume Million Forecast, by Country 2020 & 2033
- Table 73: Brazil Hydrogen Gas Market Revenue (billion) Forecast, by Application 2020 & 2033
- Table 74: Brazil Hydrogen Gas Market Volume (Million) Forecast, by Application 2020 & 2033
- Table 75: Argentina Hydrogen Gas Market Revenue (billion) Forecast, by Application 2020 & 2033
- Table 76: Argentina Hydrogen Gas Market Volume (Million) Forecast, by Application 2020 & 2033
- Table 77: Colombia Hydrogen Gas Market Revenue (billion) Forecast, by Application 2020 & 2033
- Table 78: Colombia Hydrogen Gas Market Volume (Million) Forecast, by Application 2020 & 2033
- Table 79: Rest of South America Hydrogen Gas Market Revenue (billion) Forecast, by Application 2020 & 2033
- Table 80: Rest of South America Hydrogen Gas Market Volume (Million) Forecast, by Application 2020 & 2033
- Table 81: Global Hydrogen Gas Market Revenue billion Forecast, by Distribution 2020 & 2033
- Table 82: Global Hydrogen Gas Market Volume Million Forecast, by Distribution 2020 & 2033
- Table 83: Global Hydrogen Gas Market Revenue billion Forecast, by Application 2020 & 2033
- Table 84: Global Hydrogen Gas Market Volume Million Forecast, by Application 2020 & 2033
- Table 85: Global Hydrogen Gas Market Revenue billion Forecast, by Country 2020 & 2033
- Table 86: Global Hydrogen Gas Market Volume Million Forecast, by Country 2020 & 2033
- Table 87: Saudi Arabia Hydrogen Gas Market Revenue (billion) Forecast, by Application 2020 & 2033
- Table 88: Saudi Arabia Hydrogen Gas Market Volume (Million) Forecast, by Application 2020 & 2033
- Table 89: South Africa Hydrogen Gas Market Revenue (billion) Forecast, by Application 2020 & 2033
- Table 90: South Africa Hydrogen Gas Market Volume (Million) Forecast, by Application 2020 & 2033
- Table 91: Nigeria Hydrogen Gas Market Revenue (billion) Forecast, by Application 2020 & 2033
- Table 92: Nigeria Hydrogen Gas Market Volume (Million) Forecast, by Application 2020 & 2033
- Table 93: Qatar Hydrogen Gas Market Revenue (billion) Forecast, by Application 2020 & 2033
- Table 94: Qatar Hydrogen Gas Market Volume (Million) Forecast, by Application 2020 & 2033
- Table 95: Egypt Hydrogen Gas Market Revenue (billion) Forecast, by Application 2020 & 2033
- Table 96: Egypt Hydrogen Gas Market Volume (Million) Forecast, by Application 2020 & 2033
- Table 97: United Arab Emirates Hydrogen Gas Market Revenue (billion) Forecast, by Application 2020 & 2033
- Table 98: United Arab Emirates Hydrogen Gas Market Volume (Million) Forecast, by Application 2020 & 2033
- Table 99: Rest of Middle East and Africa Hydrogen Gas Market Revenue (billion) Forecast, by Application 2020 & 2033
- Table 100: Rest of Middle East and Africa Hydrogen Gas Market Volume (Million) Forecast, by Application 2020 & 2033
Frequently Asked Questions
1. What is the projected Compound Annual Growth Rate (CAGR) of the Hydrogen Gas Market?
The projected CAGR is approximately 8.6%.
2. Which companies are prominent players in the Hydrogen Gas Market?
Key companies in the market include Equinor ASA, Air Products and Chemicals Inc, Universal Industrial Gases Inc *List Not Exhaustive, PAO NOVATEK, Gulf Cryo, Lords Chloro Alkali Limited, Gujarat Alkalies and Chemicals Limited, Matheson Tri-Gas Inc, BASF SE, Aditya Birla Chemicals, Linde plc, TAIYO NIPPON SANSO CORPORATION, Air Liquide, Messer SE & Co KGaA.
3. What are the main segments of the Hydrogen Gas Market?
The market segments include Distribution, Application.
4. Can you provide details about the market size?
The market size is estimated to be USD 204.86 billion as of 2022.
5. What are some drivers contributing to market growth?
Increasing Demand From Chemical Industry; Expanding Usage Of Hydrogen In Refinery.
6. What are the notable trends driving market growth?
Ammonia Production to Dominate the Market Demand.
7. Are there any restraints impacting market growth?
High Production Cost Of Blue And Green Hydrogen; High Transportation And Storage Cost.
8. Can you provide examples of recent developments in the market?
July 2022: Air Products and VPI (a power generator company) signed a joint development agreement for driving the 'Humber Hydrogen Hub' or 'H3', which seeks to develop an 800 MW low-carbon hydrogen production facility in Immingham, United Kingdom.
9. What pricing options are available for accessing the report?
Pricing options include single-user, multi-user, and enterprise licenses priced at USD 4750, USD 5250, and USD 8750 respectively.
10. Is the market size provided in terms of value or volume?
The market size is provided in terms of value, measured in billion and volume, measured in Million.
11. Are there any specific market keywords associated with the report?
Yes, the market keyword associated with the report is "Hydrogen Gas Market," which aids in identifying and referencing the specific market segment covered.
12. How do I determine which pricing option suits my needs best?
The pricing options vary based on user requirements and access needs. Individual users may opt for single-user licenses, while businesses requiring broader access may choose multi-user or enterprise licenses for cost-effective access to the report.
13. Are there any additional resources or data provided in the Hydrogen Gas Market report?
While the report offers comprehensive insights, it's advisable to review the specific contents or supplementary materials provided to ascertain if additional resources or data are available.
14. How can I stay updated on further developments or reports in the Hydrogen Gas Market?
To stay informed about further developments, trends, and reports in the Hydrogen Gas Market, consider subscribing to industry newsletters, following relevant companies and organizations, or regularly checking reputable industry news sources and publications.
Methodology
Step 1 - Identification of Relevant Samples Size from Population Database


Step 2 - Approaches for Defining Global Market Size (Value, Volume* & Price*)

Note*: In applicable scenarios
Step 3 - Data Sources
Primary Research
- Web Analytics
- Survey Reports
- Research Institute
- Latest Research Reports
- Opinion Leaders
Secondary Research
- Annual Reports
- White Paper
- Latest Press Release
- Industry Association
- Paid Database
- Investor Presentations

Step 4 - Data Triangulation
Involves using different sources of information in order to increase the validity of a study
These sources are likely to be stakeholders in a program - participants, other researchers, program staff, other community members, and so on.
Then we put all data in single framework & apply various statistical tools to find out the dynamic on the market.
During the analysis stage, feedback from the stakeholder groups would be compared to determine areas of agreement as well as areas of divergence