

Key Insights
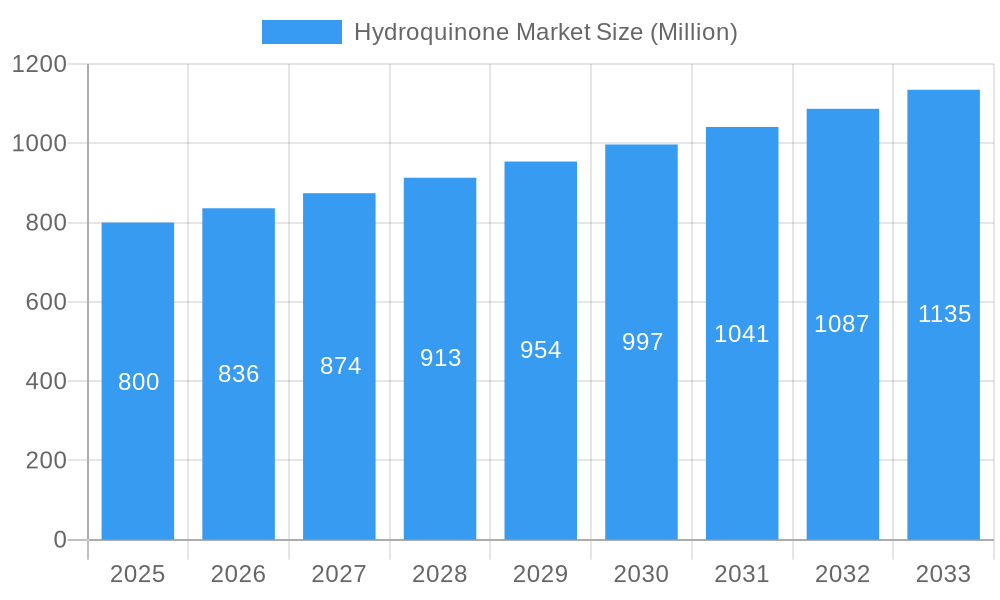
The global Hydroquinone market is poised for robust expansion, projected to reach a substantial market size of approximately $800 million by 2025, and further accelerate to an estimated $1.15 billion by 2033. This growth trajectory is underpinned by a healthy Compound Annual Growth Rate (CAGR) of 4.51% between 2025 and 2033. The market is predominantly driven by the increasing demand for hydroquinone as a versatile intermediate in various chemical synthesis processes, particularly in the production of polymers and antioxidants. Its efficacy in preventing polymerization and its role in photosensitive chemicals further bolster its market penetration. The expanding applications in the cosmetics industry, where it's utilized for skin lightening and as an antioxidant, alongside its critical functions in the polymers, paints and adhesives, and rubber sectors, are key contributors to this upward trend. The Asia Pacific region, led by major economies like China and India, is anticipated to dominate the market share, owing to its burgeoning industrial base and increasing consumer demand for products that utilize hydroquinone.
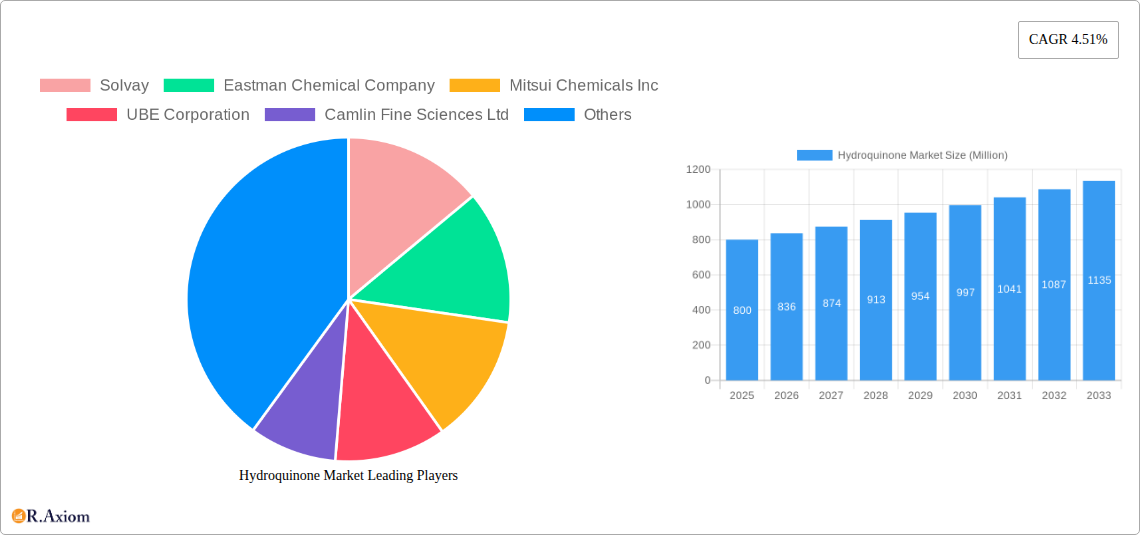
Hydroquinone Market Market Size (In Million)
While the market is characterized by strong growth, certain factors can influence its pace. The stringent regulatory landscape surrounding the use of hydroquinone in some applications, particularly in consumer products, could act as a restraint. However, continuous innovation in its applications and the development of safer alternatives or improved formulations are expected to mitigate these concerns. Emerging trends include a focus on sustainable production methods and the exploration of novel applications in niche chemical sectors. Key players such as Solvay, Eastman Chemical Company, and Mitsui Chemicals Inc. are actively investing in research and development to enhance their product portfolios and expand their geographical reach, ensuring a dynamic and competitive market environment. The sustained demand from established end-user industries and the emergence of new use cases will continue to shape the hydroquinone market landscape for the foreseeable future.
Hydroquinone Market Company Market Share
Hydroquinone Market: Comprehensive Industry Analysis and Forecast (2019-2033)
This in-depth report provides a comprehensive analysis of the global Hydroquinone (HQ) market, offering valuable insights into market dynamics, growth drivers, challenges, and opportunities. Covering the historical period from 2019 to 2024, the base year of 2025, and a detailed forecast extending to 2033, this report is an essential resource for stakeholders seeking to navigate the evolving landscape of the hydroquinone industry. Our analysis incorporates high-traffic keywords such as "hydroquinone market," "HQ market," "chemical intermediates," "antioxidant market," "polymerization inhibitors," and "cosmetic ingredients," ensuring maximum search visibility for industry professionals and decision-makers.
Hydroquinone Market Market Concentration & Innovation
The global Hydroquinone market exhibits a moderate to high concentration, with a few key players holding significant market share. Key companies like Solvay, Eastman Chemical Company, and Mitsui Chemicals Inc. are at the forefront of production and innovation. Innovation in the hydroquinone sector is driven by the demand for higher purity grades, sustainable production methods, and novel applications. Regulatory frameworks, particularly concerning safety and environmental impact, play a crucial role in shaping product development and market access. For instance, REACH regulations in Europe and similar mandates globally influence manufacturing processes and product formulations. Product substitutes, such as other phenolic compounds or specialized chemicals, exist but often come with trade-offs in terms of performance, cost, or specific application suitability. End-user trends are shifting towards greener chemistries and bio-based alternatives where feasible, although the unique properties of hydroquinone continue to drive its demand. Mergers and acquisitions (M&A) activity, while not currently at extremely high values, contributes to market consolidation and the expansion of market reach for leading entities. The market share of top players is estimated to be around 70% combined for the top five. M&A deal values are typically in the tens of millions for smaller strategic acquisitions.
Hydroquinone Market Industry Trends & Insights
The hydroquinone market is poised for steady growth, driven by an increasing demand for its versatile applications across a spectrum of industries. The global hydroquinone market size is projected to reach approximately \$700 million by 2025, with an estimated Compound Annual Growth Rate (CAGR) of 4.5% during the forecast period of 2025–2033. This growth is underpinned by several key factors. Firstly, the expanding cosmetics industry, particularly the demand for skin-lightening agents and anti-aging formulations, continues to be a significant market penetration driver. Although regulatory scrutiny in some regions impacts this segment, innovation in safer delivery systems and alternative formulations is emerging. Secondly, the polymers sector relies heavily on hydroquinone as a polymerization inhibitor, crucial for controlling the reaction rates and preventing premature polymerization during the manufacturing of plastics like acrylics and polyurethanes. The burgeoning automotive and construction industries, which are major consumers of these polymers, indirectly fuel hydroquinone demand. Thirdly, its role as a vital intermediate in the synthesis of various chemicals, including agrochemicals and pharmaceuticals, further solidifies its market position. Technological disruptions are minimal in terms of fundamental production processes, but advancements in purification techniques and waste reduction strategies are gaining traction. Consumer preferences are increasingly leaning towards efficacy and safety, pushing manufacturers to ensure high-purity hydroquinone and transparent sourcing. Competitive dynamics are characterized by a balance between established global players and regional manufacturers, with pricing strategies and product quality being key differentiators. The market penetration for hydroquinone in its core applications remains high, indicating a mature yet growing demand profile.
Dominant Markets & Segments in Hydroquinone Market
The Polymers end-user industry stands as a dominant force in the hydroquinone market, driven by the vast and continuous demand for polymerization inhibitors in the production of a wide array of plastics and resins. Economic policies supporting industrial manufacturing, coupled with robust infrastructure development globally, particularly in Asia Pacific and North America, bolster the polymer production sector. The Intermediate application segment also holds significant sway, serving as a foundational building block for numerous downstream chemical syntheses, including pharmaceuticals and agrochemicals.
Application: Intermediate:
- Key Drivers: Growing pharmaceutical research and development, increasing demand for crop protection chemicals, and its role in specialty chemical synthesis. Economic growth in developing nations often translates to increased demand for these downstream products.
- Dominance Analysis: This segment benefits from a broad industrial base. Its dominance is supported by the inherent necessity of hydroquinone in synthesizing complex molecules where its unique chemical structure is indispensable. The market size for this segment is estimated to be around \$250 million in 2025.
Application: Polymerization Inhibitor:
- Key Drivers: Expansion of the global plastics and resins industry, particularly in automotive, construction, and packaging sectors. Technological advancements in polymer science requiring precise control over polymerization processes.
- Dominance Analysis: This is arguably the largest application segment, with an estimated market size of \$300 million in 2025. The continuous need for stabilization during monomer storage and processing makes hydroquinone a critical additive. Its effectiveness and cost-efficiency make it a preferred choice.
Application: Antioxidant:
- Key Drivers: Demand in rubber and plastics manufacturing to prevent degradation and extend product lifespan. Growing use in industrial lubricants and greases.
- Dominance Analysis: While smaller than the Intermediate and Polymerization Inhibitor segments, the antioxidant application is crucial for maintaining product integrity across various industrial goods. Estimated market size of \$100 million in 2025.
End-user Industry: Polymers:
- Key Drivers: Growth in the automotive sector (lightweighting initiatives), construction (advanced building materials), and packaging industries.
- Dominance Analysis: This end-user industry directly consumes hydroquinone as a polymerization inhibitor. The sheer volume of polymers produced globally ensures a sustained and significant demand.
End-user Industry: Cosmetics:
- Key Drivers: Demand for skin-lightening and anti-aging products. Growing middle-class populations in emerging economies.
- Dominance Analysis: Historically a significant segment, its growth is now more nuanced due to regulatory restrictions and the emergence of alternative ingredients. However, in regions with less stringent regulations, it remains a notable market. Estimated market size of \$50 million in 2025, with potential for slower growth.
Hydroquinone Market Product Developments
Product developments in the hydroquinone market are largely focused on enhancing purity, improving production sustainability, and developing specialized grades for niche applications. Manufacturers are investing in advanced purification technologies to achieve higher assay hydroquinone, meeting the stringent requirements of the pharmaceutical and cosmetic industries. Innovations in greener manufacturing processes, aiming to reduce waste byproducts and energy consumption, are also gaining traction. These developments not only address environmental concerns but also offer competitive advantages through cost efficiencies and compliance with evolving regulations.
Report Scope & Segmentation Analysis
This report encompasses a comprehensive segmentation of the Hydroquinone market based on Application and End-user Industry. The Application segmentation includes Intermediate, Antioxidant, Polymerization Inhibitor, and Other Applications. The End-user Industry segmentation covers Cosmetics, Polymers, Paints and Adhesives, Rubber, and Other End-user Industries.
- Application: Intermediate: This segment is projected to exhibit a steady growth rate, driven by its foundational role in chemical synthesis. The market size is estimated to reach approximately \$350 million by 2033.
- Application: Polymerization Inhibitor: This segment is expected to continue its strong growth trajectory, fueled by the expansion of the global polymer industry. Forecasted market size is over \$450 million by 2033.
- Application: Antioxidant: This segment is anticipated to witness moderate growth, driven by its essential role in material protection. Projected market size is around \$150 million by 2033.
- End-user Industry: Cosmetics: While facing regulatory pressures in some regions, this segment is expected to see modest growth, particularly in emerging markets. Market size is estimated to reach \$70 million by 2033.
- End-user Industry: Polymers: This remains the dominant end-user industry, with significant growth prospects mirroring the expansion of the global plastics and resins market. Projected market size is over \$500 million by 2033.
- End-user Industry: Paints and Adhesives: This segment is expected to experience steady growth, aligned with construction and industrial manufacturing activities.
- End-user Industry: Rubber: Demand from the rubber industry for antioxidants will contribute to moderate growth.
Key Drivers of Hydroquinone Market Growth
The hydroquinone market growth is primarily propelled by the expanding global polymer industry, where it serves as a critical polymerization inhibitor. This demand is intrinsically linked to the growth in automotive, construction, and packaging sectors. Furthermore, its role as a key intermediate in the synthesis of pharmaceuticals and agrochemicals fuels consistent demand, especially with increased global focus on healthcare and food security. Technological advancements leading to more efficient and environmentally friendly production processes are also acting as growth catalysts, making hydroquinone more accessible and compliant with stringent regulations. The increasing demand for specialized chemicals in emerging economies further supports market expansion.
Challenges in the Hydroquinone Market Sector
Despite robust growth drivers, the hydroquinone market faces several challenges. Stringent regulatory frameworks concerning its use in cosmetics, particularly skin-lightening products, due to potential health concerns, can restrict market access and growth in certain regions. Fluctuations in raw material prices, primarily benzene, can impact production costs and profit margins. Supply chain disruptions, as witnessed in recent global events, can affect the availability and delivery of hydroquinone. Moreover, the development of alternative, greener chemicals for specific applications poses a competitive threat, necessitating continuous innovation and cost optimization from hydroquinone manufacturers.
Emerging Opportunities in Hydroquinone Market
Emerging opportunities in the hydroquinone market lie in the development of high-purity grades for advanced pharmaceutical intermediates and specialty chemicals. The growing trend towards sustainable manufacturing presents an opportunity for companies investing in eco-friendly production processes and bio-based sourcing of raw materials. Expansion in emerging economies, particularly in Asia Pacific and Latin America, driven by industrialization and increasing consumer demand for products utilizing hydroquinone, offers significant market potential. Furthermore, exploring novel applications beyond traditional uses, such as in advanced materials or electronics, could unlock new growth avenues.
Leading Players in the Hydroquinone Market Market
- Solvay
- Eastman Chemical Company
- Mitsui Chemicals Inc.
- UBE Corporation
- Camlin Fine Sciences Ltd
- YanCheng FengYang Chemical Co Ltd
- Haihang Industry
- TIANJIN ZHONGXIN CHEMTECH CO LTD (ZX CHEMTECH)
- Honeywell International Inc.
- Shanxi Jin-jin Chemical Co Ltd
- Kawaguchi Chemical Industry Co Ltd
Key Developments in Hydroquinone Market Industry
- February 2023: Solvay commenced the commercial production of its International Sustainability and Carbon Certification (ISCC) PLUS hydroquinone (HQ) product in Saint-Fons, France, signaling a move towards sustainable chemical production.
- 2022: Eastman Chemical Company announced strategic investments in expanding its production capacity for specialty chemicals, including hydroquinone derivatives, to meet growing market demand.
- 2021: UBE Corporation focused on optimizing its hydroquinone production processes to enhance efficiency and reduce environmental impact, aligning with global sustainability goals.
Strategic Outlook for Hydroquinone Market Market
The strategic outlook for the hydroquinone market remains positive, driven by its indispensable role in key industrial sectors like polymers and chemical synthesis. Continuous innovation in production efficiency, sustainability, and the development of high-purity grades will be critical for sustained growth. Companies that can navigate evolving regulatory landscapes and capitalize on the demand for specialty chemicals in emerging economies are best positioned for success. Strategic collaborations and potential mergers and acquisitions will also likely play a role in shaping the competitive dynamics of this vital chemical market.
Hydroquinone Market Segmentation
-
1. Application
- 1.1. Intermediate
- 1.2. Antioxidant
- 1.3. Polymerization Inhibitor
- 1.4. Photosensitive Chemical
- 1.5. Other Applications
-
2. End-user Industry
- 2.1. Cosmetics
- 2.2. Polymers
- 2.3. Paints and Adhesives
- 2.4. Rubber
- 2.5. Other End-user Industries
Hydroquinone Market Segmentation By Geography
-
1. Asia Pacific
- 1.1. China
- 1.2. India
- 1.3. Japan
- 1.4. South Korea
- 1.5. Malaysia
- 1.6. Thailand
- 1.7. Indonesia
- 1.8. Vietnam
- 1.9. Rest of Asia Pacific
-
2. North America
- 2.1. United States
- 2.2. Canada
- 2.3. Mexico
- 2.4. Rest of North America
-
3. Europe
- 3.1. Germany
- 3.2. United Kingdom
- 3.3. Italy
- 3.4. France
- 3.5. Russia
- 3.6. Spain
- 3.7. Turkey
- 3.8. Nordic Countries
- 3.9. Rest of Europe
-
4. South America
- 4.1. Brazil
- 4.2. Argentina
- 4.3. Colombia
- 4.4. Rest of South America
-
5. Middle East and Africa
- 5.1. Saudi Arabia
- 5.2. United Arab Emirates
- 5.3. Qatar
- 5.4. Egypt
- 5.5. Nigeria
- 5.6. South Africa
- 5.7. Rest of Middle East and Africa
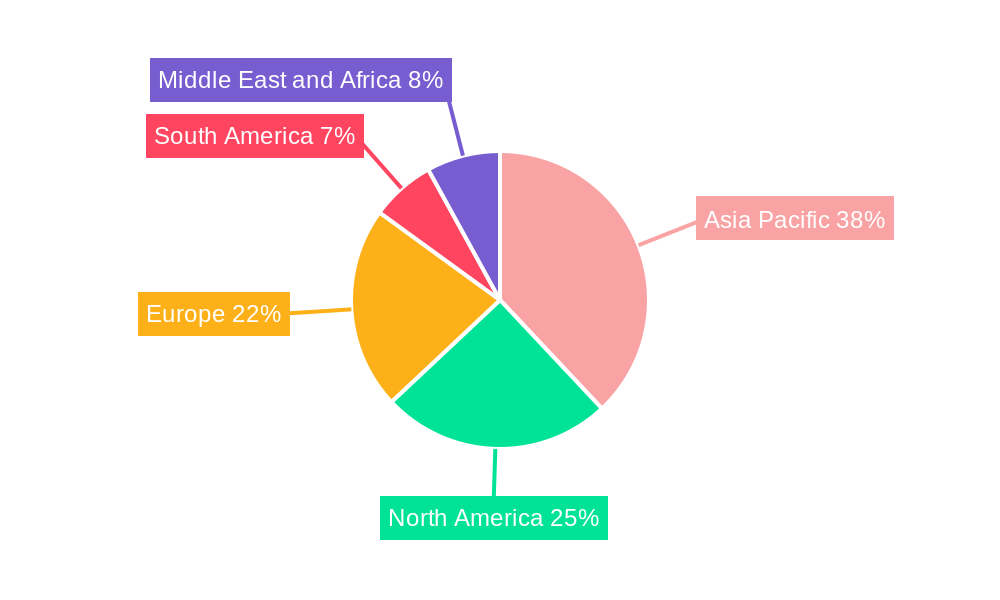
Hydroquinone Market Regional Market Share
Geographic Coverage of Hydroquinone Market
Hydroquinone Market REPORT HIGHLIGHTS
| Aspects | Details |
|---|---|
| Study Period | 2020-2034 |
| Base Year | 2025 |
| Estimated Year | 2026 |
| Forecast Period | 2026-2034 |
| Historical Period | 2020-2025 |
| Growth Rate | CAGR of 6.5% from 2020-2034 |
| Segmentation |
|
Table of Contents
- 1. Introduction
- 1.1. Research Scope
- 1.2. Market Segmentation
- 1.3. Research Objective
- 1.4. Definitions and Assumptions
- 2. Executive Summary
- 2.1. Market Snapshot
- 3. Market Dynamics
- 3.1. Market Drivers
- 3.2. Market Restrains
- 3.3. Market Trends
- 3.4. Market Opportunities
- 4. Market Factor Analysis
- 4.1. Porters Five Forces
- 4.1.1. Bargaining Power of Suppliers
- 4.1.2. Bargaining Power of Buyers
- 4.1.3. Threat of New Entrants
- 4.1.4. Threat of Substitutes
- 4.1.5. Competitive Rivalry
- 4.2. PESTEL analysis
- 4.3. BCG Analysis
- 4.3.1. Stars (High Growth, High Market Share)
- 4.3.2. Cash Cows (Low Growth, High Market Share)
- 4.3.3. Question Mark (High Growth, Low Market Share)
- 4.3.4. Dogs (Low Growth, Low Market Share)
- 4.4. Ansoff Matrix Analysis
- 4.5. Supply Chain Analysis
- 4.6. Regulatory Landscape
- 4.7. Current Market Potential and Opportunity Assessment (TAM–SAM–SOM Framework)
- 4.8. RAX Analyst Note
- 4.1. Porters Five Forces
- 5. Market Analysis, Insights and Forecast 2021-2033
- 5.1. Market Analysis, Insights and Forecast - by Application
- 5.1.1. Intermediate
- 5.1.2. Antioxidant
- 5.1.3. Polymerization Inhibitor
- 5.1.4. Photosensitive Chemical
- 5.1.5. Other Applications
- 5.2. Market Analysis, Insights and Forecast - by End-user Industry
- 5.2.1. Cosmetics
- 5.2.2. Polymers
- 5.2.3. Paints and Adhesives
- 5.2.4. Rubber
- 5.2.5. Other End-user Industries
- 5.3. Market Analysis, Insights and Forecast - by Region
- 5.3.1. Asia Pacific
- 5.3.2. North America
- 5.3.3. Europe
- 5.3.4. South America
- 5.3.5. Middle East and Africa
- 5.1. Market Analysis, Insights and Forecast - by Application
- 6. Global Hydroquinone Market Analysis, Insights and Forecast, 2021-2033
- 6.1. Market Analysis, Insights and Forecast - by Application
- 6.1.1. Intermediate
- 6.1.2. Antioxidant
- 6.1.3. Polymerization Inhibitor
- 6.1.4. Photosensitive Chemical
- 6.1.5. Other Applications
- 6.2. Market Analysis, Insights and Forecast - by End-user Industry
- 6.2.1. Cosmetics
- 6.2.2. Polymers
- 6.2.3. Paints and Adhesives
- 6.2.4. Rubber
- 6.2.5. Other End-user Industries
- 6.1. Market Analysis, Insights and Forecast - by Application
- 7. Asia Pacific Hydroquinone Market Analysis, Insights and Forecast, 2020-2032
- 7.1. Market Analysis, Insights and Forecast - by Application
- 7.1.1. Intermediate
- 7.1.2. Antioxidant
- 7.1.3. Polymerization Inhibitor
- 7.1.4. Photosensitive Chemical
- 7.1.5. Other Applications
- 7.2. Market Analysis, Insights and Forecast - by End-user Industry
- 7.2.1. Cosmetics
- 7.2.2. Polymers
- 7.2.3. Paints and Adhesives
- 7.2.4. Rubber
- 7.2.5. Other End-user Industries
- 7.1. Market Analysis, Insights and Forecast - by Application
- 8. North America Hydroquinone Market Analysis, Insights and Forecast, 2020-2032
- 8.1. Market Analysis, Insights and Forecast - by Application
- 8.1.1. Intermediate
- 8.1.2. Antioxidant
- 8.1.3. Polymerization Inhibitor
- 8.1.4. Photosensitive Chemical
- 8.1.5. Other Applications
- 8.2. Market Analysis, Insights and Forecast - by End-user Industry
- 8.2.1. Cosmetics
- 8.2.2. Polymers
- 8.2.3. Paints and Adhesives
- 8.2.4. Rubber
- 8.2.5. Other End-user Industries
- 8.1. Market Analysis, Insights and Forecast - by Application
- 9. Europe Hydroquinone Market Analysis, Insights and Forecast, 2020-2032
- 9.1. Market Analysis, Insights and Forecast - by Application
- 9.1.1. Intermediate
- 9.1.2. Antioxidant
- 9.1.3. Polymerization Inhibitor
- 9.1.4. Photosensitive Chemical
- 9.1.5. Other Applications
- 9.2. Market Analysis, Insights and Forecast - by End-user Industry
- 9.2.1. Cosmetics
- 9.2.2. Polymers
- 9.2.3. Paints and Adhesives
- 9.2.4. Rubber
- 9.2.5. Other End-user Industries
- 9.1. Market Analysis, Insights and Forecast - by Application
- 10. South America Hydroquinone Market Analysis, Insights and Forecast, 2020-2032
- 10.1. Market Analysis, Insights and Forecast - by Application
- 10.1.1. Intermediate
- 10.1.2. Antioxidant
- 10.1.3. Polymerization Inhibitor
- 10.1.4. Photosensitive Chemical
- 10.1.5. Other Applications
- 10.2. Market Analysis, Insights and Forecast - by End-user Industry
- 10.2.1. Cosmetics
- 10.2.2. Polymers
- 10.2.3. Paints and Adhesives
- 10.2.4. Rubber
- 10.2.5. Other End-user Industries
- 10.1. Market Analysis, Insights and Forecast - by Application
- 11. Middle East and Africa Hydroquinone Market Analysis, Insights and Forecast, 2020-2032
- 11.1. Market Analysis, Insights and Forecast - by Application
- 11.1.1. Intermediate
- 11.1.2. Antioxidant
- 11.1.3. Polymerization Inhibitor
- 11.1.4. Photosensitive Chemical
- 11.1.5. Other Applications
- 11.2. Market Analysis, Insights and Forecast - by End-user Industry
- 11.2.1. Cosmetics
- 11.2.2. Polymers
- 11.2.3. Paints and Adhesives
- 11.2.4. Rubber
- 11.2.5. Other End-user Industries
- 11.1. Market Analysis, Insights and Forecast - by Application
- 12. Competitive Analysis
- 12.1. Company Profiles
- 12.1.1 Solvay
- 12.1.1.1. Company Overview
- 12.1.1.2. Products
- 12.1.1.3. Company Financials
- 12.1.1.4. SWOT Analysis
- 12.1.2 Eastman Chemical Company
- 12.1.2.1. Company Overview
- 12.1.2.2. Products
- 12.1.2.3. Company Financials
- 12.1.2.4. SWOT Analysis
- 12.1.3 Mitsui Chemicals Inc
- 12.1.3.1. Company Overview
- 12.1.3.2. Products
- 12.1.3.3. Company Financials
- 12.1.3.4. SWOT Analysis
- 12.1.4 UBE Corporation
- 12.1.4.1. Company Overview
- 12.1.4.2. Products
- 12.1.4.3. Company Financials
- 12.1.4.4. SWOT Analysis
- 12.1.5 Camlin Fine Sciences Ltd
- 12.1.5.1. Company Overview
- 12.1.5.2. Products
- 12.1.5.3. Company Financials
- 12.1.5.4. SWOT Analysis
- 12.1.6 YanCheng FengYang Chemical Co Ltd
- 12.1.6.1. Company Overview
- 12.1.6.2. Products
- 12.1.6.3. Company Financials
- 12.1.6.4. SWOT Analysis
- 12.1.7 Haihang Industry
- 12.1.7.1. Company Overview
- 12.1.7.2. Products
- 12.1.7.3. Company Financials
- 12.1.7.4. SWOT Analysis
- 12.1.8 TIANJIN ZHONGXIN CHEMTECH CO LTD (ZX CHEMTECH)
- 12.1.8.1. Company Overview
- 12.1.8.2. Products
- 12.1.8.3. Company Financials
- 12.1.8.4. SWOT Analysis
- 12.1.9 Honeywell International Inc
- 12.1.9.1. Company Overview
- 12.1.9.2. Products
- 12.1.9.3. Company Financials
- 12.1.9.4. SWOT Analysis
- 12.1.10 Shanxi Jin-jin Chemical Co Ltd
- 12.1.10.1. Company Overview
- 12.1.10.2. Products
- 12.1.10.3. Company Financials
- 12.1.10.4. SWOT Analysis
- 12.1.11 Kawaguchi Chemical Industry Co Ltd*List Not Exhaustive
- 12.1.11.1. Company Overview
- 12.1.11.2. Products
- 12.1.11.3. Company Financials
- 12.1.11.4. SWOT Analysis
- 12.1.1 Solvay
- 12.2. Market Entropy
- 12.2.1 Company's Key Areas Served
- 12.2.2 Recent Developments
- 12.3. Company Market Share Analysis 2025
- 12.3.1 Top 5 Companies Market Share Analysis
- 12.3.2 Top 3 Companies Market Share Analysis
- 12.4. List of Potential Customers
- 13. Research Methodology
List of Figures
- Figure 1: Global Hydroquinone Market Revenue Breakdown (million, %) by Region 2025 & 2033
- Figure 2: Asia Pacific Hydroquinone Market Revenue (million), by Application 2025 & 2033
- Figure 3: Asia Pacific Hydroquinone Market Revenue Share (%), by Application 2025 & 2033
- Figure 4: Asia Pacific Hydroquinone Market Revenue (million), by End-user Industry 2025 & 2033
- Figure 5: Asia Pacific Hydroquinone Market Revenue Share (%), by End-user Industry 2025 & 2033
- Figure 6: Asia Pacific Hydroquinone Market Revenue (million), by Country 2025 & 2033
- Figure 7: Asia Pacific Hydroquinone Market Revenue Share (%), by Country 2025 & 2033
- Figure 8: North America Hydroquinone Market Revenue (million), by Application 2025 & 2033
- Figure 9: North America Hydroquinone Market Revenue Share (%), by Application 2025 & 2033
- Figure 10: North America Hydroquinone Market Revenue (million), by End-user Industry 2025 & 2033
- Figure 11: North America Hydroquinone Market Revenue Share (%), by End-user Industry 2025 & 2033
- Figure 12: North America Hydroquinone Market Revenue (million), by Country 2025 & 2033
- Figure 13: North America Hydroquinone Market Revenue Share (%), by Country 2025 & 2033
- Figure 14: Europe Hydroquinone Market Revenue (million), by Application 2025 & 2033
- Figure 15: Europe Hydroquinone Market Revenue Share (%), by Application 2025 & 2033
- Figure 16: Europe Hydroquinone Market Revenue (million), by End-user Industry 2025 & 2033
- Figure 17: Europe Hydroquinone Market Revenue Share (%), by End-user Industry 2025 & 2033
- Figure 18: Europe Hydroquinone Market Revenue (million), by Country 2025 & 2033
- Figure 19: Europe Hydroquinone Market Revenue Share (%), by Country 2025 & 2033
- Figure 20: South America Hydroquinone Market Revenue (million), by Application 2025 & 2033
- Figure 21: South America Hydroquinone Market Revenue Share (%), by Application 2025 & 2033
- Figure 22: South America Hydroquinone Market Revenue (million), by End-user Industry 2025 & 2033
- Figure 23: South America Hydroquinone Market Revenue Share (%), by End-user Industry 2025 & 2033
- Figure 24: South America Hydroquinone Market Revenue (million), by Country 2025 & 2033
- Figure 25: South America Hydroquinone Market Revenue Share (%), by Country 2025 & 2033
- Figure 26: Middle East and Africa Hydroquinone Market Revenue (million), by Application 2025 & 2033
- Figure 27: Middle East and Africa Hydroquinone Market Revenue Share (%), by Application 2025 & 2033
- Figure 28: Middle East and Africa Hydroquinone Market Revenue (million), by End-user Industry 2025 & 2033
- Figure 29: Middle East and Africa Hydroquinone Market Revenue Share (%), by End-user Industry 2025 & 2033
- Figure 30: Middle East and Africa Hydroquinone Market Revenue (million), by Country 2025 & 2033
- Figure 31: Middle East and Africa Hydroquinone Market Revenue Share (%), by Country 2025 & 2033
List of Tables
- Table 1: Global Hydroquinone Market Revenue million Forecast, by Application 2020 & 2033
- Table 2: Global Hydroquinone Market Revenue million Forecast, by End-user Industry 2020 & 2033
- Table 3: Global Hydroquinone Market Revenue million Forecast, by Region 2020 & 2033
- Table 4: Global Hydroquinone Market Revenue million Forecast, by Application 2020 & 2033
- Table 5: Global Hydroquinone Market Revenue million Forecast, by End-user Industry 2020 & 2033
- Table 6: Global Hydroquinone Market Revenue million Forecast, by Country 2020 & 2033
- Table 7: China Hydroquinone Market Revenue (million) Forecast, by Application 2020 & 2033
- Table 8: India Hydroquinone Market Revenue (million) Forecast, by Application 2020 & 2033
- Table 9: Japan Hydroquinone Market Revenue (million) Forecast, by Application 2020 & 2033
- Table 10: South Korea Hydroquinone Market Revenue (million) Forecast, by Application 2020 & 2033
- Table 11: Malaysia Hydroquinone Market Revenue (million) Forecast, by Application 2020 & 2033
- Table 12: Thailand Hydroquinone Market Revenue (million) Forecast, by Application 2020 & 2033
- Table 13: Indonesia Hydroquinone Market Revenue (million) Forecast, by Application 2020 & 2033
- Table 14: Vietnam Hydroquinone Market Revenue (million) Forecast, by Application 2020 & 2033
- Table 15: Rest of Asia Pacific Hydroquinone Market Revenue (million) Forecast, by Application 2020 & 2033
- Table 16: Global Hydroquinone Market Revenue million Forecast, by Application 2020 & 2033
- Table 17: Global Hydroquinone Market Revenue million Forecast, by End-user Industry 2020 & 2033
- Table 18: Global Hydroquinone Market Revenue million Forecast, by Country 2020 & 2033
- Table 19: United States Hydroquinone Market Revenue (million) Forecast, by Application 2020 & 2033
- Table 20: Canada Hydroquinone Market Revenue (million) Forecast, by Application 2020 & 2033
- Table 21: Mexico Hydroquinone Market Revenue (million) Forecast, by Application 2020 & 2033
- Table 22: Rest of North America Hydroquinone Market Revenue (million) Forecast, by Application 2020 & 2033
- Table 23: Global Hydroquinone Market Revenue million Forecast, by Application 2020 & 2033
- Table 24: Global Hydroquinone Market Revenue million Forecast, by End-user Industry 2020 & 2033
- Table 25: Global Hydroquinone Market Revenue million Forecast, by Country 2020 & 2033
- Table 26: Germany Hydroquinone Market Revenue (million) Forecast, by Application 2020 & 2033
- Table 27: United Kingdom Hydroquinone Market Revenue (million) Forecast, by Application 2020 & 2033
- Table 28: Italy Hydroquinone Market Revenue (million) Forecast, by Application 2020 & 2033
- Table 29: France Hydroquinone Market Revenue (million) Forecast, by Application 2020 & 2033
- Table 30: Russia Hydroquinone Market Revenue (million) Forecast, by Application 2020 & 2033
- Table 31: Spain Hydroquinone Market Revenue (million) Forecast, by Application 2020 & 2033
- Table 32: Turkey Hydroquinone Market Revenue (million) Forecast, by Application 2020 & 2033
- Table 33: Nordic Countries Hydroquinone Market Revenue (million) Forecast, by Application 2020 & 2033
- Table 34: Rest of Europe Hydroquinone Market Revenue (million) Forecast, by Application 2020 & 2033
- Table 35: Global Hydroquinone Market Revenue million Forecast, by Application 2020 & 2033
- Table 36: Global Hydroquinone Market Revenue million Forecast, by End-user Industry 2020 & 2033
- Table 37: Global Hydroquinone Market Revenue million Forecast, by Country 2020 & 2033
- Table 38: Brazil Hydroquinone Market Revenue (million) Forecast, by Application 2020 & 2033
- Table 39: Argentina Hydroquinone Market Revenue (million) Forecast, by Application 2020 & 2033
- Table 40: Colombia Hydroquinone Market Revenue (million) Forecast, by Application 2020 & 2033
- Table 41: Rest of South America Hydroquinone Market Revenue (million) Forecast, by Application 2020 & 2033
- Table 42: Global Hydroquinone Market Revenue million Forecast, by Application 2020 & 2033
- Table 43: Global Hydroquinone Market Revenue million Forecast, by End-user Industry 2020 & 2033
- Table 44: Global Hydroquinone Market Revenue million Forecast, by Country 2020 & 2033
- Table 45: Saudi Arabia Hydroquinone Market Revenue (million) Forecast, by Application 2020 & 2033
- Table 46: United Arab Emirates Hydroquinone Market Revenue (million) Forecast, by Application 2020 & 2033
- Table 47: Qatar Hydroquinone Market Revenue (million) Forecast, by Application 2020 & 2033
- Table 48: Egypt Hydroquinone Market Revenue (million) Forecast, by Application 2020 & 2033
- Table 49: Nigeria Hydroquinone Market Revenue (million) Forecast, by Application 2020 & 2033
- Table 50: South Africa Hydroquinone Market Revenue (million) Forecast, by Application 2020 & 2033
- Table 51: Rest of Middle East and Africa Hydroquinone Market Revenue (million) Forecast, by Application 2020 & 2033
Frequently Asked Questions
1. What is the projected Compound Annual Growth Rate (CAGR) of the Hydroquinone Market?
The projected CAGR is approximately 6.5%.
2. Which companies are prominent players in the Hydroquinone Market?
Key companies in the market include Solvay, Eastman Chemical Company, Mitsui Chemicals Inc, UBE Corporation, Camlin Fine Sciences Ltd, YanCheng FengYang Chemical Co Ltd, Haihang Industry, TIANJIN ZHONGXIN CHEMTECH CO LTD (ZX CHEMTECH), Honeywell International Inc, Shanxi Jin-jin Chemical Co Ltd, Kawaguchi Chemical Industry Co Ltd*List Not Exhaustive.
3. What are the main segments of the Hydroquinone Market?
The market segments include Application, End-user Industry.
4. Can you provide details about the market size?
The market size is estimated to be USD 550 million as of 2022.
5. What are some drivers contributing to market growth?
Rising Demand for Rubber; Surging Demand for Hydroquinone from the Paint Industry.
6. What are the notable trends driving market growth?
Increasing Demand from the Rubber Industry.
7. Are there any restraints impacting market growth?
Rising Demand for Rubber; Surging Demand for Hydroquinone from the Paint Industry.
8. Can you provide examples of recent developments in the market?
February 2023: Solvay commenced the commercial production of its International Sustainability and Carbon Certification (ISCC) PLUS hydroquinone (HQ) product in Saint-Fons, France.
9. What pricing options are available for accessing the report?
Pricing options include single-user, multi-user, and enterprise licenses priced at USD 4750, USD 5250, and USD 8750 respectively.
10. Is the market size provided in terms of value or volume?
The market size is provided in terms of value, measured in million.
11. Are there any specific market keywords associated with the report?
Yes, the market keyword associated with the report is "Hydroquinone Market," which aids in identifying and referencing the specific market segment covered.
12. How do I determine which pricing option suits my needs best?
The pricing options vary based on user requirements and access needs. Individual users may opt for single-user licenses, while businesses requiring broader access may choose multi-user or enterprise licenses for cost-effective access to the report.
13. Are there any additional resources or data provided in the Hydroquinone Market report?
While the report offers comprehensive insights, it's advisable to review the specific contents or supplementary materials provided to ascertain if additional resources or data are available.
14. How can I stay updated on further developments or reports in the Hydroquinone Market?
To stay informed about further developments, trends, and reports in the Hydroquinone Market, consider subscribing to industry newsletters, following relevant companies and organizations, or regularly checking reputable industry news sources and publications.
Methodology
Step 1 - Identification of Relevant Samples Size from Population Database


Step 2 - Approaches for Defining Global Market Size (Value, Volume* & Price*)

Note*: In applicable scenarios
Step 3 - Data Sources
Primary Research
- Web Analytics
- Survey Reports
- Research Institute
- Latest Research Reports
- Opinion Leaders
Secondary Research
- Annual Reports
- White Paper
- Latest Press Release
- Industry Association
- Paid Database
- Investor Presentations

Step 4 - Data Triangulation
Involves using different sources of information in order to increase the validity of a study
These sources are likely to be stakeholders in a program - participants, other researchers, program staff, other community members, and so on.
Then we put all data in single framework & apply various statistical tools to find out the dynamic on the market.
During the analysis stage, feedback from the stakeholder groups would be compared to determine areas of agreement as well as areas of divergence