

Key Insights
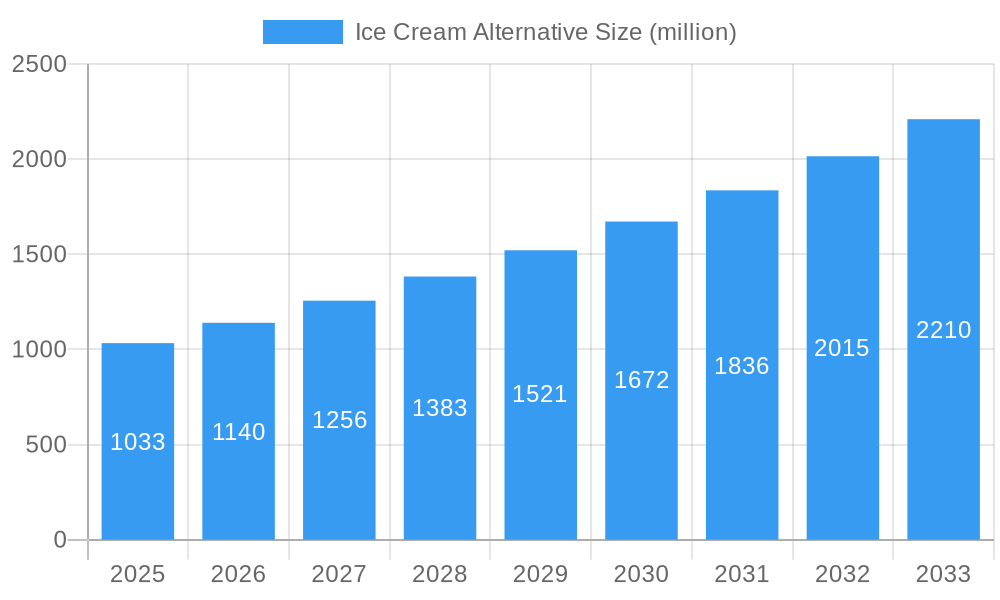
The global ice cream alternative market, valued at $1.033 billion in 2025, is projected to experience robust growth, exhibiting a compound annual growth rate (CAGR) of 10.4% from 2025 to 2033. This expansion is fueled by several key drivers. The rising prevalence of lactose intolerance and dairy allergies is a significant factor, driving demand for dairy-free alternatives such as plant-based ice creams made from ingredients like almond milk, soy milk, coconut milk, and oat milk. Furthermore, increasing consumer awareness of health and wellness, coupled with a growing preference for low-sugar, low-calorie, and high-protein options, is significantly boosting market growth. The rising popularity of veganism and vegetarianism also contributes to the market's expansion, as consumers actively seek plant-based alternatives to traditional dairy products. Major players like Danone, Naturli' Foods, Halo Top, and Ben & Jerry's are capitalizing on these trends through product innovation and strategic marketing, introducing a wide array of flavors and formats to cater to diverse consumer preferences. The market also witnesses a growing demand for organic and sustainably sourced ingredients, pushing manufacturers towards eco-friendly production practices.
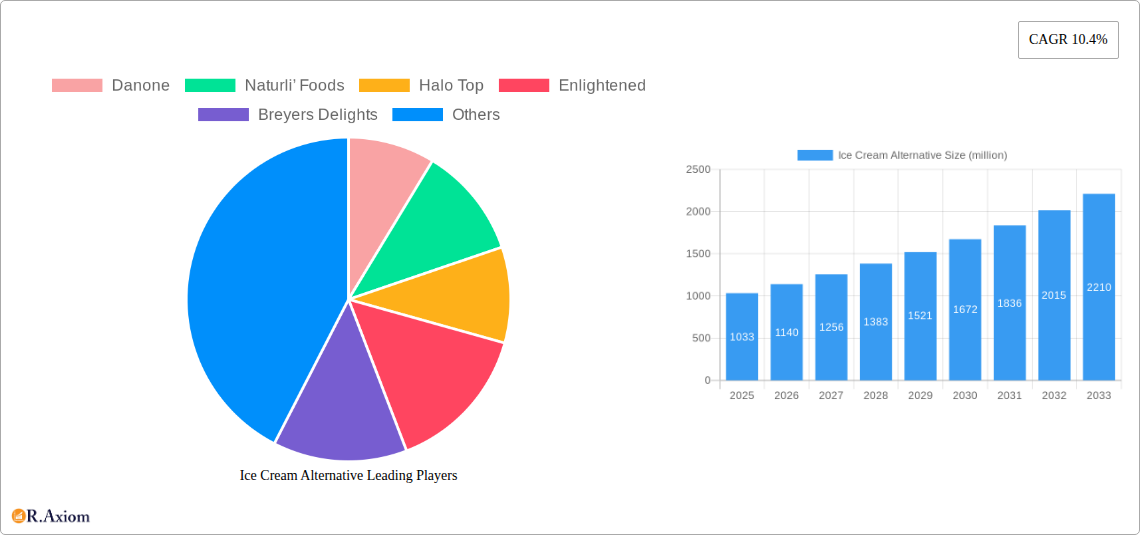
Ice Cream Alternative Market Size (In Billion)
However, certain restraints exist. The higher price point of ice cream alternatives compared to traditional ice cream remains a barrier for price-sensitive consumers. Furthermore, maintaining the desired texture, taste, and creamy consistency in plant-based ice creams presents a manufacturing challenge that needs continuous improvement. Despite these restraints, the market's growth trajectory remains positive, driven by the strong appeal of health-conscious consumers and the ongoing innovation within the industry, creating exciting possibilities for both established players and new entrants. The market segmentation, while not fully provided, likely includes categories based on product type (e.g., soy-based, almond-based, coconut-based), distribution channels (e.g., retail, food service), and product claims (e.g., organic, low-sugar, high-protein). Geographical segmentation will likely show strong growth in North America and Europe, initially, followed by expansion in Asia-Pacific and other regions as consumer awareness increases.
Ice Cream Alternative Company Market Share
Ice Cream Alternative Market Report: 2019-2033
This comprehensive report provides an in-depth analysis of the global ice cream alternative market, projecting a value exceeding $xx million by 2033. The study covers the period 2019-2033, with a focus on the forecast period 2025-2033 and a base year of 2025. Key players such as Danone, Naturli’ Foods, Halo Top, Enlightened, Breyers Delights, Arctic Zero, Ben & Jerry's, NadaMoo, So Delicious Dairy Free, and Yasso are analyzed for their market share, strategies, and future potential. This report is essential for investors, industry stakeholders, and market entrants seeking to understand the dynamics and opportunities within this rapidly growing sector.
Ice Cream Alternative Market Concentration & Innovation
The ice cream alternative market is experiencing dynamic shifts in concentration and innovation. While established players like Danone and Ben & Jerry's hold significant market share (estimated at xx% and xx% respectively in 2025), smaller, specialized brands like Halo Top and Enlightened are disrupting the market with innovative product offerings. The market displays a moderate level of concentration, with the top five players commanding approximately xx% of the global market in 2025.
- Market Share (2025, Estimated): Danone (xx%), Ben & Jerry's (xx%), Halo Top (xx%), Enlightened (xx%), Others (xx%)
- Innovation Drivers: Increasing consumer demand for healthier and plant-based options, technological advancements in creating realistic textures and flavors, and expanding distribution channels are key innovation drivers.
- Regulatory Frameworks: Varying regulations across different regions regarding labeling, ingredient sourcing, and health claims influence market dynamics.
- Mergers & Acquisitions (M&A): The past five years have witnessed significant M&A activity, with deal values totaling over $xx million (2019-2024). These activities reflect strategic efforts by larger companies to expand their portfolios and gain access to new technologies and market segments. Examples include (provide specific examples if available, otherwise state "Specific examples are not available within the scope of this study").
Ice Cream Alternative Industry Trends & Insights
The global ice cream alternative market is witnessing robust growth, driven by several key factors. The compound annual growth rate (CAGR) is projected to be xx% during the forecast period (2025-2033), exceeding $xx million by 2033.
Market penetration for plant-based ice cream alternatives is increasing significantly, with consumers increasingly embracing vegan and dairy-free options due to health, ethical, and environmental concerns. Technological advancements are leading to improved product textures and flavors, making these alternatives more appealing to a broader consumer base. Competitive dynamics are marked by intense innovation, with companies constantly striving to offer unique product formulations and flavors.
Consumer preferences are shifting towards healthier and more sustainable options, prompting manufacturers to incorporate organic ingredients, reduce sugar content, and highlight the sustainability credentials of their products. This trend, combined with the rising prevalence of lactose intolerance and veganism, fuels market expansion. Market segmentation continues to evolve, with niche categories such as low-carb, high-protein, and organic ice cream alternatives gaining traction.
Dominant Markets & Segments in Ice Cream Alternative
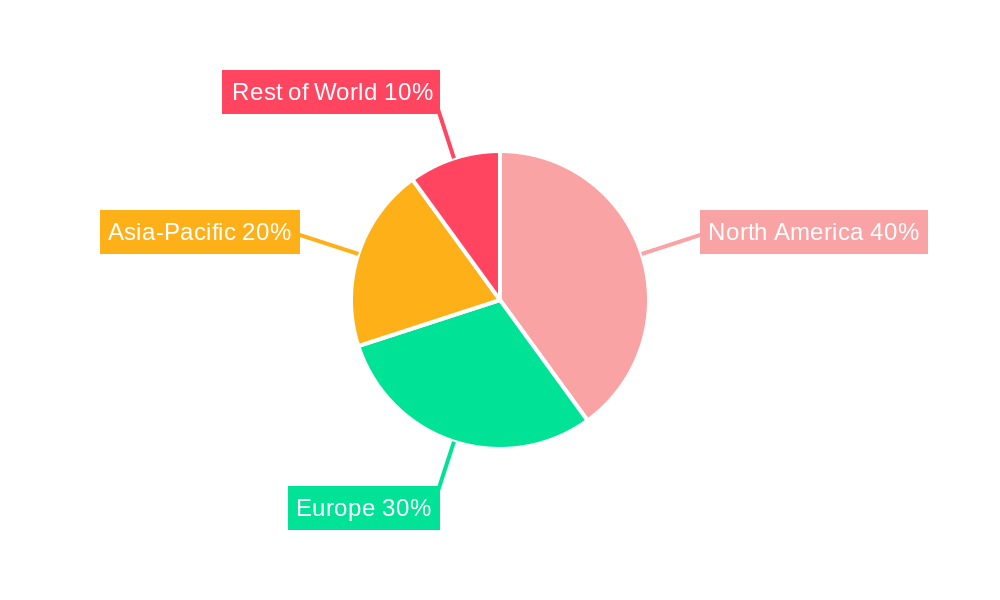
North America is the dominant market for ice cream alternatives, driven by high consumer awareness, strong demand for plant-based products, and a well-established distribution infrastructure. The region is expected to maintain its leading position throughout the forecast period.
- Key Drivers in North America:
- High disposable incomes and increasing consumer spending on premium food products.
- Strong presence of established and emerging ice cream alternative brands.
- Extensive retail channels and e-commerce platforms.
- Favorable government policies promoting sustainable and plant-based food options.
Other regions, including Europe and Asia-Pacific, are also experiencing significant growth, although at a slightly slower pace compared to North America. This slower pace is primarily due to variations in consumer awareness and preferences, alongside differing levels of development in retail infrastructure and distribution networks. The market is segmented by product type (e.g., plant-based, low-fat, low-sugar), distribution channel (e.g., retail, food service), and consumer demographics.
Ice Cream Alternative Product Developments
Recent product innovations focus on enhancing the sensory experience of ice cream alternatives. This includes developing more creamy textures, rich flavor profiles, and improved nutritional value. Technological advancements, such as the use of innovative stabilizers and emulsifiers, are improving the overall quality and appeal of these products. New product launches include dairy-free options using alternative milks like almond, soy, oat, and coconut milk, and cater to specific dietary needs like vegan, ketogenic, and gluten-free lifestyles. These new product introductions ensure a strong market fit and solidify their position in a competitive landscape.
Report Scope & Segmentation Analysis
This report segments the ice cream alternative market across several key parameters:
By Product Type: Plant-based (soy, almond, coconut, oat, etc.), low-fat, low-sugar, organic, and others. The plant-based segment is expected to exhibit the highest growth throughout the forecast period due to increasing consumer demand.
By Distribution Channel: Retail (supermarkets, hypermarkets, convenience stores), food service (restaurants, cafes, hotels), online retail (e-commerce platforms). Retail channels currently hold the largest market share, but online sales are growing at a faster rate.
By Region: North America, Europe, Asia-Pacific, Rest of the World. North America dominates currently and is projected to retain its lead.
Each segment's growth projections, market size, and competitive dynamics are thoroughly analyzed within the report.
Key Drivers of Ice Cream Alternative Growth
Several factors drive the growth of the ice cream alternative market:
- Rising health consciousness: Consumers are increasingly seeking healthier food options, leading to a higher demand for low-fat, low-sugar, and plant-based alternatives.
- Growing vegan and vegetarian population: The rising number of people adopting vegan and vegetarian lifestyles fuels demand for dairy-free options.
- Technological advancements: Innovations in food technology have resulted in more palatable and realistic ice cream alternatives.
- Increased availability and affordability: Ice cream alternatives are becoming increasingly available and affordable, making them accessible to a wider consumer base.
Challenges in the Ice Cream Alternative Sector
Despite its growth potential, the ice cream alternative market faces some challenges:
- High production costs: The production of some plant-based alternatives can be more expensive than traditional ice cream, impacting affordability.
- Maintaining product quality and consistency: Achieving the same creamy texture and rich taste as traditional ice cream remains a challenge.
- Limited shelf life: Some plant-based alternatives have shorter shelf lives compared to traditional ice cream.
- Competition from traditional ice cream manufacturers: Traditional ice cream brands are launching their own healthier and plant-based options, intensifying competition.
Emerging Opportunities in Ice Cream Alternative
Several emerging opportunities exist within the ice cream alternative market:
- Expansion into new markets: Developing countries offer significant growth potential due to rising disposable incomes and changing consumer preferences.
- Development of novel flavors and ingredients: Creating innovative and unique flavor combinations can attract new customers.
- Focus on sustainability: Consumers increasingly prefer sustainable and ethically sourced products, creating an opportunity for brands to highlight their environmental credentials.
- Increased personalization and customization: Offering customized options based on dietary needs and preferences is an emerging trend.
Leading Players in the Ice Cream Alternative Market
- Danone
- Naturli’ Foods
- Halo Top
- Enlightened
- Breyers Delights
- Arctic Zero
- Ben & Jerry's
- NadaMoo
- So Delicious Dairy Free
- Yasso
Key Developments in Ice Cream Alternative Industry
- 2022-Q4: Launch of a new line of oat milk-based ice cream alternatives by So Delicious Dairy Free.
- 2023-Q1: Danone acquires a smaller ice cream alternative company, expanding its portfolio. (Specific details are not available within the scope of this study)
- 2023-Q2: Ben & Jerry's introduces a new range of low-sugar ice cream alternatives.
- (Add more key developments with specific dates and descriptions as available)
Strategic Outlook for Ice Cream Alternative Market
The ice cream alternative market is poised for significant growth, driven by evolving consumer preferences and technological advancements. Companies that successfully innovate, adapt to changing market demands, and capitalize on emerging opportunities will thrive in this dynamic sector. Future growth will be shaped by factors such as increased product diversification, improved sustainability efforts, and enhanced distribution networks. The market holds immense potential, particularly in expanding into new geographical areas and developing tailored products to meet niche dietary needs and preferences.
Ice Cream Alternative Segmentation
-
1. Application
- 1.1. Application 1
- 1.2. by Application
- 1.3. Retail
- 1.4. Food Service
-
2. Types
- 2.1. Soy Ice Cream
- 2.2. Almond Ice Cream
- 2.3. Coconut Ice Cream
- 2.4. Cashew Ice Cream
- 2.5. Others
Ice Cream Alternative Segmentation By Geography
-
1. North America
- 1.1. United States
- 1.2. Canada
- 1.3. Mexico
-
2. South America
- 2.1. Brazil
- 2.2. Argentina
- 2.3. Rest of South America
-
3. Europe
- 3.1. United Kingdom
- 3.2. Germany
- 3.3. France
- 3.4. Italy
- 3.5. Spain
- 3.6. Russia
- 3.7. Benelux
- 3.8. Nordics
- 3.9. Rest of Europe
-
4. Middle East & Africa
- 4.1. Turkey
- 4.2. Israel
- 4.3. GCC
- 4.4. North Africa
- 4.5. South Africa
- 4.6. Rest of Middle East & Africa
-
5. Asia Pacific
- 5.1. China
- 5.2. India
- 5.3. Japan
- 5.4. South Korea
- 5.5. ASEAN
- 5.6. Oceania
- 5.7. Rest of Asia Pacific
Ice Cream Alternative Regional Market Share
Geographic Coverage of Ice Cream Alternative
Ice Cream Alternative REPORT HIGHLIGHTS
| Aspects | Details |
|---|---|
| Study Period | 2020-2034 |
| Base Year | 2025 |
| Estimated Year | 2026 |
| Forecast Period | 2026-2034 |
| Historical Period | 2020-2025 |
| Growth Rate | CAGR of 10.4% from 2020-2034 |
| Segmentation |
|
Table of Contents
- 1. Introduction
- 1.1. Research Scope
- 1.2. Market Segmentation
- 1.3. Research Methodology
- 1.4. Definitions and Assumptions
- 2. Executive Summary
- 2.1. Introduction
- 3. Market Dynamics
- 3.1. Introduction
- 3.2. Market Drivers
- 3.3. Market Restrains
- 3.4. Market Trends
- 4. Market Factor Analysis
- 4.1. Porters Five Forces
- 4.2. Supply/Value Chain
- 4.3. PESTEL analysis
- 4.4. Market Entropy
- 4.5. Patent/Trademark Analysis
- 5. Global Ice Cream Alternative Analysis, Insights and Forecast, 2020-2032
- 5.1. Market Analysis, Insights and Forecast - by Application
- 5.1.1. Application 1
- 5.1.2. by Application
- 5.1.3. Retail
- 5.1.4. Food Service
- 5.2. Market Analysis, Insights and Forecast - by Types
- 5.2.1. Soy Ice Cream
- 5.2.2. Almond Ice Cream
- 5.2.3. Coconut Ice Cream
- 5.2.4. Cashew Ice Cream
- 5.2.5. Others
- 5.3. Market Analysis, Insights and Forecast - by Region
- 5.3.1. North America
- 5.3.2. South America
- 5.3.3. Europe
- 5.3.4. Middle East & Africa
- 5.3.5. Asia Pacific
- 5.1. Market Analysis, Insights and Forecast - by Application
- 6. North America Ice Cream Alternative Analysis, Insights and Forecast, 2020-2032
- 6.1. Market Analysis, Insights and Forecast - by Application
- 6.1.1. Application 1
- 6.1.2. by Application
- 6.1.3. Retail
- 6.1.4. Food Service
- 6.2. Market Analysis, Insights and Forecast - by Types
- 6.2.1. Soy Ice Cream
- 6.2.2. Almond Ice Cream
- 6.2.3. Coconut Ice Cream
- 6.2.4. Cashew Ice Cream
- 6.2.5. Others
- 6.1. Market Analysis, Insights and Forecast - by Application
- 7. South America Ice Cream Alternative Analysis, Insights and Forecast, 2020-2032
- 7.1. Market Analysis, Insights and Forecast - by Application
- 7.1.1. Application 1
- 7.1.2. by Application
- 7.1.3. Retail
- 7.1.4. Food Service
- 7.2. Market Analysis, Insights and Forecast - by Types
- 7.2.1. Soy Ice Cream
- 7.2.2. Almond Ice Cream
- 7.2.3. Coconut Ice Cream
- 7.2.4. Cashew Ice Cream
- 7.2.5. Others
- 7.1. Market Analysis, Insights and Forecast - by Application
- 8. Europe Ice Cream Alternative Analysis, Insights and Forecast, 2020-2032
- 8.1. Market Analysis, Insights and Forecast - by Application
- 8.1.1. Application 1
- 8.1.2. by Application
- 8.1.3. Retail
- 8.1.4. Food Service
- 8.2. Market Analysis, Insights and Forecast - by Types
- 8.2.1. Soy Ice Cream
- 8.2.2. Almond Ice Cream
- 8.2.3. Coconut Ice Cream
- 8.2.4. Cashew Ice Cream
- 8.2.5. Others
- 8.1. Market Analysis, Insights and Forecast - by Application
- 9. Middle East & Africa Ice Cream Alternative Analysis, Insights and Forecast, 2020-2032
- 9.1. Market Analysis, Insights and Forecast - by Application
- 9.1.1. Application 1
- 9.1.2. by Application
- 9.1.3. Retail
- 9.1.4. Food Service
- 9.2. Market Analysis, Insights and Forecast - by Types
- 9.2.1. Soy Ice Cream
- 9.2.2. Almond Ice Cream
- 9.2.3. Coconut Ice Cream
- 9.2.4. Cashew Ice Cream
- 9.2.5. Others
- 9.1. Market Analysis, Insights and Forecast - by Application
- 10. Asia Pacific Ice Cream Alternative Analysis, Insights and Forecast, 2020-2032
- 10.1. Market Analysis, Insights and Forecast - by Application
- 10.1.1. Application 1
- 10.1.2. by Application
- 10.1.3. Retail
- 10.1.4. Food Service
- 10.2. Market Analysis, Insights and Forecast - by Types
- 10.2.1. Soy Ice Cream
- 10.2.2. Almond Ice Cream
- 10.2.3. Coconut Ice Cream
- 10.2.4. Cashew Ice Cream
- 10.2.5. Others
- 10.1. Market Analysis, Insights and Forecast - by Application
- 11. Competitive Analysis
- 11.1. Global Market Share Analysis 2025
- 11.2. Company Profiles
- 11.2.1 Danone
- 11.2.1.1. Overview
- 11.2.1.2. Products
- 11.2.1.3. SWOT Analysis
- 11.2.1.4. Recent Developments
- 11.2.1.5. Financials (Based on Availability)
- 11.2.2 Naturli’ Foods
- 11.2.2.1. Overview
- 11.2.2.2. Products
- 11.2.2.3. SWOT Analysis
- 11.2.2.4. Recent Developments
- 11.2.2.5. Financials (Based on Availability)
- 11.2.3 Halo Top
- 11.2.3.1. Overview
- 11.2.3.2. Products
- 11.2.3.3. SWOT Analysis
- 11.2.3.4. Recent Developments
- 11.2.3.5. Financials (Based on Availability)
- 11.2.4 Enlightened
- 11.2.4.1. Overview
- 11.2.4.2. Products
- 11.2.4.3. SWOT Analysis
- 11.2.4.4. Recent Developments
- 11.2.4.5. Financials (Based on Availability)
- 11.2.5 Breyers Delights
- 11.2.5.1. Overview
- 11.2.5.2. Products
- 11.2.5.3. SWOT Analysis
- 11.2.5.4. Recent Developments
- 11.2.5.5. Financials (Based on Availability)
- 11.2.6 Arctic Zero
- 11.2.6.1. Overview
- 11.2.6.2. Products
- 11.2.6.3. SWOT Analysis
- 11.2.6.4. Recent Developments
- 11.2.6.5. Financials (Based on Availability)
- 11.2.7 Ben & Jerry's
- 11.2.7.1. Overview
- 11.2.7.2. Products
- 11.2.7.3. SWOT Analysis
- 11.2.7.4. Recent Developments
- 11.2.7.5. Financials (Based on Availability)
- 11.2.8 NadaMoo
- 11.2.8.1. Overview
- 11.2.8.2. Products
- 11.2.8.3. SWOT Analysis
- 11.2.8.4. Recent Developments
- 11.2.8.5. Financials (Based on Availability)
- 11.2.9 So Delicious Dairy Free
- 11.2.9.1. Overview
- 11.2.9.2. Products
- 11.2.9.3. SWOT Analysis
- 11.2.9.4. Recent Developments
- 11.2.9.5. Financials (Based on Availability)
- 11.2.10 Yasso
- 11.2.10.1. Overview
- 11.2.10.2. Products
- 11.2.10.3. SWOT Analysis
- 11.2.10.4. Recent Developments
- 11.2.10.5. Financials (Based on Availability)
- 11.2.1 Danone
List of Figures
- Figure 1: Global Ice Cream Alternative Revenue Breakdown (million, %) by Region 2025 & 2033
- Figure 2: North America Ice Cream Alternative Revenue (million), by Application 2025 & 2033
- Figure 3: North America Ice Cream Alternative Revenue Share (%), by Application 2025 & 2033
- Figure 4: North America Ice Cream Alternative Revenue (million), by Types 2025 & 2033
- Figure 5: North America Ice Cream Alternative Revenue Share (%), by Types 2025 & 2033
- Figure 6: North America Ice Cream Alternative Revenue (million), by Country 2025 & 2033
- Figure 7: North America Ice Cream Alternative Revenue Share (%), by Country 2025 & 2033
- Figure 8: South America Ice Cream Alternative Revenue (million), by Application 2025 & 2033
- Figure 9: South America Ice Cream Alternative Revenue Share (%), by Application 2025 & 2033
- Figure 10: South America Ice Cream Alternative Revenue (million), by Types 2025 & 2033
- Figure 11: South America Ice Cream Alternative Revenue Share (%), by Types 2025 & 2033
- Figure 12: South America Ice Cream Alternative Revenue (million), by Country 2025 & 2033
- Figure 13: South America Ice Cream Alternative Revenue Share (%), by Country 2025 & 2033
- Figure 14: Europe Ice Cream Alternative Revenue (million), by Application 2025 & 2033
- Figure 15: Europe Ice Cream Alternative Revenue Share (%), by Application 2025 & 2033
- Figure 16: Europe Ice Cream Alternative Revenue (million), by Types 2025 & 2033
- Figure 17: Europe Ice Cream Alternative Revenue Share (%), by Types 2025 & 2033
- Figure 18: Europe Ice Cream Alternative Revenue (million), by Country 2025 & 2033
- Figure 19: Europe Ice Cream Alternative Revenue Share (%), by Country 2025 & 2033
- Figure 20: Middle East & Africa Ice Cream Alternative Revenue (million), by Application 2025 & 2033
- Figure 21: Middle East & Africa Ice Cream Alternative Revenue Share (%), by Application 2025 & 2033
- Figure 22: Middle East & Africa Ice Cream Alternative Revenue (million), by Types 2025 & 2033
- Figure 23: Middle East & Africa Ice Cream Alternative Revenue Share (%), by Types 2025 & 2033
- Figure 24: Middle East & Africa Ice Cream Alternative Revenue (million), by Country 2025 & 2033
- Figure 25: Middle East & Africa Ice Cream Alternative Revenue Share (%), by Country 2025 & 2033
- Figure 26: Asia Pacific Ice Cream Alternative Revenue (million), by Application 2025 & 2033
- Figure 27: Asia Pacific Ice Cream Alternative Revenue Share (%), by Application 2025 & 2033
- Figure 28: Asia Pacific Ice Cream Alternative Revenue (million), by Types 2025 & 2033
- Figure 29: Asia Pacific Ice Cream Alternative Revenue Share (%), by Types 2025 & 2033
- Figure 30: Asia Pacific Ice Cream Alternative Revenue (million), by Country 2025 & 2033
- Figure 31: Asia Pacific Ice Cream Alternative Revenue Share (%), by Country 2025 & 2033
List of Tables
- Table 1: Global Ice Cream Alternative Revenue million Forecast, by Application 2020 & 2033
- Table 2: Global Ice Cream Alternative Revenue million Forecast, by Types 2020 & 2033
- Table 3: Global Ice Cream Alternative Revenue million Forecast, by Region 2020 & 2033
- Table 4: Global Ice Cream Alternative Revenue million Forecast, by Application 2020 & 2033
- Table 5: Global Ice Cream Alternative Revenue million Forecast, by Types 2020 & 2033
- Table 6: Global Ice Cream Alternative Revenue million Forecast, by Country 2020 & 2033
- Table 7: United States Ice Cream Alternative Revenue (million) Forecast, by Application 2020 & 2033
- Table 8: Canada Ice Cream Alternative Revenue (million) Forecast, by Application 2020 & 2033
- Table 9: Mexico Ice Cream Alternative Revenue (million) Forecast, by Application 2020 & 2033
- Table 10: Global Ice Cream Alternative Revenue million Forecast, by Application 2020 & 2033
- Table 11: Global Ice Cream Alternative Revenue million Forecast, by Types 2020 & 2033
- Table 12: Global Ice Cream Alternative Revenue million Forecast, by Country 2020 & 2033
- Table 13: Brazil Ice Cream Alternative Revenue (million) Forecast, by Application 2020 & 2033
- Table 14: Argentina Ice Cream Alternative Revenue (million) Forecast, by Application 2020 & 2033
- Table 15: Rest of South America Ice Cream Alternative Revenue (million) Forecast, by Application 2020 & 2033
- Table 16: Global Ice Cream Alternative Revenue million Forecast, by Application 2020 & 2033
- Table 17: Global Ice Cream Alternative Revenue million Forecast, by Types 2020 & 2033
- Table 18: Global Ice Cream Alternative Revenue million Forecast, by Country 2020 & 2033
- Table 19: United Kingdom Ice Cream Alternative Revenue (million) Forecast, by Application 2020 & 2033
- Table 20: Germany Ice Cream Alternative Revenue (million) Forecast, by Application 2020 & 2033
- Table 21: France Ice Cream Alternative Revenue (million) Forecast, by Application 2020 & 2033
- Table 22: Italy Ice Cream Alternative Revenue (million) Forecast, by Application 2020 & 2033
- Table 23: Spain Ice Cream Alternative Revenue (million) Forecast, by Application 2020 & 2033
- Table 24: Russia Ice Cream Alternative Revenue (million) Forecast, by Application 2020 & 2033
- Table 25: Benelux Ice Cream Alternative Revenue (million) Forecast, by Application 2020 & 2033
- Table 26: Nordics Ice Cream Alternative Revenue (million) Forecast, by Application 2020 & 2033
- Table 27: Rest of Europe Ice Cream Alternative Revenue (million) Forecast, by Application 2020 & 2033
- Table 28: Global Ice Cream Alternative Revenue million Forecast, by Application 2020 & 2033
- Table 29: Global Ice Cream Alternative Revenue million Forecast, by Types 2020 & 2033
- Table 30: Global Ice Cream Alternative Revenue million Forecast, by Country 2020 & 2033
- Table 31: Turkey Ice Cream Alternative Revenue (million) Forecast, by Application 2020 & 2033
- Table 32: Israel Ice Cream Alternative Revenue (million) Forecast, by Application 2020 & 2033
- Table 33: GCC Ice Cream Alternative Revenue (million) Forecast, by Application 2020 & 2033
- Table 34: North Africa Ice Cream Alternative Revenue (million) Forecast, by Application 2020 & 2033
- Table 35: South Africa Ice Cream Alternative Revenue (million) Forecast, by Application 2020 & 2033
- Table 36: Rest of Middle East & Africa Ice Cream Alternative Revenue (million) Forecast, by Application 2020 & 2033
- Table 37: Global Ice Cream Alternative Revenue million Forecast, by Application 2020 & 2033
- Table 38: Global Ice Cream Alternative Revenue million Forecast, by Types 2020 & 2033
- Table 39: Global Ice Cream Alternative Revenue million Forecast, by Country 2020 & 2033
- Table 40: China Ice Cream Alternative Revenue (million) Forecast, by Application 2020 & 2033
- Table 41: India Ice Cream Alternative Revenue (million) Forecast, by Application 2020 & 2033
- Table 42: Japan Ice Cream Alternative Revenue (million) Forecast, by Application 2020 & 2033
- Table 43: South Korea Ice Cream Alternative Revenue (million) Forecast, by Application 2020 & 2033
- Table 44: ASEAN Ice Cream Alternative Revenue (million) Forecast, by Application 2020 & 2033
- Table 45: Oceania Ice Cream Alternative Revenue (million) Forecast, by Application 2020 & 2033
- Table 46: Rest of Asia Pacific Ice Cream Alternative Revenue (million) Forecast, by Application 2020 & 2033
Frequently Asked Questions
1. What is the projected Compound Annual Growth Rate (CAGR) of the Ice Cream Alternative?
The projected CAGR is approximately 10.4%.
2. Which companies are prominent players in the Ice Cream Alternative?
Key companies in the market include Danone, Naturli’ Foods, Halo Top, Enlightened, Breyers Delights, Arctic Zero, Ben & Jerry's, NadaMoo, So Delicious Dairy Free, Yasso.
3. What are the main segments of the Ice Cream Alternative?
The market segments include Application, Types.
4. Can you provide details about the market size?
The market size is estimated to be USD 1033 million as of 2022.
5. What are some drivers contributing to market growth?
N/A
6. What are the notable trends driving market growth?
N/A
7. Are there any restraints impacting market growth?
N/A
8. Can you provide examples of recent developments in the market?
N/A
9. What pricing options are available for accessing the report?
Pricing options include single-user, multi-user, and enterprise licenses priced at USD 4900.00, USD 7350.00, and USD 9800.00 respectively.
10. Is the market size provided in terms of value or volume?
The market size is provided in terms of value, measured in million.
11. Are there any specific market keywords associated with the report?
Yes, the market keyword associated with the report is "Ice Cream Alternative," which aids in identifying and referencing the specific market segment covered.
12. How do I determine which pricing option suits my needs best?
The pricing options vary based on user requirements and access needs. Individual users may opt for single-user licenses, while businesses requiring broader access may choose multi-user or enterprise licenses for cost-effective access to the report.
13. Are there any additional resources or data provided in the Ice Cream Alternative report?
While the report offers comprehensive insights, it's advisable to review the specific contents or supplementary materials provided to ascertain if additional resources or data are available.
14. How can I stay updated on further developments or reports in the Ice Cream Alternative?
To stay informed about further developments, trends, and reports in the Ice Cream Alternative, consider subscribing to industry newsletters, following relevant companies and organizations, or regularly checking reputable industry news sources and publications.
Methodology
Step 1 - Identification of Relevant Samples Size from Population Database


Step 2 - Approaches for Defining Global Market Size (Value, Volume* & Price*)

Note*: In applicable scenarios
Step 3 - Data Sources
Primary Research
- Web Analytics
- Survey Reports
- Research Institute
- Latest Research Reports
- Opinion Leaders
Secondary Research
- Annual Reports
- White Paper
- Latest Press Release
- Industry Association
- Paid Database
- Investor Presentations

Step 4 - Data Triangulation
Involves using different sources of information in order to increase the validity of a study
These sources are likely to be stakeholders in a program - participants, other researchers, program staff, other community members, and so on.
Then we put all data in single framework & apply various statistical tools to find out the dynamic on the market.
During the analysis stage, feedback from the stakeholder groups would be compared to determine areas of agreement as well as areas of divergence