

Key Insights
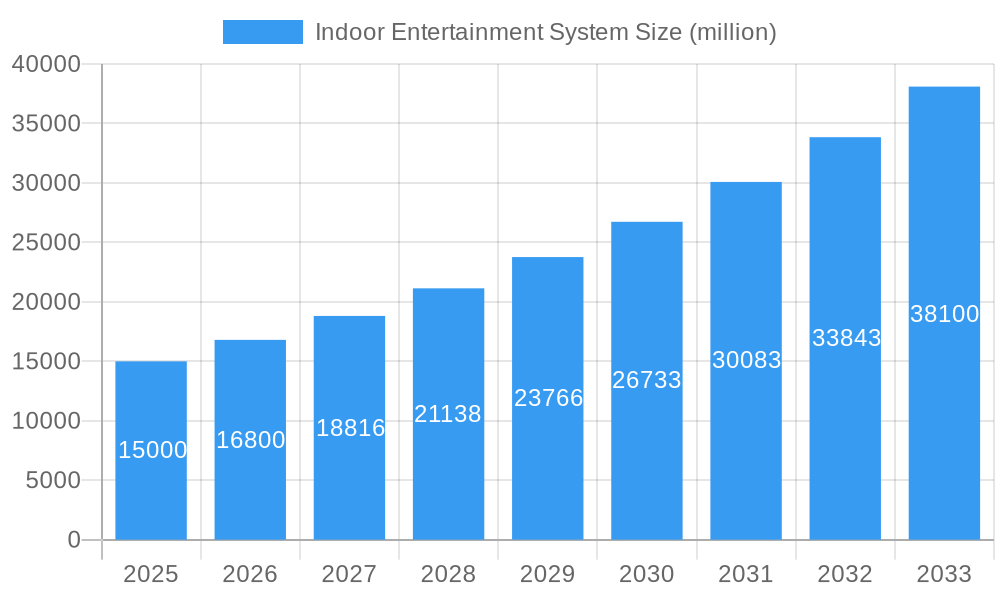
The global indoor entertainment system market is poised for substantial expansion, propelled by the surging demand for immersive experiences and continuous technological innovation. The market, valued at $39.97 billion in the base year of 2025, is projected to witness robust growth through 2033, with a compound annual growth rate (CAGR) of approximately 14%. Key growth drivers include the widespread adoption of smart home technology and the seamless integration of advanced entertainment solutions within these ecosystems. The increasing popularity of virtual reality (VR) and augmented reality (AR) technologies offers highly engaging and interactive entertainment options. Furthermore, ongoing enhancements in audio-visual quality deliver increasingly realistic and captivating experiences. Leading companies such as Sony, Samsung, and Bose are at the forefront of innovation, launching premium products and refining existing systems to meet evolving consumer expectations. The declining cost of components and the availability of high-speed internet are also enhancing accessibility to sophisticated indoor entertainment systems for a broader consumer base.
Indoor Entertainment System Market Size (In Billion)
Despite significant growth prospects, the market encounters certain challenges. The substantial initial investment required for premium systems may hinder widespread adoption, particularly in emerging economies. Additionally, concerns about potential health implications linked to extended VR/AR usage, including eye strain and motion sickness, could act as a limiting factor. Intensifying competition among established and new market entrants necessitates perpetual innovation and strategic differentiation to secure and expand market share. The market is segmented by product type, including home theaters, gaming consoles, and smart TVs; technology, such as VR and AR; and geographical regions. Currently, North America and Europe lead the market, attributed to higher disposable incomes and advanced technological infrastructure. Future market trajectory will hinge on effectively navigating these challenges and leveraging emerging trends, such as the integration of artificial intelligence (AI) for personalized user experiences and the development of more cost-effective and user-friendly products.
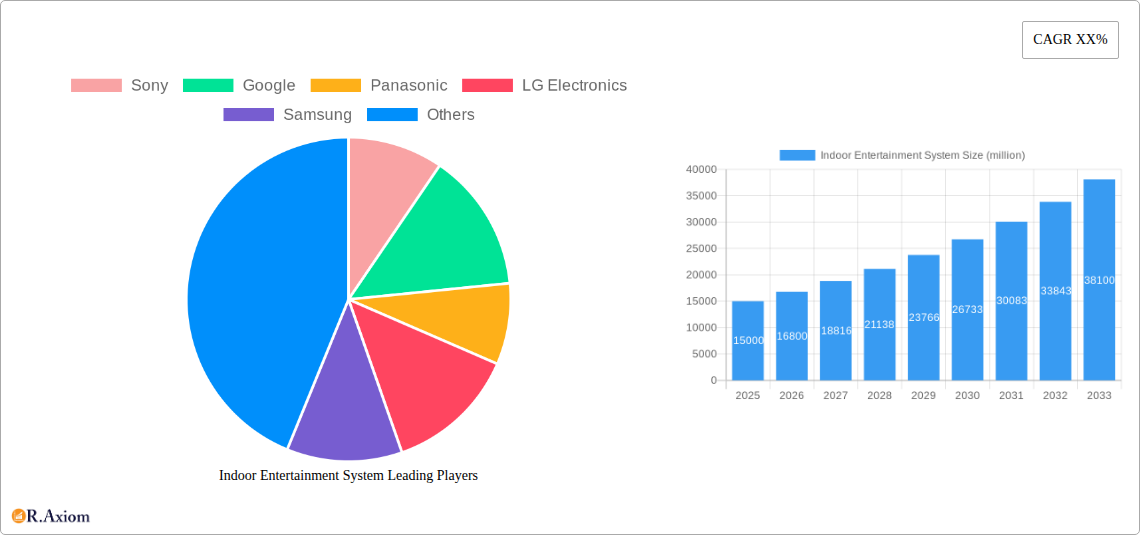
Indoor Entertainment System Company Market Share
Indoor Entertainment System Market Report: 2019-2033
This comprehensive report provides a detailed analysis of the Indoor Entertainment System market, encompassing market size, growth drivers, challenges, opportunities, and key players. The study period spans from 2019 to 2033, with a base year of 2025 and a forecast period from 2025 to 2033. The historical period covered is 2019-2024. This report is invaluable for industry stakeholders, investors, and businesses seeking to understand and capitalize on the growth potential within this dynamic sector. The total market value in 2025 is estimated at $XX million.
Indoor Entertainment System Market Concentration & Innovation
The Indoor Entertainment System market exhibits a moderately concentrated structure, with a few dominant players commanding significant market share. In 2025, the top five players—Sony, Samsung, LG Electronics, Panasonic, and Google—are estimated to collectively hold approximately 60% of the global market share. Smaller players like Bose, Klipsch, and Sennheiser Electronic contribute to the remaining share, focusing on niche segments or specific technologies. Innovation is a key driver, with continuous advancements in display technologies (e.g., OLED, MicroLED, 8K), audio systems (e.g., Dolby Atmos, immersive sound), and virtual/augmented reality (VR/AR) experiences. The regulatory landscape influences market dynamics, particularly concerning data privacy and security in connected devices. Product substitution primarily comes from the integration of functionalities (e.g., smart TVs replacing dedicated media players) and from the increasing popularity of streaming services. End-user trends reflect a growing preference for immersive and personalized entertainment experiences. M&A activity has been moderate, with a total deal value of approximately $xx million in the last five years, mainly focusing on smaller companies specializing in specific technologies.
- Market Share (2025):
- Sony: 15%
- Samsung: 15%
- LG Electronics: 12%
- Panasonic: 10%
- Google: 8%
- Others: 40%
- M&A Deal Value (2020-2024): ~$xx million
Indoor Entertainment System Industry Trends & Insights
The Indoor Entertainment System market is experiencing robust growth, driven by rising disposable incomes, increasing urbanization, and the proliferation of smart homes. The Compound Annual Growth Rate (CAGR) during the forecast period (2025-2033) is projected to be xx%. This growth is significantly influenced by the shift towards high-resolution displays, advanced audio technologies, and the integration of smart features. Technological disruptions, such as the increasing adoption of 8K displays and advanced VR/AR technologies, are reshaping consumer preferences. Consumers increasingly demand immersive, interactive, and personalized experiences, leading to the development of innovative entertainment solutions. Competitive dynamics are intense, with key players focusing on technological differentiation, strategic partnerships, and aggressive marketing strategies to capture market share. Market penetration of smart TVs and connected audio devices continues to grow, exceeding xx% in many developed markets. The increasing adoption of streaming services is also a critical growth factor.
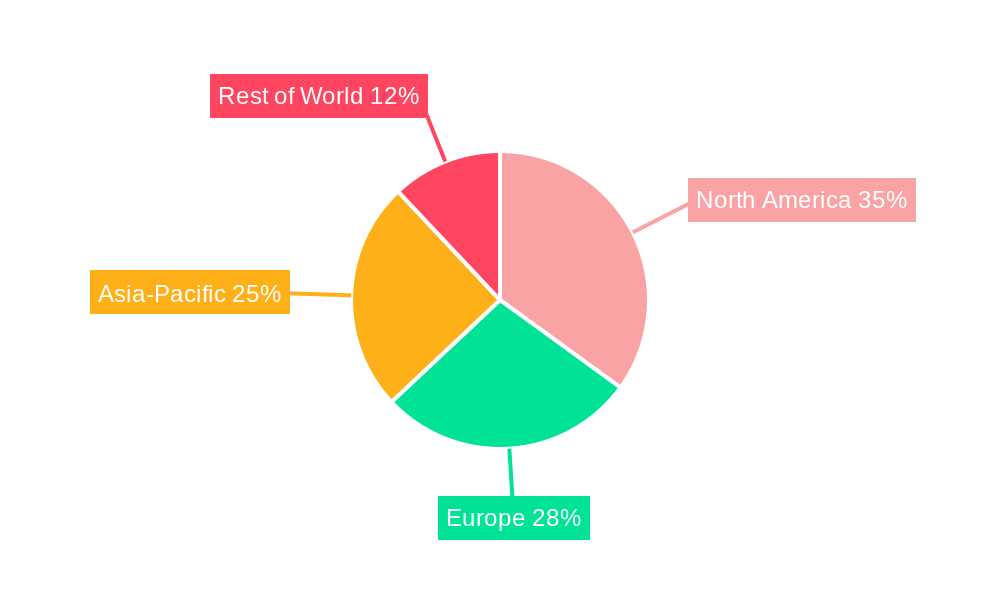
Dominant Markets & Segments in Indoor Entertainment System
North America currently dominates the Indoor Entertainment System market, driven by high consumer spending, strong technological infrastructure, and early adoption of advanced technologies. Within North America, the United States holds the largest market share.
- Key Drivers in North America:
- High disposable incomes
- Strong technological infrastructure
- Early adoption of advanced technologies
- Robust home entertainment culture
- Established distribution networks
The dominance of North America is primarily attributed to the high level of technological advancement, consumer spending power, and well-established entertainment culture. European markets are showing strong growth, particularly in Western Europe, fueled by rising adoption rates of smart home technologies and increasing demand for high-quality audio-visual experiences. Asia-Pacific is also an important market, with significant growth potential driven by rapidly increasing disposable incomes and burgeoning middle class in countries like China and India. However, market penetration remains lower compared to North America and Europe due to variations in infrastructure development and purchasing power.
Indoor Entertainment System Product Developments
Recent product innovations are focused on enhancing user experience through improved resolution, immersive sound, and seamless integration with smart home ecosystems. Advancements in display technology, such as MicroLED and 8K, offer superior picture quality, while innovations in audio technologies, like Dolby Atmos and 3D surround sound, create more realistic and immersive audio experiences. The integration of voice assistants, AI-powered content recommendations, and enhanced user interfaces improves convenience and personalization. These technological trends align with the growing consumer preference for advanced features and seamless user experiences, driving market expansion.
Report Scope & Segmentation Analysis
This report segments the Indoor Entertainment System market by product type (smart TVs, home theater systems, gaming consoles, audio devices), technology (OLED, QLED, 8K, Dolby Atmos), distribution channel (online, offline), and geography (North America, Europe, Asia-Pacific, Rest of World). Each segment is analyzed based on historical data and future projections. For instance, the smart TV segment is expected to witness significant growth due to its high adoption rate and integrated functionalities. The home theater system segment is projected to maintain steady growth, driven by the demand for immersive audio-visual experiences. The geographic segments are assessed based on economic factors, technology adoption rates, and consumer preferences.
Key Drivers of Indoor Entertainment System Growth
Several factors are driving the growth of the Indoor Entertainment System market. Technological advancements such as higher resolution displays, improved audio technologies, and the integration of VR/AR technologies are key factors driving the market. Economic factors, such as rising disposable incomes and increased consumer spending on entertainment, are contributing to this growth. Government regulations promoting digitalization and smart technologies are also playing a significant role. For example, government initiatives to improve broadband infrastructure are enabling wider adoption of high-bandwidth content streaming services.
Challenges in the Indoor Entertainment System Sector
The Indoor Entertainment System market faces several challenges. The high cost of premium products such as 8K TVs and high-end audio systems limits market penetration, particularly in price-sensitive markets. Supply chain disruptions due to global events can impact the availability and pricing of components, affecting overall production costs. Intense competition from established and emerging players results in pricing pressures, reducing profit margins. Regulatory hurdles related to data privacy and cybersecurity concerns are increasing, adding to compliance costs for companies. The impact of these factors on market growth is estimated at xx million annually.
Emerging Opportunities in Indoor Entertainment System
Emerging trends such as the rising adoption of 5G networks, advancements in AI and machine learning, and increasing demand for personalized entertainment experiences create opportunities for growth. The integration of haptic feedback technologies and improved VR/AR functionalities promises to enhance the immersion and enjoyment of indoor entertainment. The expansion into new markets such as developing economies with growing middle-class populations presents significant potential. New business models such as subscription services for content and software updates can generate additional revenue streams. These opportunities can significantly influence market dynamics in the coming years.
Leading Players in the Indoor Entertainment System Market
- Sony
- Panasonic
- LG Electronics
- Samsung
- Microsoft
- Siemens
- Mitsubishi Electric
- NXP Semiconductors
- NetSpeed Systems
- Jinpeng
- Sonodyne
- Klipsch
- Bose
- HTC
- Neusoft
- Oculus
- Sennheiser Electronic
- Vive
- Avegant
- Razer
- Zeiss
- VisusVR
- FOVE
Key Developments in Indoor Entertainment System Industry
- 2022 Q4: Samsung launched its new Neo QLED 8K TV with enhanced features.
- 2023 Q1: Sony partnered with Dolby to integrate advanced audio technologies in its new home theater systems.
- 2023 Q3: LG Electronics unveiled a new line of OLED TVs with improved brightness and contrast.
- 2024 Q2: Google announced the integration of enhanced AI features in its smart home ecosystem for improved user experience.
- 2024 Q4: Microsoft partnered with various hardware manufacturers to improve the gaming experience on its Xbox consoles. (Further details on specific partnerships and impact on the market are available in the full report.)
Strategic Outlook for Indoor Entertainment System Market
The Indoor Entertainment System market is poised for continued growth, driven by ongoing technological advancements, increasing demand for personalized experiences, and expansion into new markets. The convergence of technologies such as AI, VR/AR, and 5G will create new opportunities for innovation and market expansion. The focus on providing seamless integration with smart home ecosystems and enhanced user experiences will remain crucial for success in this competitive market. The continued development and adoption of advanced display and audio technologies will continue to fuel market growth. The market is expected to reach $XX million by 2033, representing significant growth potential for companies operating in this sector.
Indoor Entertainment System Segmentation
-
1. Application
- 1.1. Residential
- 1.2. Shopping Center
- 1.3. Other
-
2. Types
- 2.1. VR System
- 2.2. Audio Equipment
- 2.3. Video Devices
- 2.4. Gaming Consoles
Indoor Entertainment System Segmentation By Geography
-
1. North America
- 1.1. United States
- 1.2. Canada
- 1.3. Mexico
-
2. South America
- 2.1. Brazil
- 2.2. Argentina
- 2.3. Rest of South America
-
3. Europe
- 3.1. United Kingdom
- 3.2. Germany
- 3.3. France
- 3.4. Italy
- 3.5. Spain
- 3.6. Russia
- 3.7. Benelux
- 3.8. Nordics
- 3.9. Rest of Europe
-
4. Middle East & Africa
- 4.1. Turkey
- 4.2. Israel
- 4.3. GCC
- 4.4. North Africa
- 4.5. South Africa
- 4.6. Rest of Middle East & Africa
-
5. Asia Pacific
- 5.1. China
- 5.2. India
- 5.3. Japan
- 5.4. South Korea
- 5.5. ASEAN
- 5.6. Oceania
- 5.7. Rest of Asia Pacific
Indoor Entertainment System Regional Market Share
Geographic Coverage of Indoor Entertainment System
Indoor Entertainment System REPORT HIGHLIGHTS
| Aspects | Details |
|---|---|
| Study Period | 2020-2034 |
| Base Year | 2025 |
| Estimated Year | 2026 |
| Forecast Period | 2026-2034 |
| Historical Period | 2020-2025 |
| Growth Rate | CAGR of 14% from 2020-2034 |
| Segmentation |
|
Table of Contents
- 1. Introduction
- 1.1. Research Scope
- 1.2. Market Segmentation
- 1.3. Research Methodology
- 1.4. Definitions and Assumptions
- 2. Executive Summary
- 2.1. Introduction
- 3. Market Dynamics
- 3.1. Introduction
- 3.2. Market Drivers
- 3.3. Market Restrains
- 3.4. Market Trends
- 4. Market Factor Analysis
- 4.1. Porters Five Forces
- 4.2. Supply/Value Chain
- 4.3. PESTEL analysis
- 4.4. Market Entropy
- 4.5. Patent/Trademark Analysis
- 5. Global Indoor Entertainment System Analysis, Insights and Forecast, 2020-2032
- 5.1. Market Analysis, Insights and Forecast - by Application
- 5.1.1. Residential
- 5.1.2. Shopping Center
- 5.1.3. Other
- 5.2. Market Analysis, Insights and Forecast - by Types
- 5.2.1. VR System
- 5.2.2. Audio Equipment
- 5.2.3. Video Devices
- 5.2.4. Gaming Consoles
- 5.3. Market Analysis, Insights and Forecast - by Region
- 5.3.1. North America
- 5.3.2. South America
- 5.3.3. Europe
- 5.3.4. Middle East & Africa
- 5.3.5. Asia Pacific
- 5.1. Market Analysis, Insights and Forecast - by Application
- 6. North America Indoor Entertainment System Analysis, Insights and Forecast, 2020-2032
- 6.1. Market Analysis, Insights and Forecast - by Application
- 6.1.1. Residential
- 6.1.2. Shopping Center
- 6.1.3. Other
- 6.2. Market Analysis, Insights and Forecast - by Types
- 6.2.1. VR System
- 6.2.2. Audio Equipment
- 6.2.3. Video Devices
- 6.2.4. Gaming Consoles
- 6.1. Market Analysis, Insights and Forecast - by Application
- 7. South America Indoor Entertainment System Analysis, Insights and Forecast, 2020-2032
- 7.1. Market Analysis, Insights and Forecast - by Application
- 7.1.1. Residential
- 7.1.2. Shopping Center
- 7.1.3. Other
- 7.2. Market Analysis, Insights and Forecast - by Types
- 7.2.1. VR System
- 7.2.2. Audio Equipment
- 7.2.3. Video Devices
- 7.2.4. Gaming Consoles
- 7.1. Market Analysis, Insights and Forecast - by Application
- 8. Europe Indoor Entertainment System Analysis, Insights and Forecast, 2020-2032
- 8.1. Market Analysis, Insights and Forecast - by Application
- 8.1.1. Residential
- 8.1.2. Shopping Center
- 8.1.3. Other
- 8.2. Market Analysis, Insights and Forecast - by Types
- 8.2.1. VR System
- 8.2.2. Audio Equipment
- 8.2.3. Video Devices
- 8.2.4. Gaming Consoles
- 8.1. Market Analysis, Insights and Forecast - by Application
- 9. Middle East & Africa Indoor Entertainment System Analysis, Insights and Forecast, 2020-2032
- 9.1. Market Analysis, Insights and Forecast - by Application
- 9.1.1. Residential
- 9.1.2. Shopping Center
- 9.1.3. Other
- 9.2. Market Analysis, Insights and Forecast - by Types
- 9.2.1. VR System
- 9.2.2. Audio Equipment
- 9.2.3. Video Devices
- 9.2.4. Gaming Consoles
- 9.1. Market Analysis, Insights and Forecast - by Application
- 10. Asia Pacific Indoor Entertainment System Analysis, Insights and Forecast, 2020-2032
- 10.1. Market Analysis, Insights and Forecast - by Application
- 10.1.1. Residential
- 10.1.2. Shopping Center
- 10.1.3. Other
- 10.2. Market Analysis, Insights and Forecast - by Types
- 10.2.1. VR System
- 10.2.2. Audio Equipment
- 10.2.3. Video Devices
- 10.2.4. Gaming Consoles
- 10.1. Market Analysis, Insights and Forecast - by Application
- 11. Competitive Analysis
- 11.1. Global Market Share Analysis 2025
- 11.2. Company Profiles
- 11.2.1 Sony
- 11.2.1.1. Overview
- 11.2.1.2. Products
- 11.2.1.3. SWOT Analysis
- 11.2.1.4. Recent Developments
- 11.2.1.5. Financials (Based on Availability)
- 11.2.2 Google
- 11.2.2.1. Overview
- 11.2.2.2. Products
- 11.2.2.3. SWOT Analysis
- 11.2.2.4. Recent Developments
- 11.2.2.5. Financials (Based on Availability)
- 11.2.3 Panasonic
- 11.2.3.1. Overview
- 11.2.3.2. Products
- 11.2.3.3. SWOT Analysis
- 11.2.3.4. Recent Developments
- 11.2.3.5. Financials (Based on Availability)
- 11.2.4 LG Electronics
- 11.2.4.1. Overview
- 11.2.4.2. Products
- 11.2.4.3. SWOT Analysis
- 11.2.4.4. Recent Developments
- 11.2.4.5. Financials (Based on Availability)
- 11.2.5 Samsung
- 11.2.5.1. Overview
- 11.2.5.2. Products
- 11.2.5.3. SWOT Analysis
- 11.2.5.4. Recent Developments
- 11.2.5.5. Financials (Based on Availability)
- 11.2.6 Microsoft
- 11.2.6.1. Overview
- 11.2.6.2. Products
- 11.2.6.3. SWOT Analysis
- 11.2.6.4. Recent Developments
- 11.2.6.5. Financials (Based on Availability)
- 11.2.7 Siemens
- 11.2.7.1. Overview
- 11.2.7.2. Products
- 11.2.7.3. SWOT Analysis
- 11.2.7.4. Recent Developments
- 11.2.7.5. Financials (Based on Availability)
- 11.2.8 Mitsubishi Electric
- 11.2.8.1. Overview
- 11.2.8.2. Products
- 11.2.8.3. SWOT Analysis
- 11.2.8.4. Recent Developments
- 11.2.8.5. Financials (Based on Availability)
- 11.2.9 NXP Semiconductors
- 11.2.9.1. Overview
- 11.2.9.2. Products
- 11.2.9.3. SWOT Analysis
- 11.2.9.4. Recent Developments
- 11.2.9.5. Financials (Based on Availability)
- 11.2.10 NetSpeed Systems
- 11.2.10.1. Overview
- 11.2.10.2. Products
- 11.2.10.3. SWOT Analysis
- 11.2.10.4. Recent Developments
- 11.2.10.5. Financials (Based on Availability)
- 11.2.11 Jinpeng
- 11.2.11.1. Overview
- 11.2.11.2. Products
- 11.2.11.3. SWOT Analysis
- 11.2.11.4. Recent Developments
- 11.2.11.5. Financials (Based on Availability)
- 11.2.12 Sonodyne
- 11.2.12.1. Overview
- 11.2.12.2. Products
- 11.2.12.3. SWOT Analysis
- 11.2.12.4. Recent Developments
- 11.2.12.5. Financials (Based on Availability)
- 11.2.13 Klipsch
- 11.2.13.1. Overview
- 11.2.13.2. Products
- 11.2.13.3. SWOT Analysis
- 11.2.13.4. Recent Developments
- 11.2.13.5. Financials (Based on Availability)
- 11.2.14 Bose
- 11.2.14.1. Overview
- 11.2.14.2. Products
- 11.2.14.3. SWOT Analysis
- 11.2.14.4. Recent Developments
- 11.2.14.5. Financials (Based on Availability)
- 11.2.15 HTC
- 11.2.15.1. Overview
- 11.2.15.2. Products
- 11.2.15.3. SWOT Analysis
- 11.2.15.4. Recent Developments
- 11.2.15.5. Financials (Based on Availability)
- 11.2.16 Neusoft
- 11.2.16.1. Overview
- 11.2.16.2. Products
- 11.2.16.3. SWOT Analysis
- 11.2.16.4. Recent Developments
- 11.2.16.5. Financials (Based on Availability)
- 11.2.17 Oculus
- 11.2.17.1. Overview
- 11.2.17.2. Products
- 11.2.17.3. SWOT Analysis
- 11.2.17.4. Recent Developments
- 11.2.17.5. Financials (Based on Availability)
- 11.2.18 Sennheiser Electronic
- 11.2.18.1. Overview
- 11.2.18.2. Products
- 11.2.18.3. SWOT Analysis
- 11.2.18.4. Recent Developments
- 11.2.18.5. Financials (Based on Availability)
- 11.2.19 Vive
- 11.2.19.1. Overview
- 11.2.19.2. Products
- 11.2.19.3. SWOT Analysis
- 11.2.19.4. Recent Developments
- 11.2.19.5. Financials (Based on Availability)
- 11.2.20 Avegant
- 11.2.20.1. Overview
- 11.2.20.2. Products
- 11.2.20.3. SWOT Analysis
- 11.2.20.4. Recent Developments
- 11.2.20.5. Financials (Based on Availability)
- 11.2.21 Razer
- 11.2.21.1. Overview
- 11.2.21.2. Products
- 11.2.21.3. SWOT Analysis
- 11.2.21.4. Recent Developments
- 11.2.21.5. Financials (Based on Availability)
- 11.2.22 Zeiss
- 11.2.22.1. Overview
- 11.2.22.2. Products
- 11.2.22.3. SWOT Analysis
- 11.2.22.4. Recent Developments
- 11.2.22.5. Financials (Based on Availability)
- 11.2.23 VisusVR
- 11.2.23.1. Overview
- 11.2.23.2. Products
- 11.2.23.3. SWOT Analysis
- 11.2.23.4. Recent Developments
- 11.2.23.5. Financials (Based on Availability)
- 11.2.24 FOVE
- 11.2.24.1. Overview
- 11.2.24.2. Products
- 11.2.24.3. SWOT Analysis
- 11.2.24.4. Recent Developments
- 11.2.24.5. Financials (Based on Availability)
- 11.2.1 Sony
List of Figures
- Figure 1: Global Indoor Entertainment System Revenue Breakdown (billion, %) by Region 2025 & 2033
- Figure 2: North America Indoor Entertainment System Revenue (billion), by Application 2025 & 2033
- Figure 3: North America Indoor Entertainment System Revenue Share (%), by Application 2025 & 2033
- Figure 4: North America Indoor Entertainment System Revenue (billion), by Types 2025 & 2033
- Figure 5: North America Indoor Entertainment System Revenue Share (%), by Types 2025 & 2033
- Figure 6: North America Indoor Entertainment System Revenue (billion), by Country 2025 & 2033
- Figure 7: North America Indoor Entertainment System Revenue Share (%), by Country 2025 & 2033
- Figure 8: South America Indoor Entertainment System Revenue (billion), by Application 2025 & 2033
- Figure 9: South America Indoor Entertainment System Revenue Share (%), by Application 2025 & 2033
- Figure 10: South America Indoor Entertainment System Revenue (billion), by Types 2025 & 2033
- Figure 11: South America Indoor Entertainment System Revenue Share (%), by Types 2025 & 2033
- Figure 12: South America Indoor Entertainment System Revenue (billion), by Country 2025 & 2033
- Figure 13: South America Indoor Entertainment System Revenue Share (%), by Country 2025 & 2033
- Figure 14: Europe Indoor Entertainment System Revenue (billion), by Application 2025 & 2033
- Figure 15: Europe Indoor Entertainment System Revenue Share (%), by Application 2025 & 2033
- Figure 16: Europe Indoor Entertainment System Revenue (billion), by Types 2025 & 2033
- Figure 17: Europe Indoor Entertainment System Revenue Share (%), by Types 2025 & 2033
- Figure 18: Europe Indoor Entertainment System Revenue (billion), by Country 2025 & 2033
- Figure 19: Europe Indoor Entertainment System Revenue Share (%), by Country 2025 & 2033
- Figure 20: Middle East & Africa Indoor Entertainment System Revenue (billion), by Application 2025 & 2033
- Figure 21: Middle East & Africa Indoor Entertainment System Revenue Share (%), by Application 2025 & 2033
- Figure 22: Middle East & Africa Indoor Entertainment System Revenue (billion), by Types 2025 & 2033
- Figure 23: Middle East & Africa Indoor Entertainment System Revenue Share (%), by Types 2025 & 2033
- Figure 24: Middle East & Africa Indoor Entertainment System Revenue (billion), by Country 2025 & 2033
- Figure 25: Middle East & Africa Indoor Entertainment System Revenue Share (%), by Country 2025 & 2033
- Figure 26: Asia Pacific Indoor Entertainment System Revenue (billion), by Application 2025 & 2033
- Figure 27: Asia Pacific Indoor Entertainment System Revenue Share (%), by Application 2025 & 2033
- Figure 28: Asia Pacific Indoor Entertainment System Revenue (billion), by Types 2025 & 2033
- Figure 29: Asia Pacific Indoor Entertainment System Revenue Share (%), by Types 2025 & 2033
- Figure 30: Asia Pacific Indoor Entertainment System Revenue (billion), by Country 2025 & 2033
- Figure 31: Asia Pacific Indoor Entertainment System Revenue Share (%), by Country 2025 & 2033
List of Tables
- Table 1: Global Indoor Entertainment System Revenue billion Forecast, by Application 2020 & 2033
- Table 2: Global Indoor Entertainment System Revenue billion Forecast, by Types 2020 & 2033
- Table 3: Global Indoor Entertainment System Revenue billion Forecast, by Region 2020 & 2033
- Table 4: Global Indoor Entertainment System Revenue billion Forecast, by Application 2020 & 2033
- Table 5: Global Indoor Entertainment System Revenue billion Forecast, by Types 2020 & 2033
- Table 6: Global Indoor Entertainment System Revenue billion Forecast, by Country 2020 & 2033
- Table 7: United States Indoor Entertainment System Revenue (billion) Forecast, by Application 2020 & 2033
- Table 8: Canada Indoor Entertainment System Revenue (billion) Forecast, by Application 2020 & 2033
- Table 9: Mexico Indoor Entertainment System Revenue (billion) Forecast, by Application 2020 & 2033
- Table 10: Global Indoor Entertainment System Revenue billion Forecast, by Application 2020 & 2033
- Table 11: Global Indoor Entertainment System Revenue billion Forecast, by Types 2020 & 2033
- Table 12: Global Indoor Entertainment System Revenue billion Forecast, by Country 2020 & 2033
- Table 13: Brazil Indoor Entertainment System Revenue (billion) Forecast, by Application 2020 & 2033
- Table 14: Argentina Indoor Entertainment System Revenue (billion) Forecast, by Application 2020 & 2033
- Table 15: Rest of South America Indoor Entertainment System Revenue (billion) Forecast, by Application 2020 & 2033
- Table 16: Global Indoor Entertainment System Revenue billion Forecast, by Application 2020 & 2033
- Table 17: Global Indoor Entertainment System Revenue billion Forecast, by Types 2020 & 2033
- Table 18: Global Indoor Entertainment System Revenue billion Forecast, by Country 2020 & 2033
- Table 19: United Kingdom Indoor Entertainment System Revenue (billion) Forecast, by Application 2020 & 2033
- Table 20: Germany Indoor Entertainment System Revenue (billion) Forecast, by Application 2020 & 2033
- Table 21: France Indoor Entertainment System Revenue (billion) Forecast, by Application 2020 & 2033
- Table 22: Italy Indoor Entertainment System Revenue (billion) Forecast, by Application 2020 & 2033
- Table 23: Spain Indoor Entertainment System Revenue (billion) Forecast, by Application 2020 & 2033
- Table 24: Russia Indoor Entertainment System Revenue (billion) Forecast, by Application 2020 & 2033
- Table 25: Benelux Indoor Entertainment System Revenue (billion) Forecast, by Application 2020 & 2033
- Table 26: Nordics Indoor Entertainment System Revenue (billion) Forecast, by Application 2020 & 2033
- Table 27: Rest of Europe Indoor Entertainment System Revenue (billion) Forecast, by Application 2020 & 2033
- Table 28: Global Indoor Entertainment System Revenue billion Forecast, by Application 2020 & 2033
- Table 29: Global Indoor Entertainment System Revenue billion Forecast, by Types 2020 & 2033
- Table 30: Global Indoor Entertainment System Revenue billion Forecast, by Country 2020 & 2033
- Table 31: Turkey Indoor Entertainment System Revenue (billion) Forecast, by Application 2020 & 2033
- Table 32: Israel Indoor Entertainment System Revenue (billion) Forecast, by Application 2020 & 2033
- Table 33: GCC Indoor Entertainment System Revenue (billion) Forecast, by Application 2020 & 2033
- Table 34: North Africa Indoor Entertainment System Revenue (billion) Forecast, by Application 2020 & 2033
- Table 35: South Africa Indoor Entertainment System Revenue (billion) Forecast, by Application 2020 & 2033
- Table 36: Rest of Middle East & Africa Indoor Entertainment System Revenue (billion) Forecast, by Application 2020 & 2033
- Table 37: Global Indoor Entertainment System Revenue billion Forecast, by Application 2020 & 2033
- Table 38: Global Indoor Entertainment System Revenue billion Forecast, by Types 2020 & 2033
- Table 39: Global Indoor Entertainment System Revenue billion Forecast, by Country 2020 & 2033
- Table 40: China Indoor Entertainment System Revenue (billion) Forecast, by Application 2020 & 2033
- Table 41: India Indoor Entertainment System Revenue (billion) Forecast, by Application 2020 & 2033
- Table 42: Japan Indoor Entertainment System Revenue (billion) Forecast, by Application 2020 & 2033
- Table 43: South Korea Indoor Entertainment System Revenue (billion) Forecast, by Application 2020 & 2033
- Table 44: ASEAN Indoor Entertainment System Revenue (billion) Forecast, by Application 2020 & 2033
- Table 45: Oceania Indoor Entertainment System Revenue (billion) Forecast, by Application 2020 & 2033
- Table 46: Rest of Asia Pacific Indoor Entertainment System Revenue (billion) Forecast, by Application 2020 & 2033
Frequently Asked Questions
1. What is the projected Compound Annual Growth Rate (CAGR) of the Indoor Entertainment System?
The projected CAGR is approximately 14%.
2. Which companies are prominent players in the Indoor Entertainment System?
Key companies in the market include Sony, Google, Panasonic, LG Electronics, Samsung, Microsoft, Siemens, Mitsubishi Electric, NXP Semiconductors, NetSpeed Systems, Jinpeng, Sonodyne, Klipsch, Bose, HTC, Neusoft, Oculus, Sennheiser Electronic, Vive, Avegant, Razer, Zeiss, VisusVR, FOVE.
3. What are the main segments of the Indoor Entertainment System?
The market segments include Application, Types.
4. Can you provide details about the market size?
The market size is estimated to be USD 39.97 billion as of 2022.
5. What are some drivers contributing to market growth?
N/A
6. What are the notable trends driving market growth?
N/A
7. Are there any restraints impacting market growth?
N/A
8. Can you provide examples of recent developments in the market?
N/A
9. What pricing options are available for accessing the report?
Pricing options include single-user, multi-user, and enterprise licenses priced at USD 4350.00, USD 6525.00, and USD 8700.00 respectively.
10. Is the market size provided in terms of value or volume?
The market size is provided in terms of value, measured in billion.
11. Are there any specific market keywords associated with the report?
Yes, the market keyword associated with the report is "Indoor Entertainment System," which aids in identifying and referencing the specific market segment covered.
12. How do I determine which pricing option suits my needs best?
The pricing options vary based on user requirements and access needs. Individual users may opt for single-user licenses, while businesses requiring broader access may choose multi-user or enterprise licenses for cost-effective access to the report.
13. Are there any additional resources or data provided in the Indoor Entertainment System report?
While the report offers comprehensive insights, it's advisable to review the specific contents or supplementary materials provided to ascertain if additional resources or data are available.
14. How can I stay updated on further developments or reports in the Indoor Entertainment System?
To stay informed about further developments, trends, and reports in the Indoor Entertainment System, consider subscribing to industry newsletters, following relevant companies and organizations, or regularly checking reputable industry news sources and publications.
Methodology
Step 1 - Identification of Relevant Samples Size from Population Database


Step 2 - Approaches for Defining Global Market Size (Value, Volume* & Price*)

Note*: In applicable scenarios
Step 3 - Data Sources
Primary Research
- Web Analytics
- Survey Reports
- Research Institute
- Latest Research Reports
- Opinion Leaders
Secondary Research
- Annual Reports
- White Paper
- Latest Press Release
- Industry Association
- Paid Database
- Investor Presentations

Step 4 - Data Triangulation
Involves using different sources of information in order to increase the validity of a study
These sources are likely to be stakeholders in a program - participants, other researchers, program staff, other community members, and so on.
Then we put all data in single framework & apply various statistical tools to find out the dynamic on the market.
During the analysis stage, feedback from the stakeholder groups would be compared to determine areas of agreement as well as areas of divergence