

Key Insights
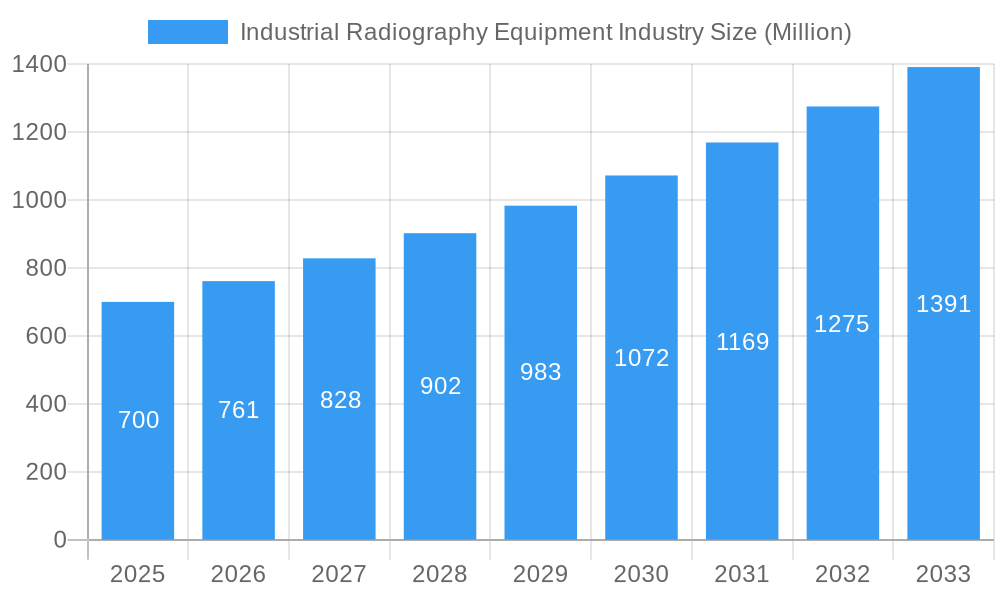
The Industrial Radiography Equipment market is projected for significant growth, estimated at $1.35 billion by 2025, with a projected Compound Annual Growth Rate (CAGR) of 8.6% from 2025 to 2033. This expansion is driven by the escalating demand for non-destructive testing (NDT) across key sectors such as aerospace, defense, energy, and manufacturing. Stringent quality control mandates and the imperative for ensuring the structural integrity of critical components are accelerating the adoption of industrial radiography solutions. Technological advancements, particularly in Direct Radiography (DR) and Computed Tomography (CT), are enhancing image resolution, reducing inspection times, and boosting operational efficiency. The increasing integration of automation and remote inspection technologies further contributes to market development, offering superior accuracy and data analysis capabilities that attract investment.
Industrial Radiography Equipment Industry Market Size (In Billion)
While high initial investment and the requirement for skilled personnel may present some challenges, the market's upward trajectory is set to continue, fueled by ongoing innovation and a heightened emphasis on safety and quality standards. DR and CT systems are increasingly supplanting traditional film radiography due to their speed, cost-effectiveness, and improved image fidelity. Emerging economies, especially within the Asia-Pacific and Middle East & Africa regions, are anticipated to be key growth drivers, supported by expanding infrastructure and industrial development. The market's segmentation by technology (Film Radiography, Computed Radiography, Direct Radiography, Computed Tomography) and end-user industry (Aerospace & Defense, Petrochemical & Gas, Energy & Power, Construction, Automotive & Transportation, Manufacturing) offers a granular perspective on market dynamics and emerging opportunities. Intense competition among leading manufacturers is spurring further innovation.
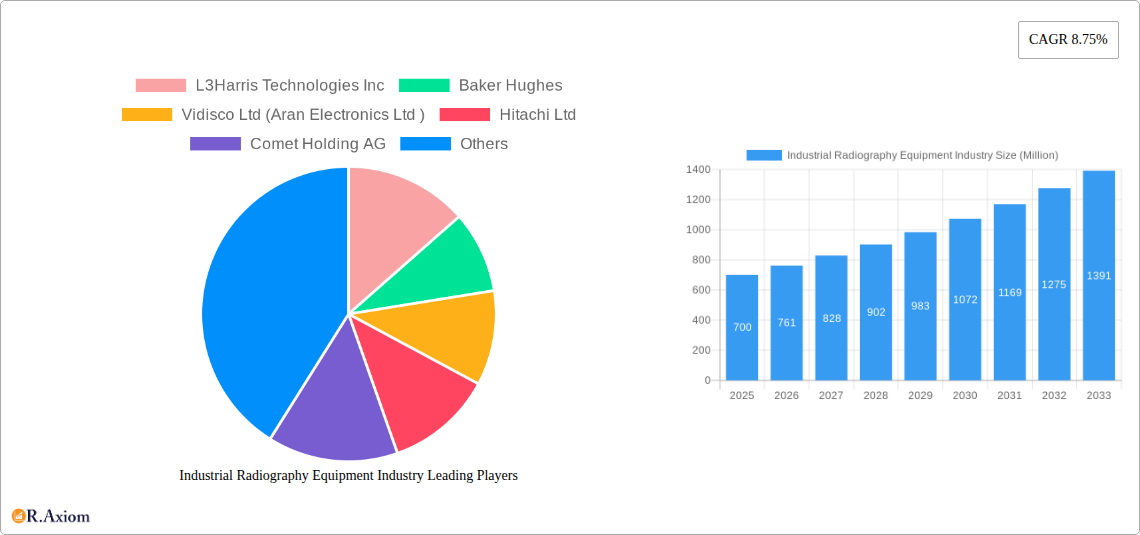
Industrial Radiography Equipment Industry Company Market Share
Industrial Radiography Equipment Market Analysis: 2019-2033
This comprehensive report offers an in-depth analysis of the Industrial Radiography Equipment market, providing critical insights for stakeholders, investors, and researchers. Covering the 2019-2033 period with a focus on 2025, the report meticulously examines market drivers, competitive landscapes, technological trends, and future growth prospects. The market is segmented by technology and end-user industry, delivering granular data and actionable intelligence. The total market size is anticipated to reach $1.35 billion by 2025, with a projected CAGR of 8.6% during the forecast period (2025-2033).
Industrial Radiography Equipment Industry Market Concentration & Innovation
The Industrial Radiography Equipment market exhibits a moderately concentrated landscape, with several key players holding significant market share. While precise figures for market share are proprietary to the full report, leading companies such as L3Harris Technologies Inc, Baker Hughes, and Fujifilm Corporation command substantial portions of the market. The industry is characterized by ongoing innovation driven by the need for enhanced image quality, improved efficiency, and reduced operational costs. Regulatory frameworks, particularly concerning radiation safety and environmental compliance, significantly influence market dynamics. Product substitutes, while limited, include other non-destructive testing (NDT) methods like ultrasonic testing and magnetic particle inspection, posing a subtle competitive pressure. End-user trends towards automation and digitalization are driving demand for advanced radiography systems. M&A activity in the sector has been moderate in recent years, with deal values averaging around xx Million annually, mostly focused on enhancing technological capabilities and expanding market reach.
- Key Players: L3Harris Technologies Inc, Baker Hughes, Fujifilm Corporation, and others.
- Innovation Drivers: Improved image quality, higher efficiency, reduced costs, automation, and digitalization.
- Regulatory Influence: Stringent safety and environmental regulations impacting market operations.
- M&A Activity: Moderate activity, with deal values averaging xx Million annually.
Industrial Radiography Equipment Industry Industry Trends & Insights
The Industrial Radiography Equipment market is experiencing robust growth, fueled by increasing demand across diverse end-user industries. The rising adoption of advanced technologies such as Computed Tomography (CT) and Direct Radiography (DR) is a key growth driver, offering superior image quality and faster inspection times compared to traditional Film Radiography. The market penetration of DR systems is expected to reach xx% by 2033, surpassing Computed Radiography (CR) as the dominant technology segment. The Aerospace & Defense and Energy & Power sectors are significant contributors to market growth, driven by stringent quality control requirements and the need for thorough inspection of critical components. The automotive sector is also witnessing increasing adoption, propelled by advancements in lightweight materials and complex manufacturing processes. The competitive landscape is characterized by intense rivalry among established players and emerging technology providers, leading to continuous innovation and price competition. The overall market is expected to register a CAGR of xx% during the forecast period.
Dominant Markets & Segments in Industrial Radiography Equipment Industry
The Industrial Radiography Equipment market shows strong regional dominance, with North America and Europe leading the way in terms of market size and adoption rate. Within these regions, the United States and Germany respectively represent significant national markets, driven by established industrial bases and robust regulatory frameworks. However, Asia-Pacific is projected to witness the fastest growth, fueled by rising industrialization, infrastructure development, and increasing investment in advanced manufacturing technologies.
Leading Segments:
- By Technology: Computed Tomography (CT) is predicted to witness the fastest growth due to its superior imaging capabilities.
- By End-User: Aerospace & Defense and Energy & Power are the largest segments due to high quality standards and extensive application requirements.
Key Drivers:
- North America & Europe: Strong industrial base, high technological adoption, stringent regulations.
- Asia-Pacific: Rapid industrialization, infrastructure development, increasing investments in manufacturing.
Industrial Radiography Equipment Industry Product Developments
Recent product innovations highlight a clear trend towards digitalization, automation, and enhanced image processing capabilities. Manufacturers are introducing systems with improved resolution, faster scan times, and user-friendly interfaces. These advancements are improving efficiency, reducing operational costs, and enabling more accurate and reliable inspections. The market is seeing a rise in compact and portable systems, catering to diverse on-site inspection needs. The competitive advantage lies in offering superior image quality, advanced software features, and robust customer support services.
Report Scope & Segmentation Analysis
This report encompasses a detailed segmentation analysis of the Industrial Radiography Equipment market by technology and end-user industry. Each segment includes comprehensive growth projections, market size estimates, and competitive dynamics.
By Technology: Film Radiography, Computed Radiography, Direct Radiography, and Computed Tomography. Each technology segment's market size is projected based on installed base and future sales, considering the technological shift from film to digital systems.
By End-User Industry: Aerospace and Defense, Petrochemical and Gas, Energy and Power, Construction, Automotive and Transportation, Manufacturing, and Other End-User Industries. Each end-user segment’s analysis includes market size, growth drivers, specific application requirements, and competitive analysis.
Key Drivers of Industrial Radiography Equipment Industry Growth
Several factors are driving growth in this market. Firstly, stringent quality control regulations across various industries are mandating non-destructive testing (NDT) methods, including radiography. Secondly, the increasing complexity of manufactured products necessitates advanced inspection techniques to ensure safety and reliability. Technological advancements, specifically the development of digital radiography systems (DR and CT), offering faster processing, better image quality and improved efficiency, are also key drivers. Lastly, rising investments in infrastructure projects globally and increasing demand for industrial automation are increasing the demand for industrial radiography equipment.
Challenges in the Industrial Radiography Equipment Industry Sector
The industry faces challenges including the high initial investment cost of advanced equipment and the need for skilled personnel to operate and interpret radiographic images. Strict regulatory compliance related to radiation safety imposes operational costs and necessitates specialized training. Supply chain disruptions, especially in the procurement of critical components, can also affect production and delivery timelines. Furthermore, competition from other NDT techniques, such as ultrasonic and eddy current testing, presents a continual challenge.
Emerging Opportunities in Industrial Radiography Equipment Industry
The market presents several promising opportunities. The integration of artificial intelligence (AI) and machine learning (ML) into radiography systems offers potential for automated defect detection and analysis, improving efficiency and reducing human error. Growth in emerging economies, particularly in Asia-Pacific, presents significant untapped market potential. The development of portable and lightweight systems is creating new opportunities for on-site inspection in remote locations and challenging environments.
Leading Players in the Industrial Radiography Equipment Industry Market
- L3Harris Technologies Inc
- Baker Hughes
- Vidisco Ltd (Aran Electronics Ltd)
- Hitachi Ltd
- Comet Holding AG
- Canon Medical Systems Corporation (Canon Inc)
- Rigaku Corporation (Carlyle Group)
- North Star Imaging Inc
- Carestream Health
- Carl Zeiss AG
- Evident Corporation (Bain Capital)
- Hamamatsu Photonics K K
- Durr NDT GmbH & Co Kg
- Teledyne Dalsa Inc (Teledyne Technologies)
- Fujifilm Corporation (Fujifilm Holdings Corporation)
- Nikon Metrology NV (Nikon Corporation)
Key Developments in Industrial Radiography Equipment Industry Industry
July 2023: Canon Inc. launched the Zexirai9 digital X-ray RF system, a compact, multi-purpose fluoroscopic table with advanced image processing capabilities. This launch expands Canon's presence in the digital radiography market, enhancing its technological standing.
May 2023: Nikon Metrology introduced its next-generation VOXLS X-ray computed tomography (CT) inspection systems, designed for diverse industries including automotive and aerospace, potentially impacting market share through technological advancement and broadened applications.
Strategic Outlook for Industrial Radiography Equipment Industry Market
The Industrial Radiography Equipment market is poised for sustained growth, driven by technological innovations, expanding end-user applications, and increasing demand for enhanced quality control and safety across diverse sectors. The integration of AI and ML technologies will be pivotal in shaping future market dynamics, leading to higher efficiency and automation. The market will likely see a consolidation trend, with leading players focusing on strategic partnerships and acquisitions to strengthen their market positions and expand their product portfolios. Growth in emerging markets and the adoption of new inspection techniques will continue to drive market expansion.
Industrial Radiography Equipment Industry Segmentation
-
1. Technology
- 1.1. Film Radiography
- 1.2. Computed Radiography
- 1.3. Direct Radiography
- 1.4. Computed Tomography
-
2. End-User Industry
- 2.1. Aerospace and Defense
- 2.2. Petrochemical and Gas
- 2.3. Energy and Power
- 2.4. Construction
- 2.5. Automotive and Transportation
- 2.6. Manufacturing
- 2.7. Other End-User Industries
Industrial Radiography Equipment Industry Segmentation By Geography
- 1. North America
- 2. Europe
- 3. Asia
- 4. Australia and New Zealand
- 5. Latin America
- 6. Middle East and Africa
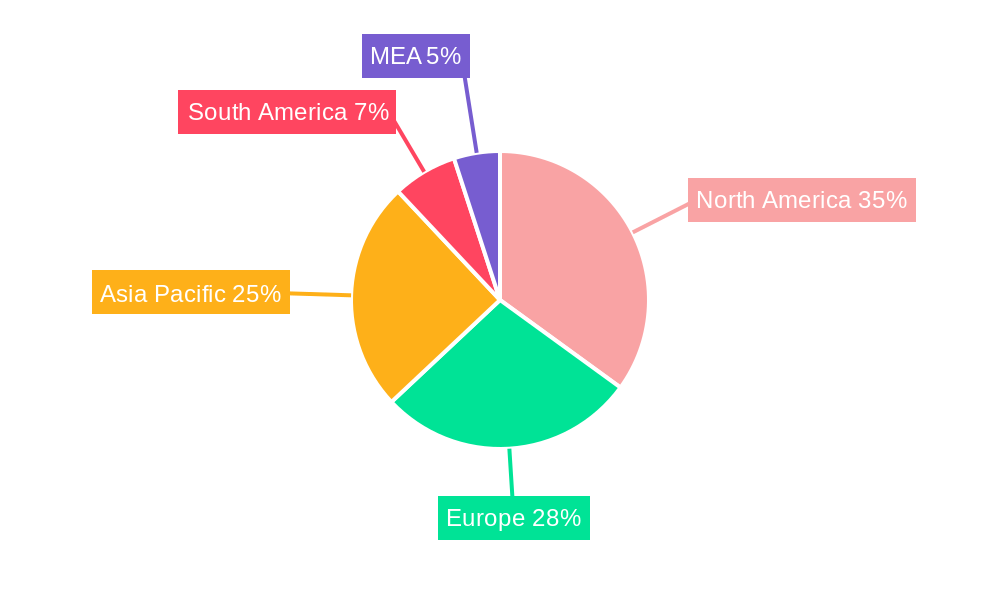
Industrial Radiography Equipment Industry Regional Market Share
Geographic Coverage of Industrial Radiography Equipment Industry
Industrial Radiography Equipment Industry REPORT HIGHLIGHTS
| Aspects | Details |
|---|---|
| Study Period | 2020-2034 |
| Base Year | 2025 |
| Estimated Year | 2026 |
| Forecast Period | 2026-2034 |
| Historical Period | 2020-2025 |
| Growth Rate | CAGR of 8.6% from 2020-2034 |
| Segmentation |
|
Table of Contents
- 1. Introduction
- 1.1. Research Scope
- 1.2. Market Segmentation
- 1.3. Research Objective
- 1.4. Definitions and Assumptions
- 2. Executive Summary
- 2.1. Market Snapshot
- 3. Market Dynamics
- 3.1. Market Drivers
- 3.2. Market Restrains
- 3.3. Market Trends
- 3.4. Market Opportunities
- 4. Market Factor Analysis
- 4.1. Porters Five Forces
- 4.1.1. Bargaining Power of Suppliers
- 4.1.2. Bargaining Power of Buyers
- 4.1.3. Threat of New Entrants
- 4.1.4. Threat of Substitutes
- 4.1.5. Competitive Rivalry
- 4.2. PESTEL analysis
- 4.3. BCG Analysis
- 4.3.1. Stars (High Growth, High Market Share)
- 4.3.2. Cash Cows (Low Growth, High Market Share)
- 4.3.3. Question Mark (High Growth, Low Market Share)
- 4.3.4. Dogs (Low Growth, Low Market Share)
- 4.4. Ansoff Matrix Analysis
- 4.5. Supply Chain Analysis
- 4.6. Regulatory Landscape
- 4.7. Current Market Potential and Opportunity Assessment (TAM–SAM–SOM Framework)
- 4.8. RAX Analyst Note
- 4.1. Porters Five Forces
- 5. Market Analysis, Insights and Forecast 2021-2033
- 5.1. Market Analysis, Insights and Forecast - by Technology
- 5.1.1. Film Radiography
- 5.1.2. Computed Radiography
- 5.1.3. Direct Radiography
- 5.1.4. Computed Tomography
- 5.2. Market Analysis, Insights and Forecast - by End-User Industry
- 5.2.1. Aerospace and Defense
- 5.2.2. Petrochemical and Gas
- 5.2.3. Energy and Power
- 5.2.4. Construction
- 5.2.5. Automotive and Transportation
- 5.2.6. Manufacturing
- 5.2.7. Other End-User Industries
- 5.3. Market Analysis, Insights and Forecast - by Region
- 5.3.1. North America
- 5.3.2. Europe
- 5.3.3. Asia
- 5.3.4. Australia and New Zealand
- 5.3.5. Latin America
- 5.3.6. Middle East and Africa
- 5.1. Market Analysis, Insights and Forecast - by Technology
- 6. Global Industrial Radiography Equipment Industry Analysis, Insights and Forecast, 2021-2033
- 6.1. Market Analysis, Insights and Forecast - by Technology
- 6.1.1. Film Radiography
- 6.1.2. Computed Radiography
- 6.1.3. Direct Radiography
- 6.1.4. Computed Tomography
- 6.2. Market Analysis, Insights and Forecast - by End-User Industry
- 6.2.1. Aerospace and Defense
- 6.2.2. Petrochemical and Gas
- 6.2.3. Energy and Power
- 6.2.4. Construction
- 6.2.5. Automotive and Transportation
- 6.2.6. Manufacturing
- 6.2.7. Other End-User Industries
- 6.1. Market Analysis, Insights and Forecast - by Technology
- 7. North America Industrial Radiography Equipment Industry Analysis, Insights and Forecast, 2020-2032
- 7.1. Market Analysis, Insights and Forecast - by Technology
- 7.1.1. Film Radiography
- 7.1.2. Computed Radiography
- 7.1.3. Direct Radiography
- 7.1.4. Computed Tomography
- 7.2. Market Analysis, Insights and Forecast - by End-User Industry
- 7.2.1. Aerospace and Defense
- 7.2.2. Petrochemical and Gas
- 7.2.3. Energy and Power
- 7.2.4. Construction
- 7.2.5. Automotive and Transportation
- 7.2.6. Manufacturing
- 7.2.7. Other End-User Industries
- 7.1. Market Analysis, Insights and Forecast - by Technology
- 8. Europe Industrial Radiography Equipment Industry Analysis, Insights and Forecast, 2020-2032
- 8.1. Market Analysis, Insights and Forecast - by Technology
- 8.1.1. Film Radiography
- 8.1.2. Computed Radiography
- 8.1.3. Direct Radiography
- 8.1.4. Computed Tomography
- 8.2. Market Analysis, Insights and Forecast - by End-User Industry
- 8.2.1. Aerospace and Defense
- 8.2.2. Petrochemical and Gas
- 8.2.3. Energy and Power
- 8.2.4. Construction
- 8.2.5. Automotive and Transportation
- 8.2.6. Manufacturing
- 8.2.7. Other End-User Industries
- 8.1. Market Analysis, Insights and Forecast - by Technology
- 9. Asia Industrial Radiography Equipment Industry Analysis, Insights and Forecast, 2020-2032
- 9.1. Market Analysis, Insights and Forecast - by Technology
- 9.1.1. Film Radiography
- 9.1.2. Computed Radiography
- 9.1.3. Direct Radiography
- 9.1.4. Computed Tomography
- 9.2. Market Analysis, Insights and Forecast - by End-User Industry
- 9.2.1. Aerospace and Defense
- 9.2.2. Petrochemical and Gas
- 9.2.3. Energy and Power
- 9.2.4. Construction
- 9.2.5. Automotive and Transportation
- 9.2.6. Manufacturing
- 9.2.7. Other End-User Industries
- 9.1. Market Analysis, Insights and Forecast - by Technology
- 10. Australia and New Zealand Industrial Radiography Equipment Industry Analysis, Insights and Forecast, 2020-2032
- 10.1. Market Analysis, Insights and Forecast - by Technology
- 10.1.1. Film Radiography
- 10.1.2. Computed Radiography
- 10.1.3. Direct Radiography
- 10.1.4. Computed Tomography
- 10.2. Market Analysis, Insights and Forecast - by End-User Industry
- 10.2.1. Aerospace and Defense
- 10.2.2. Petrochemical and Gas
- 10.2.3. Energy and Power
- 10.2.4. Construction
- 10.2.5. Automotive and Transportation
- 10.2.6. Manufacturing
- 10.2.7. Other End-User Industries
- 10.1. Market Analysis, Insights and Forecast - by Technology
- 11. Latin America Industrial Radiography Equipment Industry Analysis, Insights and Forecast, 2020-2032
- 11.1. Market Analysis, Insights and Forecast - by Technology
- 11.1.1. Film Radiography
- 11.1.2. Computed Radiography
- 11.1.3. Direct Radiography
- 11.1.4. Computed Tomography
- 11.2. Market Analysis, Insights and Forecast - by End-User Industry
- 11.2.1. Aerospace and Defense
- 11.2.2. Petrochemical and Gas
- 11.2.3. Energy and Power
- 11.2.4. Construction
- 11.2.5. Automotive and Transportation
- 11.2.6. Manufacturing
- 11.2.7. Other End-User Industries
- 11.1. Market Analysis, Insights and Forecast - by Technology
- 12. Middle East and Africa Industrial Radiography Equipment Industry Analysis, Insights and Forecast, 2020-2032
- 12.1. Market Analysis, Insights and Forecast - by Technology
- 12.1.1. Film Radiography
- 12.1.2. Computed Radiography
- 12.1.3. Direct Radiography
- 12.1.4. Computed Tomography
- 12.2. Market Analysis, Insights and Forecast - by End-User Industry
- 12.2.1. Aerospace and Defense
- 12.2.2. Petrochemical and Gas
- 12.2.3. Energy and Power
- 12.2.4. Construction
- 12.2.5. Automotive and Transportation
- 12.2.6. Manufacturing
- 12.2.7. Other End-User Industries
- 12.1. Market Analysis, Insights and Forecast - by Technology
- 13. Competitive Analysis
- 13.1. Company Profiles
- 13.1.1 L3Harris Technologies Inc
- 13.1.1.1. Company Overview
- 13.1.1.2. Products
- 13.1.1.3. Company Financials
- 13.1.1.4. SWOT Analysis
- 13.1.2 Baker Hughes
- 13.1.2.1. Company Overview
- 13.1.2.2. Products
- 13.1.2.3. Company Financials
- 13.1.2.4. SWOT Analysis
- 13.1.3 Vidisco Ltd (Aran Electronics Ltd )
- 13.1.3.1. Company Overview
- 13.1.3.2. Products
- 13.1.3.3. Company Financials
- 13.1.3.4. SWOT Analysis
- 13.1.4 Hitachi Ltd
- 13.1.4.1. Company Overview
- 13.1.4.2. Products
- 13.1.4.3. Company Financials
- 13.1.4.4. SWOT Analysis
- 13.1.5 Comet Holding AG
- 13.1.5.1. Company Overview
- 13.1.5.2. Products
- 13.1.5.3. Company Financials
- 13.1.5.4. SWOT Analysis
- 13.1.6 Canon Medical Systems Corporation (Canon Inc )
- 13.1.6.1. Company Overview
- 13.1.6.2. Products
- 13.1.6.3. Company Financials
- 13.1.6.4. SWOT Analysis
- 13.1.7 Rigaku Corporation (Carlyle Group)
- 13.1.7.1. Company Overview
- 13.1.7.2. Products
- 13.1.7.3. Company Financials
- 13.1.7.4. SWOT Analysis
- 13.1.8 North Star Imaging Inc
- 13.1.8.1. Company Overview
- 13.1.8.2. Products
- 13.1.8.3. Company Financials
- 13.1.8.4. SWOT Analysis
- 13.1.9 Carestream Health
- 13.1.9.1. Company Overview
- 13.1.9.2. Products
- 13.1.9.3. Company Financials
- 13.1.9.4. SWOT Analysis
- 13.1.10 Carl Zeiss AG
- 13.1.10.1. Company Overview
- 13.1.10.2. Products
- 13.1.10.3. Company Financials
- 13.1.10.4. SWOT Analysis
- 13.1.11 Evident Corporation (Bain Capital)
- 13.1.11.1. Company Overview
- 13.1.11.2. Products
- 13.1.11.3. Company Financials
- 13.1.11.4. SWOT Analysis
- 13.1.12 Hamamatsu Photonics K K
- 13.1.12.1. Company Overview
- 13.1.12.2. Products
- 13.1.12.3. Company Financials
- 13.1.12.4. SWOT Analysis
- 13.1.13 Durr NDT GmbH & Co Kg
- 13.1.13.1. Company Overview
- 13.1.13.2. Products
- 13.1.13.3. Company Financials
- 13.1.13.4. SWOT Analysis
- 13.1.14 Teledyne Dalsa Inc (Teledyne Technologies)
- 13.1.14.1. Company Overview
- 13.1.14.2. Products
- 13.1.14.3. Company Financials
- 13.1.14.4. SWOT Analysis
- 13.1.15 Fujifilm Corporation (Fujifilm Holdings Corporation)
- 13.1.15.1. Company Overview
- 13.1.15.2. Products
- 13.1.15.3. Company Financials
- 13.1.15.4. SWOT Analysis
- 13.1.16 Nikon Metrology NV (Nikon Corporation)
- 13.1.16.1. Company Overview
- 13.1.16.2. Products
- 13.1.16.3. Company Financials
- 13.1.16.4. SWOT Analysis
- 13.1.1 L3Harris Technologies Inc
- 13.2. Market Entropy
- 13.2.1 Company's Key Areas Served
- 13.2.2 Recent Developments
- 13.3. Company Market Share Analysis 2025
- 13.3.1 Top 5 Companies Market Share Analysis
- 13.3.2 Top 3 Companies Market Share Analysis
- 13.4. List of Potential Customers
- 14. Research Methodology
List of Figures
- Figure 1: Global Industrial Radiography Equipment Industry Revenue Breakdown (billion, %) by Region 2025 & 2033
- Figure 2: Global Industrial Radiography Equipment Industry Volume Breakdown (K Unit, %) by Region 2025 & 2033
- Figure 3: North America Industrial Radiography Equipment Industry Revenue (billion), by Technology 2025 & 2033
- Figure 4: North America Industrial Radiography Equipment Industry Volume (K Unit), by Technology 2025 & 2033
- Figure 5: North America Industrial Radiography Equipment Industry Revenue Share (%), by Technology 2025 & 2033
- Figure 6: North America Industrial Radiography Equipment Industry Volume Share (%), by Technology 2025 & 2033
- Figure 7: North America Industrial Radiography Equipment Industry Revenue (billion), by End-User Industry 2025 & 2033
- Figure 8: North America Industrial Radiography Equipment Industry Volume (K Unit), by End-User Industry 2025 & 2033
- Figure 9: North America Industrial Radiography Equipment Industry Revenue Share (%), by End-User Industry 2025 & 2033
- Figure 10: North America Industrial Radiography Equipment Industry Volume Share (%), by End-User Industry 2025 & 2033
- Figure 11: North America Industrial Radiography Equipment Industry Revenue (billion), by Country 2025 & 2033
- Figure 12: North America Industrial Radiography Equipment Industry Volume (K Unit), by Country 2025 & 2033
- Figure 13: North America Industrial Radiography Equipment Industry Revenue Share (%), by Country 2025 & 2033
- Figure 14: North America Industrial Radiography Equipment Industry Volume Share (%), by Country 2025 & 2033
- Figure 15: Europe Industrial Radiography Equipment Industry Revenue (billion), by Technology 2025 & 2033
- Figure 16: Europe Industrial Radiography Equipment Industry Volume (K Unit), by Technology 2025 & 2033
- Figure 17: Europe Industrial Radiography Equipment Industry Revenue Share (%), by Technology 2025 & 2033
- Figure 18: Europe Industrial Radiography Equipment Industry Volume Share (%), by Technology 2025 & 2033
- Figure 19: Europe Industrial Radiography Equipment Industry Revenue (billion), by End-User Industry 2025 & 2033
- Figure 20: Europe Industrial Radiography Equipment Industry Volume (K Unit), by End-User Industry 2025 & 2033
- Figure 21: Europe Industrial Radiography Equipment Industry Revenue Share (%), by End-User Industry 2025 & 2033
- Figure 22: Europe Industrial Radiography Equipment Industry Volume Share (%), by End-User Industry 2025 & 2033
- Figure 23: Europe Industrial Radiography Equipment Industry Revenue (billion), by Country 2025 & 2033
- Figure 24: Europe Industrial Radiography Equipment Industry Volume (K Unit), by Country 2025 & 2033
- Figure 25: Europe Industrial Radiography Equipment Industry Revenue Share (%), by Country 2025 & 2033
- Figure 26: Europe Industrial Radiography Equipment Industry Volume Share (%), by Country 2025 & 2033
- Figure 27: Asia Industrial Radiography Equipment Industry Revenue (billion), by Technology 2025 & 2033
- Figure 28: Asia Industrial Radiography Equipment Industry Volume (K Unit), by Technology 2025 & 2033
- Figure 29: Asia Industrial Radiography Equipment Industry Revenue Share (%), by Technology 2025 & 2033
- Figure 30: Asia Industrial Radiography Equipment Industry Volume Share (%), by Technology 2025 & 2033
- Figure 31: Asia Industrial Radiography Equipment Industry Revenue (billion), by End-User Industry 2025 & 2033
- Figure 32: Asia Industrial Radiography Equipment Industry Volume (K Unit), by End-User Industry 2025 & 2033
- Figure 33: Asia Industrial Radiography Equipment Industry Revenue Share (%), by End-User Industry 2025 & 2033
- Figure 34: Asia Industrial Radiography Equipment Industry Volume Share (%), by End-User Industry 2025 & 2033
- Figure 35: Asia Industrial Radiography Equipment Industry Revenue (billion), by Country 2025 & 2033
- Figure 36: Asia Industrial Radiography Equipment Industry Volume (K Unit), by Country 2025 & 2033
- Figure 37: Asia Industrial Radiography Equipment Industry Revenue Share (%), by Country 2025 & 2033
- Figure 38: Asia Industrial Radiography Equipment Industry Volume Share (%), by Country 2025 & 2033
- Figure 39: Australia and New Zealand Industrial Radiography Equipment Industry Revenue (billion), by Technology 2025 & 2033
- Figure 40: Australia and New Zealand Industrial Radiography Equipment Industry Volume (K Unit), by Technology 2025 & 2033
- Figure 41: Australia and New Zealand Industrial Radiography Equipment Industry Revenue Share (%), by Technology 2025 & 2033
- Figure 42: Australia and New Zealand Industrial Radiography Equipment Industry Volume Share (%), by Technology 2025 & 2033
- Figure 43: Australia and New Zealand Industrial Radiography Equipment Industry Revenue (billion), by End-User Industry 2025 & 2033
- Figure 44: Australia and New Zealand Industrial Radiography Equipment Industry Volume (K Unit), by End-User Industry 2025 & 2033
- Figure 45: Australia and New Zealand Industrial Radiography Equipment Industry Revenue Share (%), by End-User Industry 2025 & 2033
- Figure 46: Australia and New Zealand Industrial Radiography Equipment Industry Volume Share (%), by End-User Industry 2025 & 2033
- Figure 47: Australia and New Zealand Industrial Radiography Equipment Industry Revenue (billion), by Country 2025 & 2033
- Figure 48: Australia and New Zealand Industrial Radiography Equipment Industry Volume (K Unit), by Country 2025 & 2033
- Figure 49: Australia and New Zealand Industrial Radiography Equipment Industry Revenue Share (%), by Country 2025 & 2033
- Figure 50: Australia and New Zealand Industrial Radiography Equipment Industry Volume Share (%), by Country 2025 & 2033
- Figure 51: Latin America Industrial Radiography Equipment Industry Revenue (billion), by Technology 2025 & 2033
- Figure 52: Latin America Industrial Radiography Equipment Industry Volume (K Unit), by Technology 2025 & 2033
- Figure 53: Latin America Industrial Radiography Equipment Industry Revenue Share (%), by Technology 2025 & 2033
- Figure 54: Latin America Industrial Radiography Equipment Industry Volume Share (%), by Technology 2025 & 2033
- Figure 55: Latin America Industrial Radiography Equipment Industry Revenue (billion), by End-User Industry 2025 & 2033
- Figure 56: Latin America Industrial Radiography Equipment Industry Volume (K Unit), by End-User Industry 2025 & 2033
- Figure 57: Latin America Industrial Radiography Equipment Industry Revenue Share (%), by End-User Industry 2025 & 2033
- Figure 58: Latin America Industrial Radiography Equipment Industry Volume Share (%), by End-User Industry 2025 & 2033
- Figure 59: Latin America Industrial Radiography Equipment Industry Revenue (billion), by Country 2025 & 2033
- Figure 60: Latin America Industrial Radiography Equipment Industry Volume (K Unit), by Country 2025 & 2033
- Figure 61: Latin America Industrial Radiography Equipment Industry Revenue Share (%), by Country 2025 & 2033
- Figure 62: Latin America Industrial Radiography Equipment Industry Volume Share (%), by Country 2025 & 2033
- Figure 63: Middle East and Africa Industrial Radiography Equipment Industry Revenue (billion), by Technology 2025 & 2033
- Figure 64: Middle East and Africa Industrial Radiography Equipment Industry Volume (K Unit), by Technology 2025 & 2033
- Figure 65: Middle East and Africa Industrial Radiography Equipment Industry Revenue Share (%), by Technology 2025 & 2033
- Figure 66: Middle East and Africa Industrial Radiography Equipment Industry Volume Share (%), by Technology 2025 & 2033
- Figure 67: Middle East and Africa Industrial Radiography Equipment Industry Revenue (billion), by End-User Industry 2025 & 2033
- Figure 68: Middle East and Africa Industrial Radiography Equipment Industry Volume (K Unit), by End-User Industry 2025 & 2033
- Figure 69: Middle East and Africa Industrial Radiography Equipment Industry Revenue Share (%), by End-User Industry 2025 & 2033
- Figure 70: Middle East and Africa Industrial Radiography Equipment Industry Volume Share (%), by End-User Industry 2025 & 2033
- Figure 71: Middle East and Africa Industrial Radiography Equipment Industry Revenue (billion), by Country 2025 & 2033
- Figure 72: Middle East and Africa Industrial Radiography Equipment Industry Volume (K Unit), by Country 2025 & 2033
- Figure 73: Middle East and Africa Industrial Radiography Equipment Industry Revenue Share (%), by Country 2025 & 2033
- Figure 74: Middle East and Africa Industrial Radiography Equipment Industry Volume Share (%), by Country 2025 & 2033
List of Tables
- Table 1: Global Industrial Radiography Equipment Industry Revenue billion Forecast, by Technology 2020 & 2033
- Table 2: Global Industrial Radiography Equipment Industry Volume K Unit Forecast, by Technology 2020 & 2033
- Table 3: Global Industrial Radiography Equipment Industry Revenue billion Forecast, by End-User Industry 2020 & 2033
- Table 4: Global Industrial Radiography Equipment Industry Volume K Unit Forecast, by End-User Industry 2020 & 2033
- Table 5: Global Industrial Radiography Equipment Industry Revenue billion Forecast, by Region 2020 & 2033
- Table 6: Global Industrial Radiography Equipment Industry Volume K Unit Forecast, by Region 2020 & 2033
- Table 7: Global Industrial Radiography Equipment Industry Revenue billion Forecast, by Technology 2020 & 2033
- Table 8: Global Industrial Radiography Equipment Industry Volume K Unit Forecast, by Technology 2020 & 2033
- Table 9: Global Industrial Radiography Equipment Industry Revenue billion Forecast, by End-User Industry 2020 & 2033
- Table 10: Global Industrial Radiography Equipment Industry Volume K Unit Forecast, by End-User Industry 2020 & 2033
- Table 11: Global Industrial Radiography Equipment Industry Revenue billion Forecast, by Country 2020 & 2033
- Table 12: Global Industrial Radiography Equipment Industry Volume K Unit Forecast, by Country 2020 & 2033
- Table 13: Global Industrial Radiography Equipment Industry Revenue billion Forecast, by Technology 2020 & 2033
- Table 14: Global Industrial Radiography Equipment Industry Volume K Unit Forecast, by Technology 2020 & 2033
- Table 15: Global Industrial Radiography Equipment Industry Revenue billion Forecast, by End-User Industry 2020 & 2033
- Table 16: Global Industrial Radiography Equipment Industry Volume K Unit Forecast, by End-User Industry 2020 & 2033
- Table 17: Global Industrial Radiography Equipment Industry Revenue billion Forecast, by Country 2020 & 2033
- Table 18: Global Industrial Radiography Equipment Industry Volume K Unit Forecast, by Country 2020 & 2033
- Table 19: Global Industrial Radiography Equipment Industry Revenue billion Forecast, by Technology 2020 & 2033
- Table 20: Global Industrial Radiography Equipment Industry Volume K Unit Forecast, by Technology 2020 & 2033
- Table 21: Global Industrial Radiography Equipment Industry Revenue billion Forecast, by End-User Industry 2020 & 2033
- Table 22: Global Industrial Radiography Equipment Industry Volume K Unit Forecast, by End-User Industry 2020 & 2033
- Table 23: Global Industrial Radiography Equipment Industry Revenue billion Forecast, by Country 2020 & 2033
- Table 24: Global Industrial Radiography Equipment Industry Volume K Unit Forecast, by Country 2020 & 2033
- Table 25: Global Industrial Radiography Equipment Industry Revenue billion Forecast, by Technology 2020 & 2033
- Table 26: Global Industrial Radiography Equipment Industry Volume K Unit Forecast, by Technology 2020 & 2033
- Table 27: Global Industrial Radiography Equipment Industry Revenue billion Forecast, by End-User Industry 2020 & 2033
- Table 28: Global Industrial Radiography Equipment Industry Volume K Unit Forecast, by End-User Industry 2020 & 2033
- Table 29: Global Industrial Radiography Equipment Industry Revenue billion Forecast, by Country 2020 & 2033
- Table 30: Global Industrial Radiography Equipment Industry Volume K Unit Forecast, by Country 2020 & 2033
- Table 31: Global Industrial Radiography Equipment Industry Revenue billion Forecast, by Technology 2020 & 2033
- Table 32: Global Industrial Radiography Equipment Industry Volume K Unit Forecast, by Technology 2020 & 2033
- Table 33: Global Industrial Radiography Equipment Industry Revenue billion Forecast, by End-User Industry 2020 & 2033
- Table 34: Global Industrial Radiography Equipment Industry Volume K Unit Forecast, by End-User Industry 2020 & 2033
- Table 35: Global Industrial Radiography Equipment Industry Revenue billion Forecast, by Country 2020 & 2033
- Table 36: Global Industrial Radiography Equipment Industry Volume K Unit Forecast, by Country 2020 & 2033
- Table 37: Global Industrial Radiography Equipment Industry Revenue billion Forecast, by Technology 2020 & 2033
- Table 38: Global Industrial Radiography Equipment Industry Volume K Unit Forecast, by Technology 2020 & 2033
- Table 39: Global Industrial Radiography Equipment Industry Revenue billion Forecast, by End-User Industry 2020 & 2033
- Table 40: Global Industrial Radiography Equipment Industry Volume K Unit Forecast, by End-User Industry 2020 & 2033
- Table 41: Global Industrial Radiography Equipment Industry Revenue billion Forecast, by Country 2020 & 2033
- Table 42: Global Industrial Radiography Equipment Industry Volume K Unit Forecast, by Country 2020 & 2033
Frequently Asked Questions
1. What is the projected Compound Annual Growth Rate (CAGR) of the Industrial Radiography Equipment Industry?
The projected CAGR is approximately 8.6%.
2. Which companies are prominent players in the Industrial Radiography Equipment Industry?
Key companies in the market include L3Harris Technologies Inc, Baker Hughes, Vidisco Ltd (Aran Electronics Ltd ), Hitachi Ltd, Comet Holding AG, Canon Medical Systems Corporation (Canon Inc ), Rigaku Corporation (Carlyle Group), North Star Imaging Inc, Carestream Health, Carl Zeiss AG, Evident Corporation (Bain Capital), Hamamatsu Photonics K K, Durr NDT GmbH & Co Kg, Teledyne Dalsa Inc (Teledyne Technologies), Fujifilm Corporation (Fujifilm Holdings Corporation), Nikon Metrology NV (Nikon Corporation).
3. What are the main segments of the Industrial Radiography Equipment Industry?
The market segments include Technology, End-User Industry.
4. Can you provide details about the market size?
The market size is estimated to be USD 1.35 billion as of 2022.
5. What are some drivers contributing to market growth?
Rising Demand From Automotive and Aerospace Industry; Augmented Accuracy of Inspection With the Integration of Advanced Software.
6. What are the notable trends driving market growth?
Aerospace and Defense to be the Largest End User.
7. Are there any restraints impacting market growth?
High Risk of Radiation Since it uses Gamma Rays. X-Rays; High Deployment Costs.
8. Can you provide examples of recent developments in the market?
July 2023: Canon Inc. launched the Zexirai9 digital X-ray RF system, a multi-purpose fluoroscopic table with many new functions and a compact design. Zexirai9 is a new digital X-ray RF system equipped with Canon's flat panel detector (FPD) and a newly developed image processing technology; the system has been developed in consultation with medical staff, referring physicians, and engineers.
9. What pricing options are available for accessing the report?
Pricing options include single-user, multi-user, and enterprise licenses priced at USD 4750, USD 5250, and USD 8750 respectively.
10. Is the market size provided in terms of value or volume?
The market size is provided in terms of value, measured in billion and volume, measured in K Unit.
11. Are there any specific market keywords associated with the report?
Yes, the market keyword associated with the report is "Industrial Radiography Equipment Industry," which aids in identifying and referencing the specific market segment covered.
12. How do I determine which pricing option suits my needs best?
The pricing options vary based on user requirements and access needs. Individual users may opt for single-user licenses, while businesses requiring broader access may choose multi-user or enterprise licenses for cost-effective access to the report.
13. Are there any additional resources or data provided in the Industrial Radiography Equipment Industry report?
While the report offers comprehensive insights, it's advisable to review the specific contents or supplementary materials provided to ascertain if additional resources or data are available.
14. How can I stay updated on further developments or reports in the Industrial Radiography Equipment Industry?
To stay informed about further developments, trends, and reports in the Industrial Radiography Equipment Industry, consider subscribing to industry newsletters, following relevant companies and organizations, or regularly checking reputable industry news sources and publications.
Methodology
Step 1 - Identification of Relevant Samples Size from Population Database


Step 2 - Approaches for Defining Global Market Size (Value, Volume* & Price*)

Note*: In applicable scenarios
Step 3 - Data Sources
Primary Research
- Web Analytics
- Survey Reports
- Research Institute
- Latest Research Reports
- Opinion Leaders
Secondary Research
- Annual Reports
- White Paper
- Latest Press Release
- Industry Association
- Paid Database
- Investor Presentations

Step 4 - Data Triangulation
Involves using different sources of information in order to increase the validity of a study
These sources are likely to be stakeholders in a program - participants, other researchers, program staff, other community members, and so on.
Then we put all data in single framework & apply various statistical tools to find out the dynamic on the market.
During the analysis stage, feedback from the stakeholder groups would be compared to determine areas of agreement as well as areas of divergence