Key Insights
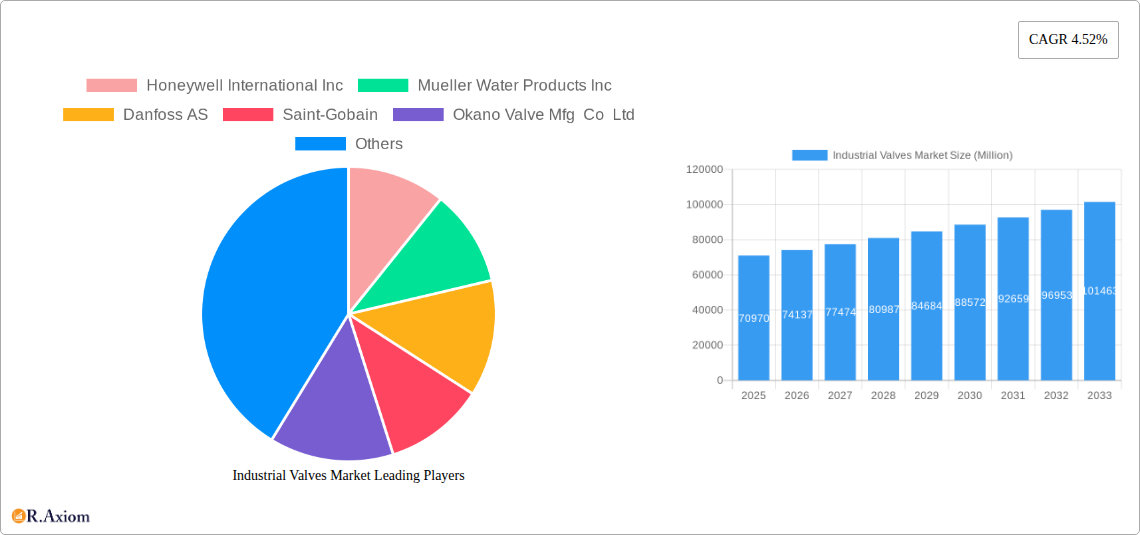
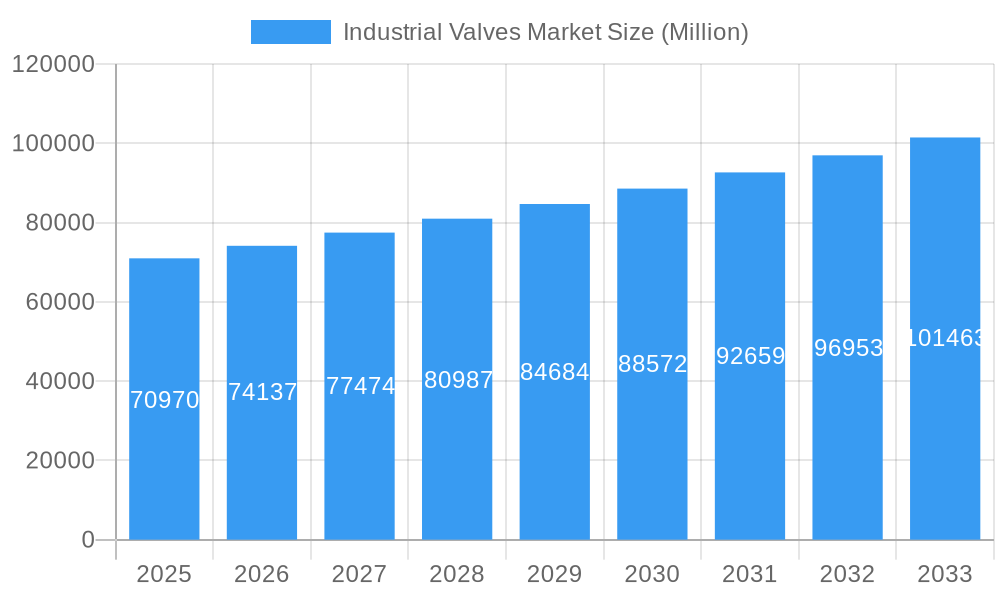
The global industrial valves market, valued at $70.97 billion in 2025, is projected to experience robust growth, driven by the increasing demand across diverse industrial sectors. A compound annual growth rate (CAGR) of 4.52% from 2025 to 2033 indicates a significant expansion, fueled primarily by the burgeoning oil and gas, water and wastewater management, and chemical processing industries. These sectors require efficient and reliable valve systems for process control, safety, and operational efficiency. The rising adoption of automation and smart technologies within these industries further contributes to market growth. Furthermore, the increasing emphasis on energy efficiency and sustainable practices is driving the demand for advanced valve designs with improved performance characteristics and reduced environmental impact. Growth is also supported by infrastructure development projects globally, particularly in emerging economies experiencing rapid industrialization.
Industrial Valves Market Market Size (In Billion)
Market segmentation reveals a diverse landscape, with butterfly valves, ball valves, and globe valves comprising a significant portion of the market share based on type. Quarter-turn valves dominate the product segment due to their ease of operation and rapid response times. Geographically, North America and Europe currently hold significant market share, but the Asia-Pacific region is anticipated to witness the most rapid growth due to its expanding industrial base and significant investment in infrastructure projects. Competitive dynamics are characterized by the presence of established global players like Honeywell, Danfoss, and Emerson Electric, alongside regional manufacturers. These companies are focusing on innovation, strategic partnerships, and acquisitions to enhance their market position and meet the evolving needs of diverse customer segments. The market's future growth will depend on factors such as global economic conditions, technological advancements, and regulatory changes impacting industrial operations.
Industrial Valves Market Company Market Share
Industrial Valves Market: A Comprehensive Report (2019-2033)
This detailed report provides a comprehensive analysis of the Industrial Valves Market, offering valuable insights for industry stakeholders, investors, and strategic decision-makers. The study period covers 2019-2033, with 2025 as the base year and a forecast period of 2025-2033. The report incorporates extensive market segmentation, competitive landscape analysis, and future growth projections. The report utilizes data and projections, where available; otherwise, estimated values (xx) are provided.
Industrial Valves Market Market Concentration & Innovation
The Industrial Valves market exhibits a moderately concentrated structure, with several major players holding significant market share. However, a number of smaller, specialized players also contribute significantly to innovation and market dynamism. Market share data for the top players (Honeywell International Inc, Mueller Water Products Inc, Danfoss AS, etc.) will be presented in the full report. Mergers and acquisitions (M&A) activity plays a significant role in shaping the competitive landscape. Recent deals, such as the USD 245 Million acquisition of Velan Inc. by Flowserve Corporation in February 2023, have significantly altered market positions and consolidated market power. The report details several M&A events from 2019 through 2023, analyzing their impact on market concentration and competitive dynamics, including deal values and market share changes. Innovation is driven by the need for improved efficiency, enhanced safety, and the development of valves capable of withstanding increasingly extreme operating conditions. Stringent regulatory frameworks, particularly concerning environmental compliance and safety standards, are key drivers of technological advancements in valve design and material selection. The report thoroughly analyzes the impact of such regulations and identifies opportunities for innovative solutions. Furthermore, the report details trends in end-user preferences, analyzing shifting demands across different industrial sectors.
Industrial Valves Market Industry Trends & Insights
The global industrial valves market is poised for substantial growth during the forecast period (2025-2033), driven by several key factors. Increased investment in infrastructure projects, particularly in developing economies, is fueling demand for industrial valves across various applications. The report analyzes the Compound Annual Growth Rate (CAGR) of the market during the historical period (2019-2024) and projects the CAGR for the forecast period, providing a clear understanding of market growth trajectory. Technological advancements, including the adoption of smart valves and digitalization, are driving increased efficiency and enhancing operational reliability. Consumer preferences are shifting toward sustainable and environmentally friendly valves, increasing the demand for valves made from sustainable materials and those contributing to lower emissions. The competitive landscape is dynamic, with companies constantly innovating and expanding their product portfolios to cater to evolving customer needs. The report examines the competitive dynamics, assessing market penetration of key players and identifying areas of future competitive intensity. The report also explores emerging trends, including the integration of IoT technology and the rise of advanced materials in valve manufacturing, illustrating their potential impacts on the market.
Dominant Markets & Segments in Industrial Valves Market
The industrial valves market shows diverse growth patterns across regions, countries, and segments. While specific market share data for each segment and region will be provided in the complete report, we can anticipate strong performance in regions with substantial infrastructure development. The oil and gas industry is a key driver for many valve segments, while the water and wastewater management sector is seeing significant growth due to expanding urbanization and infrastructure renewal efforts.
Leading Regions: (Specific regional dominance details will be provided in the full report. Likely candidates include regions with substantial oil and gas activity and developing economies with rapid infrastructure development). Key drivers will include factors such as government policies supporting infrastructure projects, economic growth rates, and industrial activity.
Dominant Segments: The full report will provide a detailed analysis of each segment's dominance. Some initial insights suggest that ball valves and butterfly valves will likely maintain their large market share across various applications due to their widespread use and cost-effectiveness. The demand for quarter-turn valves is predicted to grow steadily due to their fast opening and closing times. The Oil and Gas and Water and Wastewater segments will likely remain dominant, driven by continuous infrastructure investment and regulatory requirements. Detailed explanations of these segment dominances are provided in the full report.
Industrial Valves Market Product Developments
Recent product innovations in the industrial valves market focus on enhancing performance, efficiency, and safety. This includes the development of smart valves with integrated sensors and control systems, enabling real-time monitoring and optimized performance. Advanced materials, like corrosion-resistant alloys and high-performance polymers, are increasingly used to improve durability and extend the lifespan of valves. The market is witnessing a growing trend towards modular valve designs that allow for easy maintenance and customization, aligning well with the growing demand for flexibility and rapid deployment in industrial settings. The developments aim to meet the requirements of diverse industrial sectors and address specific challenges related to temperature, pressure, and corrosive media.
Report Scope & Segmentation Analysis
This report comprehensively segments the industrial valves market across various parameters:
By Type: Butterfly Valve, Ball Valve, Globe Valve, Gate Valve, Plug Valve, Other Types. Each type is analyzed in terms of growth projections, market size, and competitive dynamics.
By Product: Quarter-turn Valve, Multi-turn Valve, Other Products. Each product category is analyzed considering its specific applications, technological advancements, and market size.
By Application: Power, Water and Wastewater Management, Chemicals, Oil and Gas, Other Applications (Includes Food Processing, Mining, and Marine). Each application area is examined according to market demand, regulatory landscape, and growth potential.
Key Drivers of Industrial Valves Market Growth
The growth of the industrial valves market is propelled by several factors. Firstly, substantial investments in infrastructure development worldwide fuel demand across various sectors. Secondly, the increasing emphasis on automation and digitization within industries drives the adoption of smart valves and advanced control systems. Thirdly, stringent environmental regulations necessitate the use of valves designed for enhanced efficiency and reduced emissions. Finally, the expansion of industries such as oil and gas, chemicals, and water treatment contributes to heightened demand for specialized valves.
Challenges in the Industrial Valves Market Sector
The industrial valves market faces various challenges, including fluctuations in raw material prices impacting production costs. Supply chain disruptions can cause delays and shortages, particularly in the procurement of specialized components. Intense competition from numerous players, both established and emerging, necessitates continuous innovation and cost optimization. Finally, stringent regulatory compliance requirements and the need for certifications add to operational complexity and costs. The report quantitatively assesses the impact of these challenges.
Emerging Opportunities in Industrial Valves Market
The industrial valves market presents several compelling opportunities. The burgeoning renewable energy sector, particularly in areas such as wind and solar power generation, presents substantial demand for valves tailored to these applications. The increasing adoption of Industry 4.0 technologies creates opportunities for the development and integration of smart valves and advanced monitoring systems. Lastly, the expansion into developing economies presents a lucrative growth area, particularly for manufacturers capable of supplying cost-effective and reliable valve solutions.
Leading Players in the Industrial Valves Market Market
- Honeywell International Inc
- Mueller Water Products Inc
- Danfoss AS
- Saint-Gobain
- Okano Valve Mfg Co Ltd
- ALFA LAVAL
- Flowserve Corporation
- The Weir Group PLC
- Georg Fischer Ltd
- NIBCO Inc
- Baker Hughes
- Hitachi Ltd
- Xylem*List Not Exhaustive
- Emerson Electric Co
- Zhejiang Dunan Valve Co Ltd
- CIRCOR International Inc
- AVK Holding AS
- ITT Inc
- KLINGER Group
- IMI
- Crane Co
- SLB
- Valvitalia SpA
- Curtiss-Wright Corporation
- TechnipFMC PLC
- KITZ Corporation
Key Developments in Industrial Valves Market Industry
- September 2023: Danfoss India opened a new 43,000 sq ft distribution center in Chennai, expanding its reach and capacity.
- February 2023: Flowserve Corporation acquired Velan Inc. for USD 245 Million, strengthening its market position.
- November 2022: IMI Saudi Industry launched a new 5,000 m2 facility in Dammam, boosting local manufacturing capabilities.
- November 2022: James Walker introduced the Supagraf HT valve stem seal for high-temperature applications, expanding its product portfolio.
Strategic Outlook for Industrial Valves Market Market
The industrial valves market is poised for sustained growth driven by continued infrastructure development and technological advancements. The increasing adoption of smart valves and the expansion into new applications, such as renewable energy, will contribute to this growth. Companies that embrace innovation, strategic partnerships, and a focus on sustainability will be well-positioned to capture significant market share in the years to come. The global shift towards automation and digitalization within industrial processes will create additional demand for sophisticated valve solutions, providing further growth potential for the market.
Industrial Valves Market Segmentation
-
1. Type
- 1.1. Butterfly Valve
- 1.2. Ball Valve
- 1.3. Globe Valve
- 1.4. Gate Valve
- 1.5. Plug Valve
- 1.6. Other Types
-
2. Product
- 2.1. Quarter-turn Valve
- 2.2. Multi-turn Valve
- 2.3. Other Products
-
3. Application
- 3.1. Power
- 3.2. Water and Wastewater Management
- 3.3. Chemicals
- 3.4. Oil and Gas
- 3.5. Other Ap
Industrial Valves Market Segmentation By Geography
-
1. Asia Pacific
- 1.1. China
- 1.2. India
- 1.3. Japan
- 1.4. South Korea
- 1.5. Indonesia
- 1.6. Vietnam
- 1.7. Malaysia
- 1.8. Thailand
- 1.9. Rest of Asia Pacific
-
2. North America
- 2.1. United States
- 2.2. Canada
- 2.3. Mexico
-
3. Europe
- 3.1. Germany
- 3.2. United Kingdom
- 3.3. Italy
- 3.4. France
- 3.5. NORDIC
- 3.6. Turkey
- 3.7. Russia
- 3.8. Spain
- 3.9. Rest of Europe
-
4. South America
- 4.1. Brazil
- 4.2. Argentina
- 4.3. Colombia
- 4.4. Rest of South America
-
5. Middle East and Africa
- 5.1. Saudi Arabia
- 5.2. South Africa
- 5.3. United Arab Emirates
- 5.4. Qatar
- 5.5. Nigeria
- 5.6. Egypt
- 5.7. Rest of Middle East and Africa
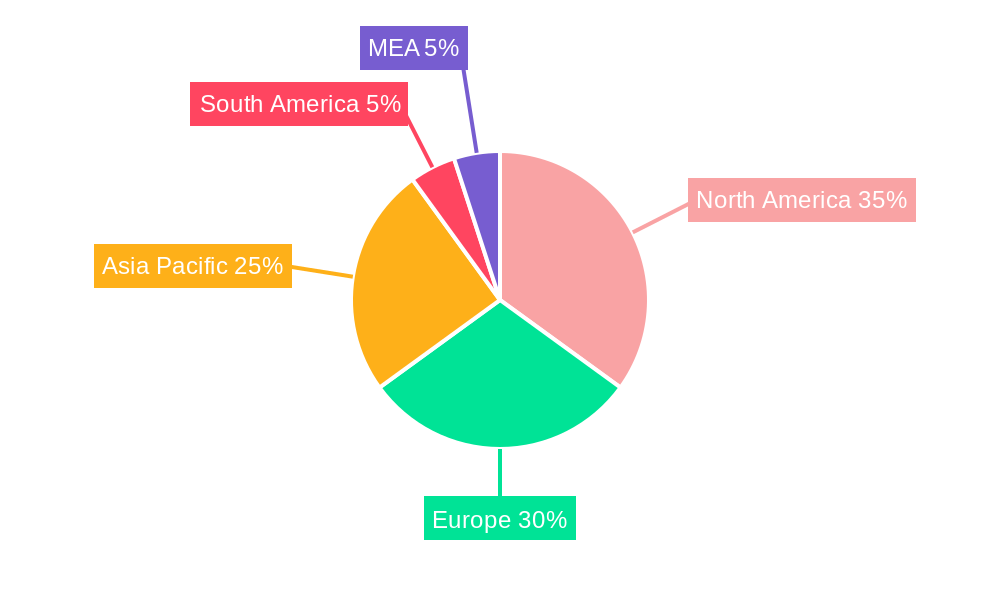
Industrial Valves Market Regional Market Share
Geographic Coverage of Industrial Valves Market
Industrial Valves Market REPORT HIGHLIGHTS
| Aspects | Details |
|---|---|
| Study Period | 2020-2034 |
| Base Year | 2025 |
| Estimated Year | 2026 |
| Forecast Period | 2026-2034 |
| Historical Period | 2020-2025 |
| Growth Rate | CAGR of 4.52% from 2020-2034 |
| Segmentation |
|
Table of Contents
- 1. Introduction
- 1.1. Research Scope
- 1.2. Market Segmentation
- 1.3. Research Objective
- 1.4. Definitions and Assumptions
- 2. Executive Summary
- 2.1. Market Snapshot
- 3. Market Dynamics
- 3.1. Market Drivers
- 3.2. Market Restrains
- 3.3. Market Trends
- 3.4. Market Opportunities
- 4. Market Factor Analysis
- 4.1. Porters Five Forces
- 4.1.1. Bargaining Power of Suppliers
- 4.1.2. Bargaining Power of Buyers
- 4.1.3. Threat of New Entrants
- 4.1.4. Threat of Substitutes
- 4.1.5. Competitive Rivalry
- 4.2. PESTEL analysis
- 4.3. BCG Analysis
- 4.3.1. Stars (High Growth, High Market Share)
- 4.3.2. Cash Cows (Low Growth, High Market Share)
- 4.3.3. Question Mark (High Growth, Low Market Share)
- 4.3.4. Dogs (Low Growth, Low Market Share)
- 4.4. Ansoff Matrix Analysis
- 4.5. Supply Chain Analysis
- 4.6. Regulatory Landscape
- 4.7. Current Market Potential and Opportunity Assessment (TAM–SAM–SOM Framework)
- 4.8. RAX Analyst Note
- 4.1. Porters Five Forces
- 5. Market Analysis, Insights and Forecast 2021-2033
- 5.1. Market Analysis, Insights and Forecast - by Type
- 5.1.1. Butterfly Valve
- 5.1.2. Ball Valve
- 5.1.3. Globe Valve
- 5.1.4. Gate Valve
- 5.1.5. Plug Valve
- 5.1.6. Other Types
- 5.2. Market Analysis, Insights and Forecast - by Product
- 5.2.1. Quarter-turn Valve
- 5.2.2. Multi-turn Valve
- 5.2.3. Other Products
- 5.3. Market Analysis, Insights and Forecast - by Application
- 5.3.1. Power
- 5.3.2. Water and Wastewater Management
- 5.3.3. Chemicals
- 5.3.4. Oil and Gas
- 5.3.5. Other Ap
- 5.4. Market Analysis, Insights and Forecast - by Region
- 5.4.1. Asia Pacific
- 5.4.2. North America
- 5.4.3. Europe
- 5.4.4. South America
- 5.4.5. Middle East and Africa
- 5.1. Market Analysis, Insights and Forecast - by Type
- 6. Global Industrial Valves Market Analysis, Insights and Forecast, 2021-2033
- 6.1. Market Analysis, Insights and Forecast - by Type
- 6.1.1. Butterfly Valve
- 6.1.2. Ball Valve
- 6.1.3. Globe Valve
- 6.1.4. Gate Valve
- 6.1.5. Plug Valve
- 6.1.6. Other Types
- 6.2. Market Analysis, Insights and Forecast - by Product
- 6.2.1. Quarter-turn Valve
- 6.2.2. Multi-turn Valve
- 6.2.3. Other Products
- 6.3. Market Analysis, Insights and Forecast - by Application
- 6.3.1. Power
- 6.3.2. Water and Wastewater Management
- 6.3.3. Chemicals
- 6.3.4. Oil and Gas
- 6.3.5. Other Ap
- 6.1. Market Analysis, Insights and Forecast - by Type
- 7. Asia Pacific Industrial Valves Market Analysis, Insights and Forecast, 2020-2032
- 7.1. Market Analysis, Insights and Forecast - by Type
- 7.1.1. Butterfly Valve
- 7.1.2. Ball Valve
- 7.1.3. Globe Valve
- 7.1.4. Gate Valve
- 7.1.5. Plug Valve
- 7.1.6. Other Types
- 7.2. Market Analysis, Insights and Forecast - by Product
- 7.2.1. Quarter-turn Valve
- 7.2.2. Multi-turn Valve
- 7.2.3. Other Products
- 7.3. Market Analysis, Insights and Forecast - by Application
- 7.3.1. Power
- 7.3.2. Water and Wastewater Management
- 7.3.3. Chemicals
- 7.3.4. Oil and Gas
- 7.3.5. Other Ap
- 7.1. Market Analysis, Insights and Forecast - by Type
- 8. North America Industrial Valves Market Analysis, Insights and Forecast, 2020-2032
- 8.1. Market Analysis, Insights and Forecast - by Type
- 8.1.1. Butterfly Valve
- 8.1.2. Ball Valve
- 8.1.3. Globe Valve
- 8.1.4. Gate Valve
- 8.1.5. Plug Valve
- 8.1.6. Other Types
- 8.2. Market Analysis, Insights and Forecast - by Product
- 8.2.1. Quarter-turn Valve
- 8.2.2. Multi-turn Valve
- 8.2.3. Other Products
- 8.3. Market Analysis, Insights and Forecast - by Application
- 8.3.1. Power
- 8.3.2. Water and Wastewater Management
- 8.3.3. Chemicals
- 8.3.4. Oil and Gas
- 8.3.5. Other Ap
- 8.1. Market Analysis, Insights and Forecast - by Type
- 9. Europe Industrial Valves Market Analysis, Insights and Forecast, 2020-2032
- 9.1. Market Analysis, Insights and Forecast - by Type
- 9.1.1. Butterfly Valve
- 9.1.2. Ball Valve
- 9.1.3. Globe Valve
- 9.1.4. Gate Valve
- 9.1.5. Plug Valve
- 9.1.6. Other Types
- 9.2. Market Analysis, Insights and Forecast - by Product
- 9.2.1. Quarter-turn Valve
- 9.2.2. Multi-turn Valve
- 9.2.3. Other Products
- 9.3. Market Analysis, Insights and Forecast - by Application
- 9.3.1. Power
- 9.3.2. Water and Wastewater Management
- 9.3.3. Chemicals
- 9.3.4. Oil and Gas
- 9.3.5. Other Ap
- 9.1. Market Analysis, Insights and Forecast - by Type
- 10. South America Industrial Valves Market Analysis, Insights and Forecast, 2020-2032
- 10.1. Market Analysis, Insights and Forecast - by Type
- 10.1.1. Butterfly Valve
- 10.1.2. Ball Valve
- 10.1.3. Globe Valve
- 10.1.4. Gate Valve
- 10.1.5. Plug Valve
- 10.1.6. Other Types
- 10.2. Market Analysis, Insights and Forecast - by Product
- 10.2.1. Quarter-turn Valve
- 10.2.2. Multi-turn Valve
- 10.2.3. Other Products
- 10.3. Market Analysis, Insights and Forecast - by Application
- 10.3.1. Power
- 10.3.2. Water and Wastewater Management
- 10.3.3. Chemicals
- 10.3.4. Oil and Gas
- 10.3.5. Other Ap
- 10.1. Market Analysis, Insights and Forecast - by Type
- 11. Middle East and Africa Industrial Valves Market Analysis, Insights and Forecast, 2020-2032
- 11.1. Market Analysis, Insights and Forecast - by Type
- 11.1.1. Butterfly Valve
- 11.1.2. Ball Valve
- 11.1.3. Globe Valve
- 11.1.4. Gate Valve
- 11.1.5. Plug Valve
- 11.1.6. Other Types
- 11.2. Market Analysis, Insights and Forecast - by Product
- 11.2.1. Quarter-turn Valve
- 11.2.2. Multi-turn Valve
- 11.2.3. Other Products
- 11.3. Market Analysis, Insights and Forecast - by Application
- 11.3.1. Power
- 11.3.2. Water and Wastewater Management
- 11.3.3. Chemicals
- 11.3.4. Oil and Gas
- 11.3.5. Other Ap
- 11.1. Market Analysis, Insights and Forecast - by Type
- 12. Competitive Analysis
- 12.1. Company Profiles
- 12.1.1 Honeywell International Inc
- 12.1.1.1. Company Overview
- 12.1.1.2. Products
- 12.1.1.3. Company Financials
- 12.1.1.4. SWOT Analysis
- 12.1.2 Mueller Water Products Inc
- 12.1.2.1. Company Overview
- 12.1.2.2. Products
- 12.1.2.3. Company Financials
- 12.1.2.4. SWOT Analysis
- 12.1.3 Danfoss AS
- 12.1.3.1. Company Overview
- 12.1.3.2. Products
- 12.1.3.3. Company Financials
- 12.1.3.4. SWOT Analysis
- 12.1.4 Saint-Gobain
- 12.1.4.1. Company Overview
- 12.1.4.2. Products
- 12.1.4.3. Company Financials
- 12.1.4.4. SWOT Analysis
- 12.1.5 Okano Valve Mfg Co Ltd
- 12.1.5.1. Company Overview
- 12.1.5.2. Products
- 12.1.5.3. Company Financials
- 12.1.5.4. SWOT Analysis
- 12.1.6 ALFA LAVAL
- 12.1.6.1. Company Overview
- 12.1.6.2. Products
- 12.1.6.3. Company Financials
- 12.1.6.4. SWOT Analysis
- 12.1.7 Flowserve Corporation
- 12.1.7.1. Company Overview
- 12.1.7.2. Products
- 12.1.7.3. Company Financials
- 12.1.7.4. SWOT Analysis
- 12.1.8 The Weir Group PLC
- 12.1.8.1. Company Overview
- 12.1.8.2. Products
- 12.1.8.3. Company Financials
- 12.1.8.4. SWOT Analysis
- 12.1.9 Georg Fischer Ltd
- 12.1.9.1. Company Overview
- 12.1.9.2. Products
- 12.1.9.3. Company Financials
- 12.1.9.4. SWOT Analysis
- 12.1.10 NIBCO Inc
- 12.1.10.1. Company Overview
- 12.1.10.2. Products
- 12.1.10.3. Company Financials
- 12.1.10.4. SWOT Analysis
- 12.1.11 Baker Hughes
- 12.1.11.1. Company Overview
- 12.1.11.2. Products
- 12.1.11.3. Company Financials
- 12.1.11.4. SWOT Analysis
- 12.1.12 Hitachi Ltd
- 12.1.12.1. Company Overview
- 12.1.12.2. Products
- 12.1.12.3. Company Financials
- 12.1.12.4. SWOT Analysis
- 12.1.13 Xylem*List Not Exhaustive
- 12.1.13.1. Company Overview
- 12.1.13.2. Products
- 12.1.13.3. Company Financials
- 12.1.13.4. SWOT Analysis
- 12.1.14 Emerson Electric Co
- 12.1.14.1. Company Overview
- 12.1.14.2. Products
- 12.1.14.3. Company Financials
- 12.1.14.4. SWOT Analysis
- 12.1.15 Zhejiang Dunan Valve Co Ltd
- 12.1.15.1. Company Overview
- 12.1.15.2. Products
- 12.1.15.3. Company Financials
- 12.1.15.4. SWOT Analysis
- 12.1.16 CIRCOR International Inc
- 12.1.16.1. Company Overview
- 12.1.16.2. Products
- 12.1.16.3. Company Financials
- 12.1.16.4. SWOT Analysis
- 12.1.17 AVK Holding AS
- 12.1.17.1. Company Overview
- 12.1.17.2. Products
- 12.1.17.3. Company Financials
- 12.1.17.4. SWOT Analysis
- 12.1.18 ITT Inc
- 12.1.18.1. Company Overview
- 12.1.18.2. Products
- 12.1.18.3. Company Financials
- 12.1.18.4. SWOT Analysis
- 12.1.19 KLINGER Group
- 12.1.19.1. Company Overview
- 12.1.19.2. Products
- 12.1.19.3. Company Financials
- 12.1.19.4. SWOT Analysis
- 12.1.20 IMI
- 12.1.20.1. Company Overview
- 12.1.20.2. Products
- 12.1.20.3. Company Financials
- 12.1.20.4. SWOT Analysis
- 12.1.21 Crane Co
- 12.1.21.1. Company Overview
- 12.1.21.2. Products
- 12.1.21.3. Company Financials
- 12.1.21.4. SWOT Analysis
- 12.1.22 SLB
- 12.1.22.1. Company Overview
- 12.1.22.2. Products
- 12.1.22.3. Company Financials
- 12.1.22.4. SWOT Analysis
- 12.1.23 Valvitalia SpA
- 12.1.23.1. Company Overview
- 12.1.23.2. Products
- 12.1.23.3. Company Financials
- 12.1.23.4. SWOT Analysis
- 12.1.24 Curtiss-Wright Corporation
- 12.1.24.1. Company Overview
- 12.1.24.2. Products
- 12.1.24.3. Company Financials
- 12.1.24.4. SWOT Analysis
- 12.1.25 TechnipFMC PLC
- 12.1.25.1. Company Overview
- 12.1.25.2. Products
- 12.1.25.3. Company Financials
- 12.1.25.4. SWOT Analysis
- 12.1.26 KITZ Corporation
- 12.1.26.1. Company Overview
- 12.1.26.2. Products
- 12.1.26.3. Company Financials
- 12.1.26.4. SWOT Analysis
- 12.1.1 Honeywell International Inc
- 12.2. Market Entropy
- 12.2.1 Company's Key Areas Served
- 12.2.2 Recent Developments
- 12.3. Company Market Share Analysis 2025
- 12.3.1 Top 5 Companies Market Share Analysis
- 12.3.2 Top 3 Companies Market Share Analysis
- 12.4. List of Potential Customers
- 13. Research Methodology
List of Figures
- Figure 1: Global Industrial Valves Market Revenue Breakdown (Million, %) by Region 2025 & 2033
- Figure 2: Asia Pacific Industrial Valves Market Revenue (Million), by Type 2025 & 2033
- Figure 3: Asia Pacific Industrial Valves Market Revenue Share (%), by Type 2025 & 2033
- Figure 4: Asia Pacific Industrial Valves Market Revenue (Million), by Product 2025 & 2033
- Figure 5: Asia Pacific Industrial Valves Market Revenue Share (%), by Product 2025 & 2033
- Figure 6: Asia Pacific Industrial Valves Market Revenue (Million), by Application 2025 & 2033
- Figure 7: Asia Pacific Industrial Valves Market Revenue Share (%), by Application 2025 & 2033
- Figure 8: Asia Pacific Industrial Valves Market Revenue (Million), by Country 2025 & 2033
- Figure 9: Asia Pacific Industrial Valves Market Revenue Share (%), by Country 2025 & 2033
- Figure 10: North America Industrial Valves Market Revenue (Million), by Type 2025 & 2033
- Figure 11: North America Industrial Valves Market Revenue Share (%), by Type 2025 & 2033
- Figure 12: North America Industrial Valves Market Revenue (Million), by Product 2025 & 2033
- Figure 13: North America Industrial Valves Market Revenue Share (%), by Product 2025 & 2033
- Figure 14: North America Industrial Valves Market Revenue (Million), by Application 2025 & 2033
- Figure 15: North America Industrial Valves Market Revenue Share (%), by Application 2025 & 2033
- Figure 16: North America Industrial Valves Market Revenue (Million), by Country 2025 & 2033
- Figure 17: North America Industrial Valves Market Revenue Share (%), by Country 2025 & 2033
- Figure 18: Europe Industrial Valves Market Revenue (Million), by Type 2025 & 2033
- Figure 19: Europe Industrial Valves Market Revenue Share (%), by Type 2025 & 2033
- Figure 20: Europe Industrial Valves Market Revenue (Million), by Product 2025 & 2033
- Figure 21: Europe Industrial Valves Market Revenue Share (%), by Product 2025 & 2033
- Figure 22: Europe Industrial Valves Market Revenue (Million), by Application 2025 & 2033
- Figure 23: Europe Industrial Valves Market Revenue Share (%), by Application 2025 & 2033
- Figure 24: Europe Industrial Valves Market Revenue (Million), by Country 2025 & 2033
- Figure 25: Europe Industrial Valves Market Revenue Share (%), by Country 2025 & 2033
- Figure 26: South America Industrial Valves Market Revenue (Million), by Type 2025 & 2033
- Figure 27: South America Industrial Valves Market Revenue Share (%), by Type 2025 & 2033
- Figure 28: South America Industrial Valves Market Revenue (Million), by Product 2025 & 2033
- Figure 29: South America Industrial Valves Market Revenue Share (%), by Product 2025 & 2033
- Figure 30: South America Industrial Valves Market Revenue (Million), by Application 2025 & 2033
- Figure 31: South America Industrial Valves Market Revenue Share (%), by Application 2025 & 2033
- Figure 32: South America Industrial Valves Market Revenue (Million), by Country 2025 & 2033
- Figure 33: South America Industrial Valves Market Revenue Share (%), by Country 2025 & 2033
- Figure 34: Middle East and Africa Industrial Valves Market Revenue (Million), by Type 2025 & 2033
- Figure 35: Middle East and Africa Industrial Valves Market Revenue Share (%), by Type 2025 & 2033
- Figure 36: Middle East and Africa Industrial Valves Market Revenue (Million), by Product 2025 & 2033
- Figure 37: Middle East and Africa Industrial Valves Market Revenue Share (%), by Product 2025 & 2033
- Figure 38: Middle East and Africa Industrial Valves Market Revenue (Million), by Application 2025 & 2033
- Figure 39: Middle East and Africa Industrial Valves Market Revenue Share (%), by Application 2025 & 2033
- Figure 40: Middle East and Africa Industrial Valves Market Revenue (Million), by Country 2025 & 2033
- Figure 41: Middle East and Africa Industrial Valves Market Revenue Share (%), by Country 2025 & 2033
List of Tables
- Table 1: Global Industrial Valves Market Revenue Million Forecast, by Type 2020 & 2033
- Table 2: Global Industrial Valves Market Revenue Million Forecast, by Product 2020 & 2033
- Table 3: Global Industrial Valves Market Revenue Million Forecast, by Application 2020 & 2033
- Table 4: Global Industrial Valves Market Revenue Million Forecast, by Region 2020 & 2033
- Table 5: Global Industrial Valves Market Revenue Million Forecast, by Type 2020 & 2033
- Table 6: Global Industrial Valves Market Revenue Million Forecast, by Product 2020 & 2033
- Table 7: Global Industrial Valves Market Revenue Million Forecast, by Application 2020 & 2033
- Table 8: Global Industrial Valves Market Revenue Million Forecast, by Country 2020 & 2033
- Table 9: China Industrial Valves Market Revenue (Million) Forecast, by Application 2020 & 2033
- Table 10: India Industrial Valves Market Revenue (Million) Forecast, by Application 2020 & 2033
- Table 11: Japan Industrial Valves Market Revenue (Million) Forecast, by Application 2020 & 2033
- Table 12: South Korea Industrial Valves Market Revenue (Million) Forecast, by Application 2020 & 2033
- Table 13: Indonesia Industrial Valves Market Revenue (Million) Forecast, by Application 2020 & 2033
- Table 14: Vietnam Industrial Valves Market Revenue (Million) Forecast, by Application 2020 & 2033
- Table 15: Malaysia Industrial Valves Market Revenue (Million) Forecast, by Application 2020 & 2033
- Table 16: Thailand Industrial Valves Market Revenue (Million) Forecast, by Application 2020 & 2033
- Table 17: Rest of Asia Pacific Industrial Valves Market Revenue (Million) Forecast, by Application 2020 & 2033
- Table 18: Global Industrial Valves Market Revenue Million Forecast, by Type 2020 & 2033
- Table 19: Global Industrial Valves Market Revenue Million Forecast, by Product 2020 & 2033
- Table 20: Global Industrial Valves Market Revenue Million Forecast, by Application 2020 & 2033
- Table 21: Global Industrial Valves Market Revenue Million Forecast, by Country 2020 & 2033
- Table 22: United States Industrial Valves Market Revenue (Million) Forecast, by Application 2020 & 2033
- Table 23: Canada Industrial Valves Market Revenue (Million) Forecast, by Application 2020 & 2033
- Table 24: Mexico Industrial Valves Market Revenue (Million) Forecast, by Application 2020 & 2033
- Table 25: Global Industrial Valves Market Revenue Million Forecast, by Type 2020 & 2033
- Table 26: Global Industrial Valves Market Revenue Million Forecast, by Product 2020 & 2033
- Table 27: Global Industrial Valves Market Revenue Million Forecast, by Application 2020 & 2033
- Table 28: Global Industrial Valves Market Revenue Million Forecast, by Country 2020 & 2033
- Table 29: Germany Industrial Valves Market Revenue (Million) Forecast, by Application 2020 & 2033
- Table 30: United Kingdom Industrial Valves Market Revenue (Million) Forecast, by Application 2020 & 2033
- Table 31: Italy Industrial Valves Market Revenue (Million) Forecast, by Application 2020 & 2033
- Table 32: France Industrial Valves Market Revenue (Million) Forecast, by Application 2020 & 2033
- Table 33: NORDIC Industrial Valves Market Revenue (Million) Forecast, by Application 2020 & 2033
- Table 34: Turkey Industrial Valves Market Revenue (Million) Forecast, by Application 2020 & 2033
- Table 35: Russia Industrial Valves Market Revenue (Million) Forecast, by Application 2020 & 2033
- Table 36: Spain Industrial Valves Market Revenue (Million) Forecast, by Application 2020 & 2033
- Table 37: Rest of Europe Industrial Valves Market Revenue (Million) Forecast, by Application 2020 & 2033
- Table 38: Global Industrial Valves Market Revenue Million Forecast, by Type 2020 & 2033
- Table 39: Global Industrial Valves Market Revenue Million Forecast, by Product 2020 & 2033
- Table 40: Global Industrial Valves Market Revenue Million Forecast, by Application 2020 & 2033
- Table 41: Global Industrial Valves Market Revenue Million Forecast, by Country 2020 & 2033
- Table 42: Brazil Industrial Valves Market Revenue (Million) Forecast, by Application 2020 & 2033
- Table 43: Argentina Industrial Valves Market Revenue (Million) Forecast, by Application 2020 & 2033
- Table 44: Colombia Industrial Valves Market Revenue (Million) Forecast, by Application 2020 & 2033
- Table 45: Rest of South America Industrial Valves Market Revenue (Million) Forecast, by Application 2020 & 2033
- Table 46: Global Industrial Valves Market Revenue Million Forecast, by Type 2020 & 2033
- Table 47: Global Industrial Valves Market Revenue Million Forecast, by Product 2020 & 2033
- Table 48: Global Industrial Valves Market Revenue Million Forecast, by Application 2020 & 2033
- Table 49: Global Industrial Valves Market Revenue Million Forecast, by Country 2020 & 2033
- Table 50: Saudi Arabia Industrial Valves Market Revenue (Million) Forecast, by Application 2020 & 2033
- Table 51: South Africa Industrial Valves Market Revenue (Million) Forecast, by Application 2020 & 2033
- Table 52: United Arab Emirates Industrial Valves Market Revenue (Million) Forecast, by Application 2020 & 2033
- Table 53: Qatar Industrial Valves Market Revenue (Million) Forecast, by Application 2020 & 2033
- Table 54: Nigeria Industrial Valves Market Revenue (Million) Forecast, by Application 2020 & 2033
- Table 55: Egypt Industrial Valves Market Revenue (Million) Forecast, by Application 2020 & 2033
- Table 56: Rest of Middle East and Africa Industrial Valves Market Revenue (Million) Forecast, by Application 2020 & 2033
Frequently Asked Questions
1. What is the projected Compound Annual Growth Rate (CAGR) of the Industrial Valves Market?
The projected CAGR is approximately 4.52%.
2. Which companies are prominent players in the Industrial Valves Market?
Key companies in the market include Honeywell International Inc, Mueller Water Products Inc, Danfoss AS, Saint-Gobain, Okano Valve Mfg Co Ltd, ALFA LAVAL, Flowserve Corporation, The Weir Group PLC, Georg Fischer Ltd, NIBCO Inc, Baker Hughes, Hitachi Ltd, Xylem*List Not Exhaustive, Emerson Electric Co, Zhejiang Dunan Valve Co Ltd, CIRCOR International Inc, AVK Holding AS, ITT Inc, KLINGER Group, IMI, Crane Co, SLB, Valvitalia SpA, Curtiss-Wright Corporation, TechnipFMC PLC, KITZ Corporation.
3. What are the main segments of the Industrial Valves Market?
The market segments include Type, Product, Application.
4. Can you provide details about the market size?
The market size is estimated to be USD 70.97 Million as of 2022.
5. What are some drivers contributing to market growth?
Growing Demand from the Power and Chemical Industry; Increase in Demand for Desalination Activity.
6. What are the notable trends driving market growth?
Increasing Demand from the Power Industry.
7. Are there any restraints impacting market growth?
Stagnant Industrial Growth in Developed Countries; Other Restraints.
8. Can you provide examples of recent developments in the market?
September 2023: Danfoss India opened a new India distribution center in Chennai, India, that is spread over 43,000 square feet and has a 4,000 pallet position facility to support growth plans. This new distribution unit will likely aggregate Danfoss products from Asia, Europe, Latin America, and Denmark.
9. What pricing options are available for accessing the report?
Pricing options include single-user, multi-user, and enterprise licenses priced at USD 4750, USD 5250, and USD 8750 respectively.
10. Is the market size provided in terms of value or volume?
The market size is provided in terms of value, measured in Million.
11. Are there any specific market keywords associated with the report?
Yes, the market keyword associated with the report is "Industrial Valves Market," which aids in identifying and referencing the specific market segment covered.
12. How do I determine which pricing option suits my needs best?
The pricing options vary based on user requirements and access needs. Individual users may opt for single-user licenses, while businesses requiring broader access may choose multi-user or enterprise licenses for cost-effective access to the report.
13. Are there any additional resources or data provided in the Industrial Valves Market report?
While the report offers comprehensive insights, it's advisable to review the specific contents or supplementary materials provided to ascertain if additional resources or data are available.
14. How can I stay updated on further developments or reports in the Industrial Valves Market?
To stay informed about further developments, trends, and reports in the Industrial Valves Market, consider subscribing to industry newsletters, following relevant companies and organizations, or regularly checking reputable industry news sources and publications.
Methodology
Step 1 - Identification of Relevant Samples Size from Population Database


Step 2 - Approaches for Defining Global Market Size (Value, Volume* & Price*)

Note*: In applicable scenarios
Step 3 - Data Sources
Primary Research
- Web Analytics
- Survey Reports
- Research Institute
- Latest Research Reports
- Opinion Leaders
Secondary Research
- Annual Reports
- White Paper
- Latest Press Release
- Industry Association
- Paid Database
- Investor Presentations

Step 4 - Data Triangulation
Involves using different sources of information in order to increase the validity of a study
These sources are likely to be stakeholders in a program - participants, other researchers, program staff, other community members, and so on.
Then we put all data in single framework & apply various statistical tools to find out the dynamic on the market.
During the analysis stage, feedback from the stakeholder groups would be compared to determine areas of agreement as well as areas of divergence

