

Key Insights
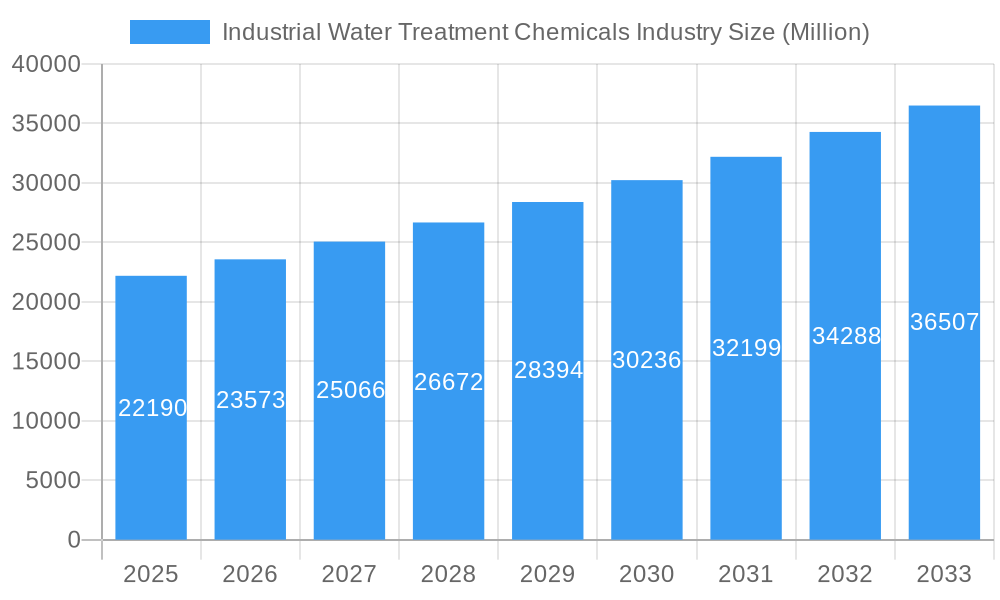
The global industrial water treatment chemicals market is experiencing robust growth, projected to reach \$22.19 billion in 2025 and maintain a Compound Annual Growth Rate (CAGR) of 6.04% from 2025 to 2033. This expansion is fueled by several key drivers. Stringent environmental regulations worldwide are pushing industries to adopt more efficient and sustainable water treatment solutions, reducing water waste and pollution. The rising demand for cleaner water in various industrial sectors, including power generation, manufacturing, and oil & gas, is another significant factor. Furthermore, advancements in water treatment technologies, such as membrane filtration and advanced oxidation processes, are creating new opportunities for chemical manufacturers. The increasing adoption of automation and digitalization in water treatment plants also contributes to market growth by optimizing chemical usage and improving efficiency. Competition among established players like BWA Water Additives, Chemifloc, Kemira, Kurita, Lenntech, Lonza, DuPont, Ecolab, SNF, Solenis, and Suez, is driving innovation and affordability.
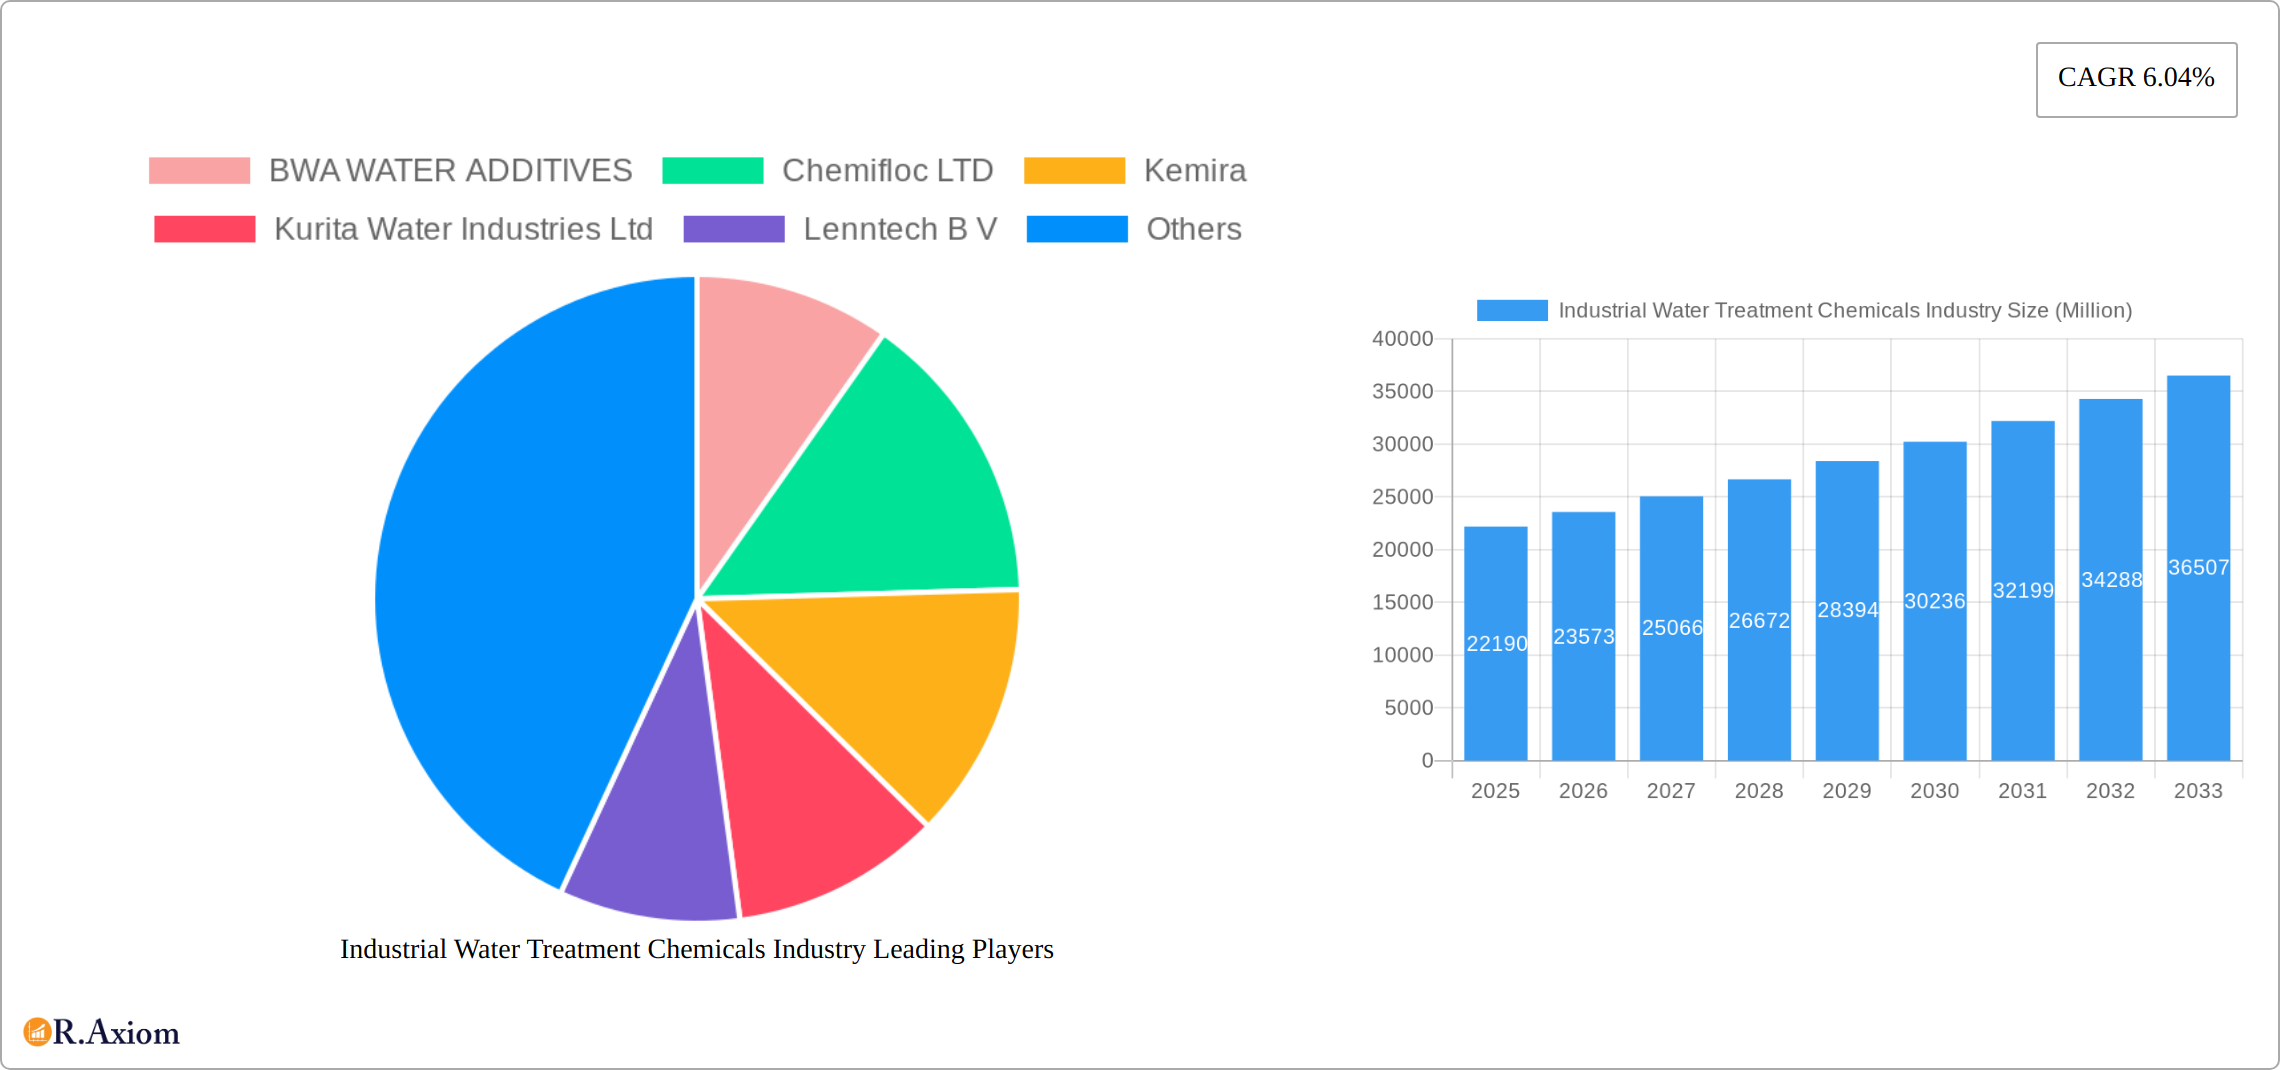
Industrial Water Treatment Chemicals Industry Market Size (In Billion)
However, the market faces certain restraints. Fluctuations in raw material prices and energy costs can impact profitability. The development and implementation of sustainable and eco-friendly water treatment chemicals are ongoing challenges that require continuous research and development investment. Economic downturns in specific industrial sectors can temporarily reduce demand for water treatment chemicals. Despite these challenges, the long-term outlook remains positive, driven by the escalating awareness of water scarcity and the growing need for sustainable water management across industries. The market is expected to witness a continued surge in demand for specialized chemicals tailored to specific industrial applications, leading to further market segmentation and product diversification.
Industrial Water Treatment Chemicals Industry Company Market Share
Industrial Water Treatment Chemicals Market: A Comprehensive Report (2019-2033)
This in-depth report provides a comprehensive analysis of the Industrial Water Treatment Chemicals market, offering invaluable insights for stakeholders, investors, and industry professionals. Covering the period 2019-2033, with a base year of 2025 and a forecast period of 2025-2033, this report unveils the market's dynamics, trends, and future potential. The report leverages extensive data analysis to provide actionable insights, including market size estimations (in Millions), CAGR projections, and competitive landscape assessments.
Industrial Water Treatment Chemicals Industry Market Concentration & Innovation
The industrial water treatment chemicals market exhibits a moderately concentrated landscape, with a few major players holding significant market share. Companies like Ecolab, Kemira, SNF, Solenis, and SUEZ collectively account for an estimated xx% of the global market in 2025. However, the presence of numerous smaller, specialized players fosters competition and innovation. Market share dynamics are influenced by factors such as M&A activities, technological advancements, and regulatory changes.
Innovation Drivers: The market is driven by the increasing demand for sustainable and efficient water treatment solutions. This fuels innovation in areas like:
- Development of eco-friendly chemicals with reduced environmental impact.
- Advanced water treatment technologies, including membrane filtration and advanced oxidation processes.
- Smart water management solutions incorporating IoT and AI for optimized water usage.
Regulatory Frameworks: Stringent environmental regulations globally are shaping the market, pushing companies to develop and adopt more sustainable solutions. Compliance costs and the need for regulatory approvals influence market entry and product development strategies.
Product Substitutes: While traditional chemical-based treatments dominate, alternative technologies like membrane filtration and biological treatment are emerging as substitutes, presenting both opportunities and challenges for established players.
End-User Trends: The increasing awareness of water scarcity and its impact on industrial processes drives demand for efficient water treatment. Industries like power generation, manufacturing, and oil & gas are major end-users, influencing market demand patterns.
M&A Activities: Recent significant mergers and acquisitions, such as Solenis's USD 4.6 billion acquisition of Diversey (March 2023) and Shrieve Chemical's acquisition of Chem One (January 2023), highlight the industry's consolidation and expansion trends. These deals, totaling an estimated xx Million USD, significantly impacted market share and competitive dynamics.
Industrial Water Treatment Chemicals Industry Industry Trends & Insights
The industrial water treatment chemicals market is experiencing robust growth, propelled by several converging factors. The global market is projected to achieve a significant CAGR of [Insert Updated CAGR]% during the forecast period (2025-2033), reaching an estimated [Insert Updated Market Value] Million by 2033. This expansion is fueled by a confluence of drivers: the escalating demand for cleaner water across diverse industrial sectors, increasingly stringent environmental regulations mandating improved water quality, and continuous technological advancements yielding more efficient and sustainable solutions. The burgeoning industrialization, particularly within rapidly developing economies, significantly contributes to market expansion. While market penetration is currently highest in developed regions, emerging markets are exhibiting rapid growth, presenting substantial untapped potential. Furthermore, transformative technological disruptions, such as the integration of Artificial Intelligence (AI) and the Internet of Things (IoT) in water treatment processes, are accelerating market growth by enabling optimized water management and predictive maintenance. A growing consumer preference for sustainable and eco-friendly solutions is also influencing product development and marketing strategies, driving innovation towards greener alternatives. Finally, the dynamic competitive landscape, characterized by both established players and new entrants, fosters innovation and price competitiveness, ultimately benefiting end-users.
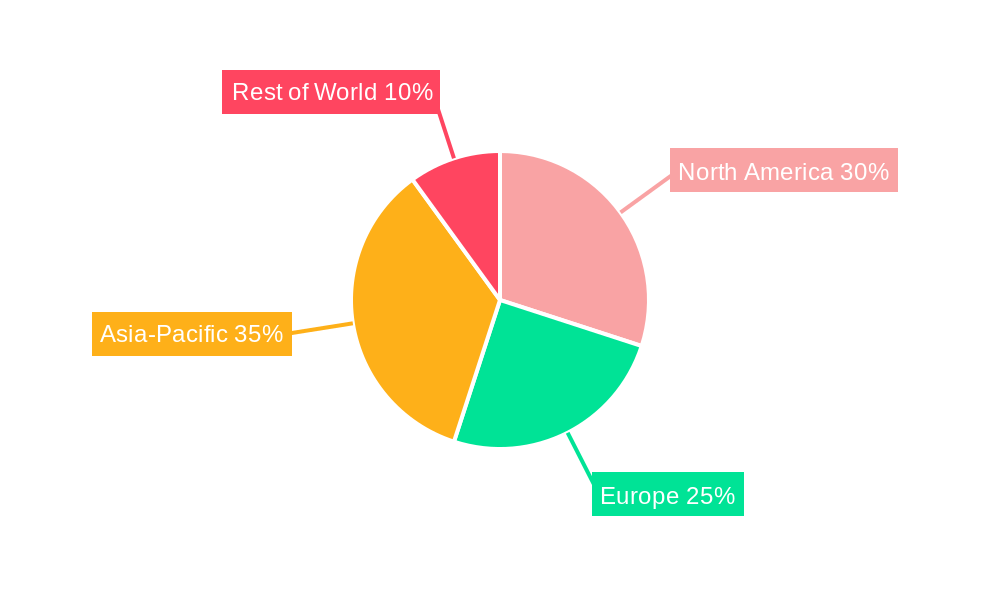
Dominant Markets & Segments in Industrial Water Treatment Chemicals Industry
The Asia-Pacific region is currently the dominant market for industrial water treatment chemicals, accounting for an estimated xx% of the global market share in 2025. This dominance is primarily driven by:
- Rapid industrialization and urbanization in countries like China and India.
- Significant investments in infrastructure development, including water treatment facilities.
- Favorable government policies and initiatives promoting water conservation and sustainable practices.
Key Drivers in Asia-Pacific:
- Growing industrial sectors, such as manufacturing and energy.
- Expanding infrastructure projects, increasing demand for water treatment solutions.
- Government support for water resource management and environmental protection.
While the Asia-Pacific region leads, North America and Europe also hold significant market shares, driven by robust industrial activity and stringent environmental regulations. Market segmentation based on chemical type (coagulants, flocculants, etc.), application (cooling water, boiler water, etc.), and end-user industry (power, manufacturing, etc.) further refines market analysis.
Industrial Water Treatment Chemicals Industry Product Developments
Recent product innovations are characterized by a focus on developing high-performance, eco-friendly chemicals that offer enhanced efficiency and a significantly reduced environmental footprint. These advancements encompass the introduction of bio-based coagulants and flocculants, the implementation of sophisticated advanced oxidation processes (AOPs), and the widespread adoption of advanced membrane filtration technologies. Companies are increasingly developing customized solutions tailored to meet the specific needs of individual industrial sectors and comply with evolving regulatory requirements. These innovations provide significant competitive advantages by improving treatment efficiency, reducing operational costs, minimizing waste generation, and enhancing overall environmental sustainability. The market is witnessing a pronounced shift towards digitally enabled water treatment solutions leveraging IoT and AI for optimized water management, predictive maintenance, and real-time process control.
Report Scope & Segmentation Analysis
This report provides a comprehensive segmentation of the industrial water treatment chemicals market based on:
Chemical Type: Coagulants, flocculants, biocides (including advanced biocides), scale inhibitors, corrosion inhibitors, and other specialized chemicals. The growth trajectory of each segment is influenced by specific application needs and the pace of technological advancements. For instance, the biocides segment is experiencing robust growth driven by heightened concerns about waterborne pathogens and stricter regulations regarding their control.
Application: Cooling water treatment (including closed-loop systems), boiler water treatment (high-pressure and low-pressure systems), wastewater treatment (municipal and industrial), and other specialized applications. Growth in each application segment is directly correlated with the expansion of specific end-user industries. The cooling water treatment segment, for example, is propelled by growth in the power generation and manufacturing sectors.
End-User Industry: Power generation (thermal and renewable), manufacturing (various sub-sectors), oil & gas (upstream, midstream, and downstream), mining (various mineral extraction processes), and other industries with significant water treatment needs. The growth within each industry segment is influenced by economic conditions, overall industrial activity levels, and the stringency of environmental regulations.
The report meticulously details each segment's market size, growth projections, competitive landscape, and key players.
Key Drivers of Industrial Water Treatment Chemicals Industry Growth
The market's robust growth is attributed to a convergence of several key factors:
- Stringent Environmental Regulations and Compliance Costs: Governments worldwide are implementing increasingly stringent regulations to mitigate water pollution and promote sustainable water management practices. Compliance with these regulations drives demand for advanced water treatment chemicals and technologies.
- Rising Industrialization and Urbanization: Rapid industrialization and urbanization, particularly in developing economies, significantly increase the demand for reliable and efficient water treatment solutions across a broad range of industries.
- Technological Advancements and Innovation: Continuous innovations in water treatment technologies, including advanced membrane filtration (e.g., reverse osmosis, nanofiltration), advanced oxidation processes (AOPs), and the integration of AI and IoT, enhance efficiency, reduce costs, and improve overall water quality, thus driving market growth.
- Water Scarcity and Resource Management: Growing water scarcity in numerous regions is highlighting the critical need for efficient water treatment, reuse, and recycling, thereby boosting market demand for effective solutions.
- Increased Focus on Sustainability and ESG Goals: A growing emphasis on environmental, social, and governance (ESG) factors is pushing companies to adopt more sustainable water treatment practices, leading to higher adoption of eco-friendly chemicals.
Challenges in the Industrial Water Treatment Chemicals Industry Sector
The industry faces several challenges, including:
- Fluctuating raw material prices: The cost of raw materials used in manufacturing water treatment chemicals can significantly impact profitability.
- Stringent regulatory compliance: Meeting stringent environmental regulations and obtaining necessary approvals can be complex and expensive.
- Intense competition: The market is highly competitive, with numerous established and emerging players vying for market share.
Emerging Opportunities in Industrial Water Treatment Chemicals Industry
Emerging opportunities include:
- Growth in developing economies: Expanding industrialization in developing countries presents significant growth potential.
- Demand for sustainable solutions: The increasing focus on sustainability creates opportunities for eco-friendly water treatment chemicals.
- Technological advancements: The integration of IoT and AI in water treatment systems opens new avenues for optimization and efficiency gains.
Leading Players in the Industrial Water Treatment Chemicals Industry Market
- BWA WATER ADDITIVES
- Chemifloc LTD
- Kemira
- Kurita Water Industries Ltd
- Lenntech B V
- Lonza
- DuPont de Nemours Inc
- Ecolab
- SNF
- Solenis
- SUEZ
- *List Not Exhaustive
Key Developments in Industrial Water Treatment Chemicals Industry Industry
- March 2023: Solenis' acquisition of Diversey for USD 4.6 Billion significantly expanded its market presence and product portfolio in the industrial water treatment sector, reshaping the competitive landscape.
- January 2023: Shrieve Chemical Company's acquisition of Chem One strengthened its distribution network for dry chemicals used in various industrial applications, including water treatment, enhancing market reach and service capabilities.
- [Add more recent key developments with dates and brief descriptions]
Strategic Outlook for Industrial Water Treatment Chemicals Industry Market
The industrial water treatment chemicals market is poised for continued growth driven by increasing industrialization, stringent environmental regulations, and technological advancements. The demand for sustainable and efficient water treatment solutions will be a major growth catalyst. Companies focusing on innovation, sustainable product development, and strategic acquisitions are expected to gain a competitive edge in this dynamic market. Expansion into emerging markets and strategic partnerships will be crucial for future success.
Industrial Water Treatment Chemicals Industry Segmentation
-
1. Product Type
- 1.1. Antifoams
- 1.2. Oxygen Scavengers
- 1.3. Corrosion Inhibitors
- 1.4. Biocides and Disinfactants
- 1.5. Oxidants
- 1.6. pH Conditioners
- 1.7. Sludge Conditioners
- 1.8. Scale inhibitors
- 1.9. Other Product Types
-
2. End-user Industry
- 2.1. Oil and Gas
- 2.2. Power
- 2.3. Paper
- 2.4. Metal and mining
- 2.5. Chemical
- 2.6. Other End-user Industries
Industrial Water Treatment Chemicals Industry Segmentation By Geography
-
1. North America
- 1.1. United States
- 1.2. Mexico
- 1.3. Canada
-
2. Europe
- 2.1. Germany
- 2.2. United Kingdom
- 2.3. France
- 2.4. Italy
- 2.5. Rest of Europe
-
3. Asia Pacific
- 3.1. China
- 3.2. India
- 3.3. Japan
- 3.4. South Korea
- 3.5. Rest of Asia Pacific
-
4. South America
- 4.1. Brazil
- 4.2. Argentina
- 4.3. Rest of South America
-
5. Middle East and Africa
- 5.1. Saudi Arabia
- 5.2. South Africa
- 5.3. United Arab Emirates
- 5.4. Rest of Middle East and Africa
Industrial Water Treatment Chemicals Industry Regional Market Share
Geographic Coverage of Industrial Water Treatment Chemicals Industry
Industrial Water Treatment Chemicals Industry REPORT HIGHLIGHTS
| Aspects | Details |
|---|---|
| Study Period | 2020-2034 |
| Base Year | 2025 |
| Estimated Year | 2026 |
| Forecast Period | 2026-2034 |
| Historical Period | 2020-2025 |
| Growth Rate | CAGR of 6.04% from 2020-2034 |
| Segmentation |
|
Table of Contents
- 1. Introduction
- 1.1. Research Scope
- 1.2. Market Segmentation
- 1.3. Research Objective
- 1.4. Definitions and Assumptions
- 2. Executive Summary
- 2.1. Market Snapshot
- 3. Market Dynamics
- 3.1. Market Drivers
- 3.2. Market Restrains
- 3.3. Market Trends
- 3.4. Market Opportunities
- 4. Market Factor Analysis
- 4.1. Porters Five Forces
- 4.1.1. Bargaining Power of Suppliers
- 4.1.2. Bargaining Power of Buyers
- 4.1.3. Threat of New Entrants
- 4.1.4. Threat of Substitutes
- 4.1.5. Competitive Rivalry
- 4.2. PESTEL analysis
- 4.3. BCG Analysis
- 4.3.1. Stars (High Growth, High Market Share)
- 4.3.2. Cash Cows (Low Growth, High Market Share)
- 4.3.3. Question Mark (High Growth, Low Market Share)
- 4.3.4. Dogs (Low Growth, Low Market Share)
- 4.4. Ansoff Matrix Analysis
- 4.5. Supply Chain Analysis
- 4.6. Regulatory Landscape
- 4.7. Current Market Potential and Opportunity Assessment (TAM–SAM–SOM Framework)
- 4.8. RAX Analyst Note
- 4.1. Porters Five Forces
- 5. Market Analysis, Insights and Forecast 2021-2033
- 5.1. Market Analysis, Insights and Forecast - by Product Type
- 5.1.1. Antifoams
- 5.1.2. Oxygen Scavengers
- 5.1.3. Corrosion Inhibitors
- 5.1.4. Biocides and Disinfactants
- 5.1.5. Oxidants
- 5.1.6. pH Conditioners
- 5.1.7. Sludge Conditioners
- 5.1.8. Scale inhibitors
- 5.1.9. Other Product Types
- 5.2. Market Analysis, Insights and Forecast - by End-user Industry
- 5.2.1. Oil and Gas
- 5.2.2. Power
- 5.2.3. Paper
- 5.2.4. Metal and mining
- 5.2.5. Chemical
- 5.2.6. Other End-user Industries
- 5.3. Market Analysis, Insights and Forecast - by Region
- 5.3.1. North America
- 5.3.2. Europe
- 5.3.3. Asia Pacific
- 5.3.4. South America
- 5.3.5. Middle East and Africa
- 5.1. Market Analysis, Insights and Forecast - by Product Type
- 6. Global Industrial Water Treatment Chemicals Industry Analysis, Insights and Forecast, 2021-2033
- 6.1. Market Analysis, Insights and Forecast - by Product Type
- 6.1.1. Antifoams
- 6.1.2. Oxygen Scavengers
- 6.1.3. Corrosion Inhibitors
- 6.1.4. Biocides and Disinfactants
- 6.1.5. Oxidants
- 6.1.6. pH Conditioners
- 6.1.7. Sludge Conditioners
- 6.1.8. Scale inhibitors
- 6.1.9. Other Product Types
- 6.2. Market Analysis, Insights and Forecast - by End-user Industry
- 6.2.1. Oil and Gas
- 6.2.2. Power
- 6.2.3. Paper
- 6.2.4. Metal and mining
- 6.2.5. Chemical
- 6.2.6. Other End-user Industries
- 6.1. Market Analysis, Insights and Forecast - by Product Type
- 7. North America Industrial Water Treatment Chemicals Industry Analysis, Insights and Forecast, 2020-2032
- 7.1. Market Analysis, Insights and Forecast - by Product Type
- 7.1.1. Antifoams
- 7.1.2. Oxygen Scavengers
- 7.1.3. Corrosion Inhibitors
- 7.1.4. Biocides and Disinfactants
- 7.1.5. Oxidants
- 7.1.6. pH Conditioners
- 7.1.7. Sludge Conditioners
- 7.1.8. Scale inhibitors
- 7.1.9. Other Product Types
- 7.2. Market Analysis, Insights and Forecast - by End-user Industry
- 7.2.1. Oil and Gas
- 7.2.2. Power
- 7.2.3. Paper
- 7.2.4. Metal and mining
- 7.2.5. Chemical
- 7.2.6. Other End-user Industries
- 7.1. Market Analysis, Insights and Forecast - by Product Type
- 8. Europe Industrial Water Treatment Chemicals Industry Analysis, Insights and Forecast, 2020-2032
- 8.1. Market Analysis, Insights and Forecast - by Product Type
- 8.1.1. Antifoams
- 8.1.2. Oxygen Scavengers
- 8.1.3. Corrosion Inhibitors
- 8.1.4. Biocides and Disinfactants
- 8.1.5. Oxidants
- 8.1.6. pH Conditioners
- 8.1.7. Sludge Conditioners
- 8.1.8. Scale inhibitors
- 8.1.9. Other Product Types
- 8.2. Market Analysis, Insights and Forecast - by End-user Industry
- 8.2.1. Oil and Gas
- 8.2.2. Power
- 8.2.3. Paper
- 8.2.4. Metal and mining
- 8.2.5. Chemical
- 8.2.6. Other End-user Industries
- 8.1. Market Analysis, Insights and Forecast - by Product Type
- 9. Asia Pacific Industrial Water Treatment Chemicals Industry Analysis, Insights and Forecast, 2020-2032
- 9.1. Market Analysis, Insights and Forecast - by Product Type
- 9.1.1. Antifoams
- 9.1.2. Oxygen Scavengers
- 9.1.3. Corrosion Inhibitors
- 9.1.4. Biocides and Disinfactants
- 9.1.5. Oxidants
- 9.1.6. pH Conditioners
- 9.1.7. Sludge Conditioners
- 9.1.8. Scale inhibitors
- 9.1.9. Other Product Types
- 9.2. Market Analysis, Insights and Forecast - by End-user Industry
- 9.2.1. Oil and Gas
- 9.2.2. Power
- 9.2.3. Paper
- 9.2.4. Metal and mining
- 9.2.5. Chemical
- 9.2.6. Other End-user Industries
- 9.1. Market Analysis, Insights and Forecast - by Product Type
- 10. South America Industrial Water Treatment Chemicals Industry Analysis, Insights and Forecast, 2020-2032
- 10.1. Market Analysis, Insights and Forecast - by Product Type
- 10.1.1. Antifoams
- 10.1.2. Oxygen Scavengers
- 10.1.3. Corrosion Inhibitors
- 10.1.4. Biocides and Disinfactants
- 10.1.5. Oxidants
- 10.1.6. pH Conditioners
- 10.1.7. Sludge Conditioners
- 10.1.8. Scale inhibitors
- 10.1.9. Other Product Types
- 10.2. Market Analysis, Insights and Forecast - by End-user Industry
- 10.2.1. Oil and Gas
- 10.2.2. Power
- 10.2.3. Paper
- 10.2.4. Metal and mining
- 10.2.5. Chemical
- 10.2.6. Other End-user Industries
- 10.1. Market Analysis, Insights and Forecast - by Product Type
- 11. Middle East and Africa Industrial Water Treatment Chemicals Industry Analysis, Insights and Forecast, 2020-2032
- 11.1. Market Analysis, Insights and Forecast - by Product Type
- 11.1.1. Antifoams
- 11.1.2. Oxygen Scavengers
- 11.1.3. Corrosion Inhibitors
- 11.1.4. Biocides and Disinfactants
- 11.1.5. Oxidants
- 11.1.6. pH Conditioners
- 11.1.7. Sludge Conditioners
- 11.1.8. Scale inhibitors
- 11.1.9. Other Product Types
- 11.2. Market Analysis, Insights and Forecast - by End-user Industry
- 11.2.1. Oil and Gas
- 11.2.2. Power
- 11.2.3. Paper
- 11.2.4. Metal and mining
- 11.2.5. Chemical
- 11.2.6. Other End-user Industries
- 11.1. Market Analysis, Insights and Forecast - by Product Type
- 12. Competitive Analysis
- 12.1. Company Profiles
- 12.1.1 BWA WATER ADDITIVES
- 12.1.1.1. Company Overview
- 12.1.1.2. Products
- 12.1.1.3. Company Financials
- 12.1.1.4. SWOT Analysis
- 12.1.2 Chemifloc LTD
- 12.1.2.1. Company Overview
- 12.1.2.2. Products
- 12.1.2.3. Company Financials
- 12.1.2.4. SWOT Analysis
- 12.1.3 Kemira
- 12.1.3.1. Company Overview
- 12.1.3.2. Products
- 12.1.3.3. Company Financials
- 12.1.3.4. SWOT Analysis
- 12.1.4 Kurita Water Industries Ltd
- 12.1.4.1. Company Overview
- 12.1.4.2. Products
- 12.1.4.3. Company Financials
- 12.1.4.4. SWOT Analysis
- 12.1.5 Lenntech B V
- 12.1.5.1. Company Overview
- 12.1.5.2. Products
- 12.1.5.3. Company Financials
- 12.1.5.4. SWOT Analysis
- 12.1.6 Lonza
- 12.1.6.1. Company Overview
- 12.1.6.2. Products
- 12.1.6.3. Company Financials
- 12.1.6.4. SWOT Analysis
- 12.1.7 DuPont de Nemours Inc
- 12.1.7.1. Company Overview
- 12.1.7.2. Products
- 12.1.7.3. Company Financials
- 12.1.7.4. SWOT Analysis
- 12.1.8 Ecolab
- 12.1.8.1. Company Overview
- 12.1.8.2. Products
- 12.1.8.3. Company Financials
- 12.1.8.4. SWOT Analysis
- 12.1.9 SNF
- 12.1.9.1. Company Overview
- 12.1.9.2. Products
- 12.1.9.3. Company Financials
- 12.1.9.4. SWOT Analysis
- 12.1.10 Solenis
- 12.1.10.1. Company Overview
- 12.1.10.2. Products
- 12.1.10.3. Company Financials
- 12.1.10.4. SWOT Analysis
- 12.1.11 SUEZ*List Not Exhaustive
- 12.1.11.1. Company Overview
- 12.1.11.2. Products
- 12.1.11.3. Company Financials
- 12.1.11.4. SWOT Analysis
- 12.1.1 BWA WATER ADDITIVES
- 12.2. Market Entropy
- 12.2.1 Company's Key Areas Served
- 12.2.2 Recent Developments
- 12.3. Company Market Share Analysis 2025
- 12.3.1 Top 5 Companies Market Share Analysis
- 12.3.2 Top 3 Companies Market Share Analysis
- 12.4. List of Potential Customers
- 13. Research Methodology
List of Figures
- Figure 1: Global Industrial Water Treatment Chemicals Industry Revenue Breakdown (Million, %) by Region 2025 & 2033
- Figure 2: Global Industrial Water Treatment Chemicals Industry Volume Breakdown (Billion, %) by Region 2025 & 2033
- Figure 3: North America Industrial Water Treatment Chemicals Industry Revenue (Million), by Product Type 2025 & 2033
- Figure 4: North America Industrial Water Treatment Chemicals Industry Volume (Billion), by Product Type 2025 & 2033
- Figure 5: North America Industrial Water Treatment Chemicals Industry Revenue Share (%), by Product Type 2025 & 2033
- Figure 6: North America Industrial Water Treatment Chemicals Industry Volume Share (%), by Product Type 2025 & 2033
- Figure 7: North America Industrial Water Treatment Chemicals Industry Revenue (Million), by End-user Industry 2025 & 2033
- Figure 8: North America Industrial Water Treatment Chemicals Industry Volume (Billion), by End-user Industry 2025 & 2033
- Figure 9: North America Industrial Water Treatment Chemicals Industry Revenue Share (%), by End-user Industry 2025 & 2033
- Figure 10: North America Industrial Water Treatment Chemicals Industry Volume Share (%), by End-user Industry 2025 & 2033
- Figure 11: North America Industrial Water Treatment Chemicals Industry Revenue (Million), by Country 2025 & 2033
- Figure 12: North America Industrial Water Treatment Chemicals Industry Volume (Billion), by Country 2025 & 2033
- Figure 13: North America Industrial Water Treatment Chemicals Industry Revenue Share (%), by Country 2025 & 2033
- Figure 14: North America Industrial Water Treatment Chemicals Industry Volume Share (%), by Country 2025 & 2033
- Figure 15: Europe Industrial Water Treatment Chemicals Industry Revenue (Million), by Product Type 2025 & 2033
- Figure 16: Europe Industrial Water Treatment Chemicals Industry Volume (Billion), by Product Type 2025 & 2033
- Figure 17: Europe Industrial Water Treatment Chemicals Industry Revenue Share (%), by Product Type 2025 & 2033
- Figure 18: Europe Industrial Water Treatment Chemicals Industry Volume Share (%), by Product Type 2025 & 2033
- Figure 19: Europe Industrial Water Treatment Chemicals Industry Revenue (Million), by End-user Industry 2025 & 2033
- Figure 20: Europe Industrial Water Treatment Chemicals Industry Volume (Billion), by End-user Industry 2025 & 2033
- Figure 21: Europe Industrial Water Treatment Chemicals Industry Revenue Share (%), by End-user Industry 2025 & 2033
- Figure 22: Europe Industrial Water Treatment Chemicals Industry Volume Share (%), by End-user Industry 2025 & 2033
- Figure 23: Europe Industrial Water Treatment Chemicals Industry Revenue (Million), by Country 2025 & 2033
- Figure 24: Europe Industrial Water Treatment Chemicals Industry Volume (Billion), by Country 2025 & 2033
- Figure 25: Europe Industrial Water Treatment Chemicals Industry Revenue Share (%), by Country 2025 & 2033
- Figure 26: Europe Industrial Water Treatment Chemicals Industry Volume Share (%), by Country 2025 & 2033
- Figure 27: Asia Pacific Industrial Water Treatment Chemicals Industry Revenue (Million), by Product Type 2025 & 2033
- Figure 28: Asia Pacific Industrial Water Treatment Chemicals Industry Volume (Billion), by Product Type 2025 & 2033
- Figure 29: Asia Pacific Industrial Water Treatment Chemicals Industry Revenue Share (%), by Product Type 2025 & 2033
- Figure 30: Asia Pacific Industrial Water Treatment Chemicals Industry Volume Share (%), by Product Type 2025 & 2033
- Figure 31: Asia Pacific Industrial Water Treatment Chemicals Industry Revenue (Million), by End-user Industry 2025 & 2033
- Figure 32: Asia Pacific Industrial Water Treatment Chemicals Industry Volume (Billion), by End-user Industry 2025 & 2033
- Figure 33: Asia Pacific Industrial Water Treatment Chemicals Industry Revenue Share (%), by End-user Industry 2025 & 2033
- Figure 34: Asia Pacific Industrial Water Treatment Chemicals Industry Volume Share (%), by End-user Industry 2025 & 2033
- Figure 35: Asia Pacific Industrial Water Treatment Chemicals Industry Revenue (Million), by Country 2025 & 2033
- Figure 36: Asia Pacific Industrial Water Treatment Chemicals Industry Volume (Billion), by Country 2025 & 2033
- Figure 37: Asia Pacific Industrial Water Treatment Chemicals Industry Revenue Share (%), by Country 2025 & 2033
- Figure 38: Asia Pacific Industrial Water Treatment Chemicals Industry Volume Share (%), by Country 2025 & 2033
- Figure 39: South America Industrial Water Treatment Chemicals Industry Revenue (Million), by Product Type 2025 & 2033
- Figure 40: South America Industrial Water Treatment Chemicals Industry Volume (Billion), by Product Type 2025 & 2033
- Figure 41: South America Industrial Water Treatment Chemicals Industry Revenue Share (%), by Product Type 2025 & 2033
- Figure 42: South America Industrial Water Treatment Chemicals Industry Volume Share (%), by Product Type 2025 & 2033
- Figure 43: South America Industrial Water Treatment Chemicals Industry Revenue (Million), by End-user Industry 2025 & 2033
- Figure 44: South America Industrial Water Treatment Chemicals Industry Volume (Billion), by End-user Industry 2025 & 2033
- Figure 45: South America Industrial Water Treatment Chemicals Industry Revenue Share (%), by End-user Industry 2025 & 2033
- Figure 46: South America Industrial Water Treatment Chemicals Industry Volume Share (%), by End-user Industry 2025 & 2033
- Figure 47: South America Industrial Water Treatment Chemicals Industry Revenue (Million), by Country 2025 & 2033
- Figure 48: South America Industrial Water Treatment Chemicals Industry Volume (Billion), by Country 2025 & 2033
- Figure 49: South America Industrial Water Treatment Chemicals Industry Revenue Share (%), by Country 2025 & 2033
- Figure 50: South America Industrial Water Treatment Chemicals Industry Volume Share (%), by Country 2025 & 2033
- Figure 51: Middle East and Africa Industrial Water Treatment Chemicals Industry Revenue (Million), by Product Type 2025 & 2033
- Figure 52: Middle East and Africa Industrial Water Treatment Chemicals Industry Volume (Billion), by Product Type 2025 & 2033
- Figure 53: Middle East and Africa Industrial Water Treatment Chemicals Industry Revenue Share (%), by Product Type 2025 & 2033
- Figure 54: Middle East and Africa Industrial Water Treatment Chemicals Industry Volume Share (%), by Product Type 2025 & 2033
- Figure 55: Middle East and Africa Industrial Water Treatment Chemicals Industry Revenue (Million), by End-user Industry 2025 & 2033
- Figure 56: Middle East and Africa Industrial Water Treatment Chemicals Industry Volume (Billion), by End-user Industry 2025 & 2033
- Figure 57: Middle East and Africa Industrial Water Treatment Chemicals Industry Revenue Share (%), by End-user Industry 2025 & 2033
- Figure 58: Middle East and Africa Industrial Water Treatment Chemicals Industry Volume Share (%), by End-user Industry 2025 & 2033
- Figure 59: Middle East and Africa Industrial Water Treatment Chemicals Industry Revenue (Million), by Country 2025 & 2033
- Figure 60: Middle East and Africa Industrial Water Treatment Chemicals Industry Volume (Billion), by Country 2025 & 2033
- Figure 61: Middle East and Africa Industrial Water Treatment Chemicals Industry Revenue Share (%), by Country 2025 & 2033
- Figure 62: Middle East and Africa Industrial Water Treatment Chemicals Industry Volume Share (%), by Country 2025 & 2033
List of Tables
- Table 1: Global Industrial Water Treatment Chemicals Industry Revenue Million Forecast, by Product Type 2020 & 2033
- Table 2: Global Industrial Water Treatment Chemicals Industry Volume Billion Forecast, by Product Type 2020 & 2033
- Table 3: Global Industrial Water Treatment Chemicals Industry Revenue Million Forecast, by End-user Industry 2020 & 2033
- Table 4: Global Industrial Water Treatment Chemicals Industry Volume Billion Forecast, by End-user Industry 2020 & 2033
- Table 5: Global Industrial Water Treatment Chemicals Industry Revenue Million Forecast, by Region 2020 & 2033
- Table 6: Global Industrial Water Treatment Chemicals Industry Volume Billion Forecast, by Region 2020 & 2033
- Table 7: Global Industrial Water Treatment Chemicals Industry Revenue Million Forecast, by Product Type 2020 & 2033
- Table 8: Global Industrial Water Treatment Chemicals Industry Volume Billion Forecast, by Product Type 2020 & 2033
- Table 9: Global Industrial Water Treatment Chemicals Industry Revenue Million Forecast, by End-user Industry 2020 & 2033
- Table 10: Global Industrial Water Treatment Chemicals Industry Volume Billion Forecast, by End-user Industry 2020 & 2033
- Table 11: Global Industrial Water Treatment Chemicals Industry Revenue Million Forecast, by Country 2020 & 2033
- Table 12: Global Industrial Water Treatment Chemicals Industry Volume Billion Forecast, by Country 2020 & 2033
- Table 13: United States Industrial Water Treatment Chemicals Industry Revenue (Million) Forecast, by Application 2020 & 2033
- Table 14: United States Industrial Water Treatment Chemicals Industry Volume (Billion) Forecast, by Application 2020 & 2033
- Table 15: Mexico Industrial Water Treatment Chemicals Industry Revenue (Million) Forecast, by Application 2020 & 2033
- Table 16: Mexico Industrial Water Treatment Chemicals Industry Volume (Billion) Forecast, by Application 2020 & 2033
- Table 17: Canada Industrial Water Treatment Chemicals Industry Revenue (Million) Forecast, by Application 2020 & 2033
- Table 18: Canada Industrial Water Treatment Chemicals Industry Volume (Billion) Forecast, by Application 2020 & 2033
- Table 19: Global Industrial Water Treatment Chemicals Industry Revenue Million Forecast, by Product Type 2020 & 2033
- Table 20: Global Industrial Water Treatment Chemicals Industry Volume Billion Forecast, by Product Type 2020 & 2033
- Table 21: Global Industrial Water Treatment Chemicals Industry Revenue Million Forecast, by End-user Industry 2020 & 2033
- Table 22: Global Industrial Water Treatment Chemicals Industry Volume Billion Forecast, by End-user Industry 2020 & 2033
- Table 23: Global Industrial Water Treatment Chemicals Industry Revenue Million Forecast, by Country 2020 & 2033
- Table 24: Global Industrial Water Treatment Chemicals Industry Volume Billion Forecast, by Country 2020 & 2033
- Table 25: Germany Industrial Water Treatment Chemicals Industry Revenue (Million) Forecast, by Application 2020 & 2033
- Table 26: Germany Industrial Water Treatment Chemicals Industry Volume (Billion) Forecast, by Application 2020 & 2033
- Table 27: United Kingdom Industrial Water Treatment Chemicals Industry Revenue (Million) Forecast, by Application 2020 & 2033
- Table 28: United Kingdom Industrial Water Treatment Chemicals Industry Volume (Billion) Forecast, by Application 2020 & 2033
- Table 29: France Industrial Water Treatment Chemicals Industry Revenue (Million) Forecast, by Application 2020 & 2033
- Table 30: France Industrial Water Treatment Chemicals Industry Volume (Billion) Forecast, by Application 2020 & 2033
- Table 31: Italy Industrial Water Treatment Chemicals Industry Revenue (Million) Forecast, by Application 2020 & 2033
- Table 32: Italy Industrial Water Treatment Chemicals Industry Volume (Billion) Forecast, by Application 2020 & 2033
- Table 33: Rest of Europe Industrial Water Treatment Chemicals Industry Revenue (Million) Forecast, by Application 2020 & 2033
- Table 34: Rest of Europe Industrial Water Treatment Chemicals Industry Volume (Billion) Forecast, by Application 2020 & 2033
- Table 35: Global Industrial Water Treatment Chemicals Industry Revenue Million Forecast, by Product Type 2020 & 2033
- Table 36: Global Industrial Water Treatment Chemicals Industry Volume Billion Forecast, by Product Type 2020 & 2033
- Table 37: Global Industrial Water Treatment Chemicals Industry Revenue Million Forecast, by End-user Industry 2020 & 2033
- Table 38: Global Industrial Water Treatment Chemicals Industry Volume Billion Forecast, by End-user Industry 2020 & 2033
- Table 39: Global Industrial Water Treatment Chemicals Industry Revenue Million Forecast, by Country 2020 & 2033
- Table 40: Global Industrial Water Treatment Chemicals Industry Volume Billion Forecast, by Country 2020 & 2033
- Table 41: China Industrial Water Treatment Chemicals Industry Revenue (Million) Forecast, by Application 2020 & 2033
- Table 42: China Industrial Water Treatment Chemicals Industry Volume (Billion) Forecast, by Application 2020 & 2033
- Table 43: India Industrial Water Treatment Chemicals Industry Revenue (Million) Forecast, by Application 2020 & 2033
- Table 44: India Industrial Water Treatment Chemicals Industry Volume (Billion) Forecast, by Application 2020 & 2033
- Table 45: Japan Industrial Water Treatment Chemicals Industry Revenue (Million) Forecast, by Application 2020 & 2033
- Table 46: Japan Industrial Water Treatment Chemicals Industry Volume (Billion) Forecast, by Application 2020 & 2033
- Table 47: South Korea Industrial Water Treatment Chemicals Industry Revenue (Million) Forecast, by Application 2020 & 2033
- Table 48: South Korea Industrial Water Treatment Chemicals Industry Volume (Billion) Forecast, by Application 2020 & 2033
- Table 49: Rest of Asia Pacific Industrial Water Treatment Chemicals Industry Revenue (Million) Forecast, by Application 2020 & 2033
- Table 50: Rest of Asia Pacific Industrial Water Treatment Chemicals Industry Volume (Billion) Forecast, by Application 2020 & 2033
- Table 51: Global Industrial Water Treatment Chemicals Industry Revenue Million Forecast, by Product Type 2020 & 2033
- Table 52: Global Industrial Water Treatment Chemicals Industry Volume Billion Forecast, by Product Type 2020 & 2033
- Table 53: Global Industrial Water Treatment Chemicals Industry Revenue Million Forecast, by End-user Industry 2020 & 2033
- Table 54: Global Industrial Water Treatment Chemicals Industry Volume Billion Forecast, by End-user Industry 2020 & 2033
- Table 55: Global Industrial Water Treatment Chemicals Industry Revenue Million Forecast, by Country 2020 & 2033
- Table 56: Global Industrial Water Treatment Chemicals Industry Volume Billion Forecast, by Country 2020 & 2033
- Table 57: Brazil Industrial Water Treatment Chemicals Industry Revenue (Million) Forecast, by Application 2020 & 2033
- Table 58: Brazil Industrial Water Treatment Chemicals Industry Volume (Billion) Forecast, by Application 2020 & 2033
- Table 59: Argentina Industrial Water Treatment Chemicals Industry Revenue (Million) Forecast, by Application 2020 & 2033
- Table 60: Argentina Industrial Water Treatment Chemicals Industry Volume (Billion) Forecast, by Application 2020 & 2033
- Table 61: Rest of South America Industrial Water Treatment Chemicals Industry Revenue (Million) Forecast, by Application 2020 & 2033
- Table 62: Rest of South America Industrial Water Treatment Chemicals Industry Volume (Billion) Forecast, by Application 2020 & 2033
- Table 63: Global Industrial Water Treatment Chemicals Industry Revenue Million Forecast, by Product Type 2020 & 2033
- Table 64: Global Industrial Water Treatment Chemicals Industry Volume Billion Forecast, by Product Type 2020 & 2033
- Table 65: Global Industrial Water Treatment Chemicals Industry Revenue Million Forecast, by End-user Industry 2020 & 2033
- Table 66: Global Industrial Water Treatment Chemicals Industry Volume Billion Forecast, by End-user Industry 2020 & 2033
- Table 67: Global Industrial Water Treatment Chemicals Industry Revenue Million Forecast, by Country 2020 & 2033
- Table 68: Global Industrial Water Treatment Chemicals Industry Volume Billion Forecast, by Country 2020 & 2033
- Table 69: Saudi Arabia Industrial Water Treatment Chemicals Industry Revenue (Million) Forecast, by Application 2020 & 2033
- Table 70: Saudi Arabia Industrial Water Treatment Chemicals Industry Volume (Billion) Forecast, by Application 2020 & 2033
- Table 71: South Africa Industrial Water Treatment Chemicals Industry Revenue (Million) Forecast, by Application 2020 & 2033
- Table 72: South Africa Industrial Water Treatment Chemicals Industry Volume (Billion) Forecast, by Application 2020 & 2033
- Table 73: United Arab Emirates Industrial Water Treatment Chemicals Industry Revenue (Million) Forecast, by Application 2020 & 2033
- Table 74: United Arab Emirates Industrial Water Treatment Chemicals Industry Volume (Billion) Forecast, by Application 2020 & 2033
- Table 75: Rest of Middle East and Africa Industrial Water Treatment Chemicals Industry Revenue (Million) Forecast, by Application 2020 & 2033
- Table 76: Rest of Middle East and Africa Industrial Water Treatment Chemicals Industry Volume (Billion) Forecast, by Application 2020 & 2033
Frequently Asked Questions
1. What is the projected Compound Annual Growth Rate (CAGR) of the Industrial Water Treatment Chemicals Industry?
The projected CAGR is approximately 6.04%.
2. Which companies are prominent players in the Industrial Water Treatment Chemicals Industry?
Key companies in the market include BWA WATER ADDITIVES, Chemifloc LTD, Kemira, Kurita Water Industries Ltd, Lenntech B V, Lonza, DuPont de Nemours Inc, Ecolab, SNF, Solenis, SUEZ*List Not Exhaustive.
3. What are the main segments of the Industrial Water Treatment Chemicals Industry?
The market segments include Product Type, End-user Industry.
4. Can you provide details about the market size?
The market size is estimated to be USD 22.19 Million as of 2022.
5. What are some drivers contributing to market growth?
Increasing Production of Shale Gas in the United States; Growing Production Activities in Chemical and Paper Industry; Other Drivers.
6. What are the notable trends driving market growth?
Power Industry to Dominate the Market.
7. Are there any restraints impacting market growth?
Increasing Production of Shale Gas in the United States; Growing Production Activities in Chemical and Paper Industry; Other Drivers.
8. Can you provide examples of recent developments in the market?
March 2023: Solenis, providing water treatment solutions for municipal and industrial water treatment, announced that it agreed to acquire Diversey, a cleaning solutions company primarily for industrial water treatment, for USD 4.6 billion.
9. What pricing options are available for accessing the report?
Pricing options include single-user, multi-user, and enterprise licenses priced at USD 4750, USD 5250, and USD 8750 respectively.
10. Is the market size provided in terms of value or volume?
The market size is provided in terms of value, measured in Million and volume, measured in Billion.
11. Are there any specific market keywords associated with the report?
Yes, the market keyword associated with the report is "Industrial Water Treatment Chemicals Industry," which aids in identifying and referencing the specific market segment covered.
12. How do I determine which pricing option suits my needs best?
The pricing options vary based on user requirements and access needs. Individual users may opt for single-user licenses, while businesses requiring broader access may choose multi-user or enterprise licenses for cost-effective access to the report.
13. Are there any additional resources or data provided in the Industrial Water Treatment Chemicals Industry report?
While the report offers comprehensive insights, it's advisable to review the specific contents or supplementary materials provided to ascertain if additional resources or data are available.
14. How can I stay updated on further developments or reports in the Industrial Water Treatment Chemicals Industry?
To stay informed about further developments, trends, and reports in the Industrial Water Treatment Chemicals Industry, consider subscribing to industry newsletters, following relevant companies and organizations, or regularly checking reputable industry news sources and publications.
Methodology
Step 1 - Identification of Relevant Samples Size from Population Database


Step 2 - Approaches for Defining Global Market Size (Value, Volume* & Price*)

Note*: In applicable scenarios
Step 3 - Data Sources
Primary Research
- Web Analytics
- Survey Reports
- Research Institute
- Latest Research Reports
- Opinion Leaders
Secondary Research
- Annual Reports
- White Paper
- Latest Press Release
- Industry Association
- Paid Database
- Investor Presentations

Step 4 - Data Triangulation
Involves using different sources of information in order to increase the validity of a study
These sources are likely to be stakeholders in a program - participants, other researchers, program staff, other community members, and so on.
Then we put all data in single framework & apply various statistical tools to find out the dynamic on the market.
During the analysis stage, feedback from the stakeholder groups would be compared to determine areas of agreement as well as areas of divergence