

Key Insights
The global insect killer market is poised for robust expansion, propelled by heightened awareness of vector-borne diseases, escalating urbanization, and sustained demand for effective pest management across residential and commercial sectors. The market is projected to exhibit a Compound Annual Growth Rate (CAGR) of 4.66%, reaching a market size of 7.98 billion by the base year of 2025. Key growth drivers include the increasing adoption of sustainable and eco-friendly pest control solutions, such as biological agents and pheromone traps, complementing traditional chemical insecticides due to growing environmental consciousness and stringent regulations. Leading manufacturers are prioritizing innovation, balancing product efficacy with environmental responsibility. Market challenges involve potential health concerns linked to certain chemical formulations, raw material price volatility, and rigorous regulatory approval processes. Segmentation indicates significant growth in both residential and commercial applications, with commercial sectors, particularly food processing and hospitality, demonstrating accelerated demand for advanced pest management solutions. Geographically, North America and Europe currently lead, while Asia and Africa present substantial future growth opportunities.
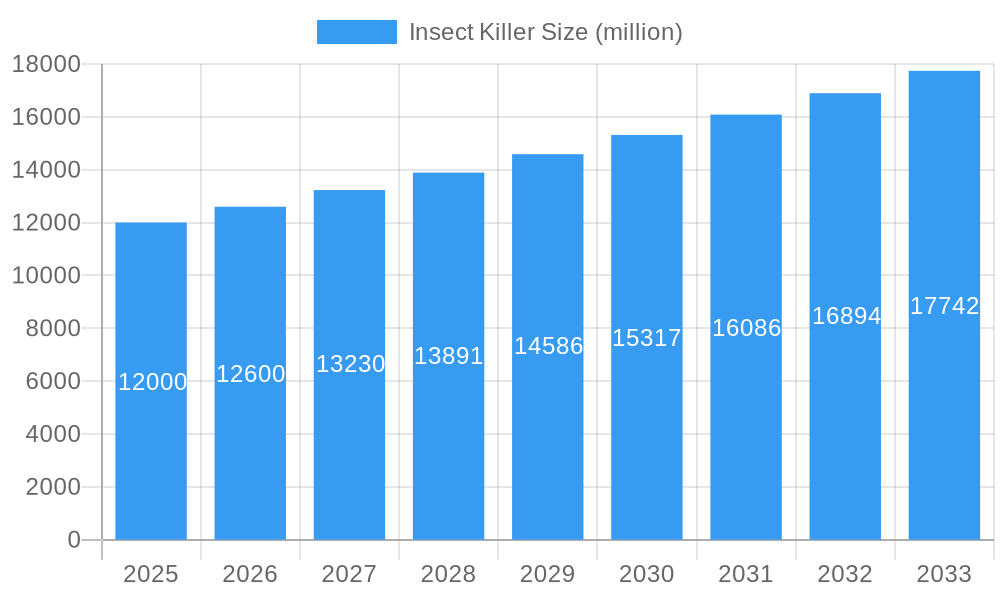
Insect Killer Market Size (In Billion)
The market is forecast to reach approximately 7.98 billion in value by 2025. This projection incorporates market dynamics, including evolving consumer preferences for sustainable options and the enduring need for effective insect control. Technological advancements, such as smart traps and sophisticated formulations, are expected to further fuel market growth by enabling more targeted and efficient pest eradication. The competitive environment features a blend of established industry leaders and agile emerging companies, fostering innovation and competitive pricing. Strategic collaborations and consolidations will be instrumental in shaping future market structures and dynamics.
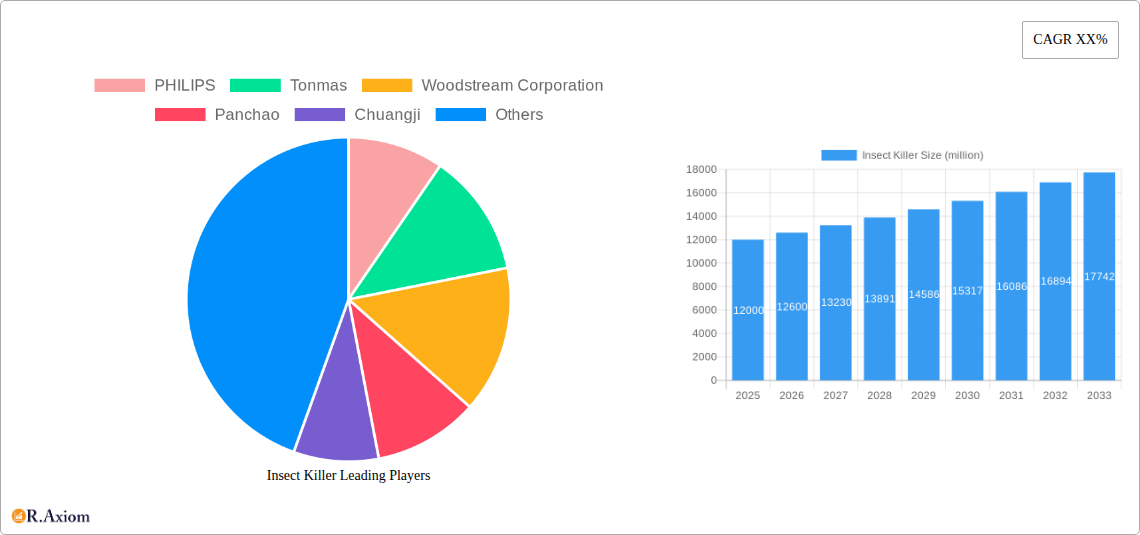
Insect Killer Company Market Share
Insect Killer Market Report: 2019-2033 - A Comprehensive Analysis
This comprehensive report provides an in-depth analysis of the global Insect Killer market, encompassing historical data (2019-2024), current estimates (2025), and future projections (2025-2033). The study delves into market dynamics, competitive landscapes, technological advancements, and emerging trends, offering actionable insights for industry stakeholders. The report values are expressed in millions of USD.
Insect Killer Market Concentration & Innovation
The global insect killer market exhibits a moderately concentrated structure, with a few dominant players commanding significant market share. In 2025, the top five companies— PHILIPS, Tonmas, Woodstream Corporation, Panchao, and Chuangji—held an estimated xx% of the global market. Innovation is a key driver, fueled by the rising demand for more effective, sustainable, and eco-friendly insect control solutions. Regulatory frameworks, varying across geographies, significantly impact product development and market entry. The market also experiences competitive pressures from product substitutes like natural repellents and biological control methods. End-user trends, particularly towards safer and convenient products, are shaping product development. Mergers and acquisitions (M&A) activities have been moderate in the past five years, with a total deal value estimated at $xx million. Significant M&A activities included:
- Acquisition of [Company A] by [Company B] in 2022, valued at $xx million.
- Strategic partnership between [Company C] and [Company D] in 2024 focusing on R&D.
Insect Killer Industry Trends & Insights
The global insect killer market is projected to witness robust growth, with a Compound Annual Growth Rate (CAGR) of xx% during the forecast period (2025-2033). This growth is primarily driven by factors such as:
- Rising prevalence of insect-borne diseases.
- Increasing demand for effective pest control in agricultural and residential sectors.
- Growing awareness of public health and hygiene.
- Technological advancements leading to the development of innovative and efficient products.
Technological disruptions, such as the advent of smart pest control systems and the increased use of AI in pest management, are reshaping the industry landscape. Consumer preferences are shifting towards environmentally friendly and sustainable insect control solutions. Competitive dynamics are intense, with companies vying for market share through product differentiation, strategic partnerships, and technological advancements. Market penetration of eco-friendly insect killers is expected to reach xx% by 2033.
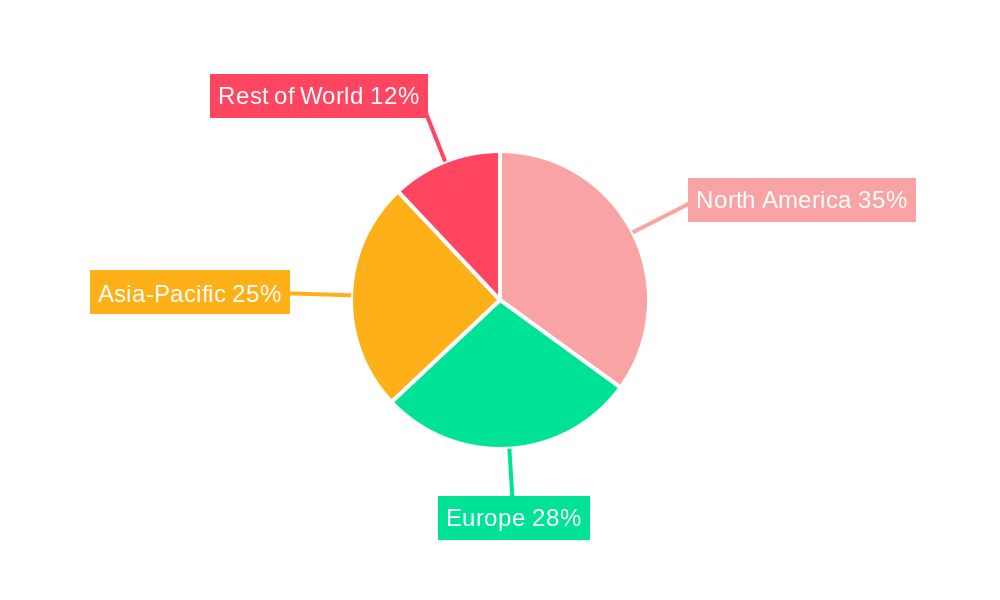
Dominant Markets & Segments in Insect Killer
The North American region is currently the dominant market for insect killers, accounting for xx% of the global market share in 2025. Key drivers of this dominance include:
- High disposable incomes.
- Stringent regulatory frameworks driving demand for effective and safe solutions.
- Well-developed infrastructure and distribution networks.
Key factors driving dominance:
- High awareness of pest-borne diseases.
- Strong demand for residential and commercial pest control services.
- Significant investments in research and development of new insect control technologies.
Other regions, such as Asia-Pacific and Europe, are also experiencing significant growth, driven by factors such as urbanization, rising incomes, and increasing awareness of public health issues.
Insect Killer Product Developments
Recent product innovations in the insect killer market focus on enhancing efficacy, safety, and sustainability. This includes the development of targeted insecticides, biological controls, and eco-friendly formulations that minimize environmental impact. New applications extend beyond traditional residential use to include agricultural pest control, public health management, and industrial settings. Technological trends such as nanotechnology and biopesticides are enabling the creation of highly effective and specific insect control solutions. The focus on market fit is strong, with products tailored to meet specific needs in various end-use sectors.
Report Scope & Segmentation Analysis
The report segments the insect killer market based on product type (sprays, gels, traps, etc.), application (residential, commercial, agricultural), and geography. Each segment's growth projection, market size, and competitive dynamics are analyzed in detail. The residential segment is expected to maintain its dominance, driven by increasing awareness of household pest control. The agricultural segment is witnessing significant growth due to the rising demand for high-yield crops and the need to minimize crop losses. The commercial segment presents opportunities for innovative and efficient pest control solutions.
Key Drivers of Insect Killer Growth
The growth of the insect killer market is primarily driven by several factors:
- The increasing prevalence of insect-borne diseases (e.g., malaria, dengue fever) leading to higher demand for effective insect control methods.
- The growing awareness of the importance of public health and hygiene.
- The rising adoption of eco-friendly and sustainable insect control solutions driven by environmental concerns.
- Technological advancements which are enabling the development of more innovative and efficient products.
Challenges in the Insect Killer Sector
Several challenges impede the growth of the insect killer market:
- Stringent regulatory frameworks and safety concerns surrounding the use of certain chemicals.
- Fluctuations in raw material prices, impacting production costs.
- The emergence of insect resistance to commonly used insecticides, requiring ongoing innovation.
- Increased competition from natural and biological pest control methods.
Emerging Opportunities in Insect Killer
Emerging opportunities in the insect killer market include:
- The development of novel, targeted insecticides with reduced environmental impact.
- The growing adoption of integrated pest management (IPM) strategies.
- The expansion into new markets, such as developing countries with high insect-borne disease prevalence.
- Increased use of data analytics and artificial intelligence to improve pest control efficiency.
Leading Players in the Insect Killer Market
- PHILIPS
- Tonmas
- Woodstream Corporation
- Panchao
- Chuangji
- INVICTUS International
- Armatron International
- Greenyellow
- Thermacell Repellents
- Remaig
- TONMAS
Key Developments in Insect Killer Industry
- January 2023: Launch of a new eco-friendly insect repellent by [Company Name].
- June 2022: Acquisition of [Company X] by [Company Y], expanding market presence in the agricultural sector.
- March 2021: Introduction of a smart pest control system integrating AI-powered monitoring and automated dispensing.
Strategic Outlook for Insect Killer Market
The insect killer market is poised for continued growth, fueled by increasing demand for effective and safe insect control solutions. Innovation in product development, coupled with the adoption of sustainable practices, will be crucial for success. Expanding into new markets and leveraging technological advancements will offer significant growth opportunities. The focus on integrated pest management and eco-friendly solutions will shape the future of the insect killer market.
Insect Killer Segmentation
-
1. Application
- 1.1. Indoor
- 1.2. Outdoor
-
2. Types
- 2.1. Electric Shock Insect Killer
- 2.2. Sticky Trap Insect Killer
- 2.3. Photocatalytic Insect Killer
- 2.4. Others
Insect Killer Segmentation By Geography
-
1. North America
- 1.1. United States
- 1.2. Canada
- 1.3. Mexico
-
2. South America
- 2.1. Brazil
- 2.2. Argentina
- 2.3. Rest of South America
-
3. Europe
- 3.1. United Kingdom
- 3.2. Germany
- 3.3. France
- 3.4. Italy
- 3.5. Spain
- 3.6. Russia
- 3.7. Benelux
- 3.8. Nordics
- 3.9. Rest of Europe
-
4. Middle East & Africa
- 4.1. Turkey
- 4.2. Israel
- 4.3. GCC
- 4.4. North Africa
- 4.5. South Africa
- 4.6. Rest of Middle East & Africa
-
5. Asia Pacific
- 5.1. China
- 5.2. India
- 5.3. Japan
- 5.4. South Korea
- 5.5. ASEAN
- 5.6. Oceania
- 5.7. Rest of Asia Pacific
Insect Killer Regional Market Share
Geographic Coverage of Insect Killer
Insect Killer REPORT HIGHLIGHTS
| Aspects | Details |
|---|---|
| Study Period | 2020-2034 |
| Base Year | 2025 |
| Estimated Year | 2026 |
| Forecast Period | 2026-2034 |
| Historical Period | 2020-2025 |
| Growth Rate | CAGR of 4.66% from 2020-2034 |
| Segmentation |
|
Table of Contents
- 1. Introduction
- 1.1. Research Scope
- 1.2. Market Segmentation
- 1.3. Research Methodology
- 1.4. Definitions and Assumptions
- 2. Executive Summary
- 2.1. Introduction
- 3. Market Dynamics
- 3.1. Introduction
- 3.2. Market Drivers
- 3.3. Market Restrains
- 3.4. Market Trends
- 4. Market Factor Analysis
- 4.1. Porters Five Forces
- 4.2. Supply/Value Chain
- 4.3. PESTEL analysis
- 4.4. Market Entropy
- 4.5. Patent/Trademark Analysis
- 5. Global Insect Killer Analysis, Insights and Forecast, 2020-2032
- 5.1. Market Analysis, Insights and Forecast - by Application
- 5.1.1. Indoor
- 5.1.2. Outdoor
- 5.2. Market Analysis, Insights and Forecast - by Types
- 5.2.1. Electric Shock Insect Killer
- 5.2.2. Sticky Trap Insect Killer
- 5.2.3. Photocatalytic Insect Killer
- 5.2.4. Others
- 5.3. Market Analysis, Insights and Forecast - by Region
- 5.3.1. North America
- 5.3.2. South America
- 5.3.3. Europe
- 5.3.4. Middle East & Africa
- 5.3.5. Asia Pacific
- 5.1. Market Analysis, Insights and Forecast - by Application
- 6. North America Insect Killer Analysis, Insights and Forecast, 2020-2032
- 6.1. Market Analysis, Insights and Forecast - by Application
- 6.1.1. Indoor
- 6.1.2. Outdoor
- 6.2. Market Analysis, Insights and Forecast - by Types
- 6.2.1. Electric Shock Insect Killer
- 6.2.2. Sticky Trap Insect Killer
- 6.2.3. Photocatalytic Insect Killer
- 6.2.4. Others
- 6.1. Market Analysis, Insights and Forecast - by Application
- 7. South America Insect Killer Analysis, Insights and Forecast, 2020-2032
- 7.1. Market Analysis, Insights and Forecast - by Application
- 7.1.1. Indoor
- 7.1.2. Outdoor
- 7.2. Market Analysis, Insights and Forecast - by Types
- 7.2.1. Electric Shock Insect Killer
- 7.2.2. Sticky Trap Insect Killer
- 7.2.3. Photocatalytic Insect Killer
- 7.2.4. Others
- 7.1. Market Analysis, Insights and Forecast - by Application
- 8. Europe Insect Killer Analysis, Insights and Forecast, 2020-2032
- 8.1. Market Analysis, Insights and Forecast - by Application
- 8.1.1. Indoor
- 8.1.2. Outdoor
- 8.2. Market Analysis, Insights and Forecast - by Types
- 8.2.1. Electric Shock Insect Killer
- 8.2.2. Sticky Trap Insect Killer
- 8.2.3. Photocatalytic Insect Killer
- 8.2.4. Others
- 8.1. Market Analysis, Insights and Forecast - by Application
- 9. Middle East & Africa Insect Killer Analysis, Insights and Forecast, 2020-2032
- 9.1. Market Analysis, Insights and Forecast - by Application
- 9.1.1. Indoor
- 9.1.2. Outdoor
- 9.2. Market Analysis, Insights and Forecast - by Types
- 9.2.1. Electric Shock Insect Killer
- 9.2.2. Sticky Trap Insect Killer
- 9.2.3. Photocatalytic Insect Killer
- 9.2.4. Others
- 9.1. Market Analysis, Insights and Forecast - by Application
- 10. Asia Pacific Insect Killer Analysis, Insights and Forecast, 2020-2032
- 10.1. Market Analysis, Insights and Forecast - by Application
- 10.1.1. Indoor
- 10.1.2. Outdoor
- 10.2. Market Analysis, Insights and Forecast - by Types
- 10.2.1. Electric Shock Insect Killer
- 10.2.2. Sticky Trap Insect Killer
- 10.2.3. Photocatalytic Insect Killer
- 10.2.4. Others
- 10.1. Market Analysis, Insights and Forecast - by Application
- 11. Competitive Analysis
- 11.1. Global Market Share Analysis 2025
- 11.2. Company Profiles
- 11.2.1 PHILIPS
- 11.2.1.1. Overview
- 11.2.1.2. Products
- 11.2.1.3. SWOT Analysis
- 11.2.1.4. Recent Developments
- 11.2.1.5. Financials (Based on Availability)
- 11.2.2 Tonmas
- 11.2.2.1. Overview
- 11.2.2.2. Products
- 11.2.2.3. SWOT Analysis
- 11.2.2.4. Recent Developments
- 11.2.2.5. Financials (Based on Availability)
- 11.2.3 Woodstream Corporation
- 11.2.3.1. Overview
- 11.2.3.2. Products
- 11.2.3.3. SWOT Analysis
- 11.2.3.4. Recent Developments
- 11.2.3.5. Financials (Based on Availability)
- 11.2.4 Panchao
- 11.2.4.1. Overview
- 11.2.4.2. Products
- 11.2.4.3. SWOT Analysis
- 11.2.4.4. Recent Developments
- 11.2.4.5. Financials (Based on Availability)
- 11.2.5 Chuangji
- 11.2.5.1. Overview
- 11.2.5.2. Products
- 11.2.5.3. SWOT Analysis
- 11.2.5.4. Recent Developments
- 11.2.5.5. Financials (Based on Availability)
- 11.2.6 INVICTUS International
- 11.2.6.1. Overview
- 11.2.6.2. Products
- 11.2.6.3. SWOT Analysis
- 11.2.6.4. Recent Developments
- 11.2.6.5. Financials (Based on Availability)
- 11.2.7 Armatron International
- 11.2.7.1. Overview
- 11.2.7.2. Products
- 11.2.7.3. SWOT Analysis
- 11.2.7.4. Recent Developments
- 11.2.7.5. Financials (Based on Availability)
- 11.2.8 Greenyellow
- 11.2.8.1. Overview
- 11.2.8.2. Products
- 11.2.8.3. SWOT Analysis
- 11.2.8.4. Recent Developments
- 11.2.8.5. Financials (Based on Availability)
- 11.2.9 Thermacell Repellents
- 11.2.9.1. Overview
- 11.2.9.2. Products
- 11.2.9.3. SWOT Analysis
- 11.2.9.4. Recent Developments
- 11.2.9.5. Financials (Based on Availability)
- 11.2.10 Remaig
- 11.2.10.1. Overview
- 11.2.10.2. Products
- 11.2.10.3. SWOT Analysis
- 11.2.10.4. Recent Developments
- 11.2.10.5. Financials (Based on Availability)
- 11.2.11 TONMAS
- 11.2.11.1. Overview
- 11.2.11.2. Products
- 11.2.11.3. SWOT Analysis
- 11.2.11.4. Recent Developments
- 11.2.11.5. Financials (Based on Availability)
- 11.2.1 PHILIPS
List of Figures
- Figure 1: Global Insect Killer Revenue Breakdown (billion, %) by Region 2025 & 2033
- Figure 2: Global Insect Killer Volume Breakdown (K, %) by Region 2025 & 2033
- Figure 3: North America Insect Killer Revenue (billion), by Application 2025 & 2033
- Figure 4: North America Insect Killer Volume (K), by Application 2025 & 2033
- Figure 5: North America Insect Killer Revenue Share (%), by Application 2025 & 2033
- Figure 6: North America Insect Killer Volume Share (%), by Application 2025 & 2033
- Figure 7: North America Insect Killer Revenue (billion), by Types 2025 & 2033
- Figure 8: North America Insect Killer Volume (K), by Types 2025 & 2033
- Figure 9: North America Insect Killer Revenue Share (%), by Types 2025 & 2033
- Figure 10: North America Insect Killer Volume Share (%), by Types 2025 & 2033
- Figure 11: North America Insect Killer Revenue (billion), by Country 2025 & 2033
- Figure 12: North America Insect Killer Volume (K), by Country 2025 & 2033
- Figure 13: North America Insect Killer Revenue Share (%), by Country 2025 & 2033
- Figure 14: North America Insect Killer Volume Share (%), by Country 2025 & 2033
- Figure 15: South America Insect Killer Revenue (billion), by Application 2025 & 2033
- Figure 16: South America Insect Killer Volume (K), by Application 2025 & 2033
- Figure 17: South America Insect Killer Revenue Share (%), by Application 2025 & 2033
- Figure 18: South America Insect Killer Volume Share (%), by Application 2025 & 2033
- Figure 19: South America Insect Killer Revenue (billion), by Types 2025 & 2033
- Figure 20: South America Insect Killer Volume (K), by Types 2025 & 2033
- Figure 21: South America Insect Killer Revenue Share (%), by Types 2025 & 2033
- Figure 22: South America Insect Killer Volume Share (%), by Types 2025 & 2033
- Figure 23: South America Insect Killer Revenue (billion), by Country 2025 & 2033
- Figure 24: South America Insect Killer Volume (K), by Country 2025 & 2033
- Figure 25: South America Insect Killer Revenue Share (%), by Country 2025 & 2033
- Figure 26: South America Insect Killer Volume Share (%), by Country 2025 & 2033
- Figure 27: Europe Insect Killer Revenue (billion), by Application 2025 & 2033
- Figure 28: Europe Insect Killer Volume (K), by Application 2025 & 2033
- Figure 29: Europe Insect Killer Revenue Share (%), by Application 2025 & 2033
- Figure 30: Europe Insect Killer Volume Share (%), by Application 2025 & 2033
- Figure 31: Europe Insect Killer Revenue (billion), by Types 2025 & 2033
- Figure 32: Europe Insect Killer Volume (K), by Types 2025 & 2033
- Figure 33: Europe Insect Killer Revenue Share (%), by Types 2025 & 2033
- Figure 34: Europe Insect Killer Volume Share (%), by Types 2025 & 2033
- Figure 35: Europe Insect Killer Revenue (billion), by Country 2025 & 2033
- Figure 36: Europe Insect Killer Volume (K), by Country 2025 & 2033
- Figure 37: Europe Insect Killer Revenue Share (%), by Country 2025 & 2033
- Figure 38: Europe Insect Killer Volume Share (%), by Country 2025 & 2033
- Figure 39: Middle East & Africa Insect Killer Revenue (billion), by Application 2025 & 2033
- Figure 40: Middle East & Africa Insect Killer Volume (K), by Application 2025 & 2033
- Figure 41: Middle East & Africa Insect Killer Revenue Share (%), by Application 2025 & 2033
- Figure 42: Middle East & Africa Insect Killer Volume Share (%), by Application 2025 & 2033
- Figure 43: Middle East & Africa Insect Killer Revenue (billion), by Types 2025 & 2033
- Figure 44: Middle East & Africa Insect Killer Volume (K), by Types 2025 & 2033
- Figure 45: Middle East & Africa Insect Killer Revenue Share (%), by Types 2025 & 2033
- Figure 46: Middle East & Africa Insect Killer Volume Share (%), by Types 2025 & 2033
- Figure 47: Middle East & Africa Insect Killer Revenue (billion), by Country 2025 & 2033
- Figure 48: Middle East & Africa Insect Killer Volume (K), by Country 2025 & 2033
- Figure 49: Middle East & Africa Insect Killer Revenue Share (%), by Country 2025 & 2033
- Figure 50: Middle East & Africa Insect Killer Volume Share (%), by Country 2025 & 2033
- Figure 51: Asia Pacific Insect Killer Revenue (billion), by Application 2025 & 2033
- Figure 52: Asia Pacific Insect Killer Volume (K), by Application 2025 & 2033
- Figure 53: Asia Pacific Insect Killer Revenue Share (%), by Application 2025 & 2033
- Figure 54: Asia Pacific Insect Killer Volume Share (%), by Application 2025 & 2033
- Figure 55: Asia Pacific Insect Killer Revenue (billion), by Types 2025 & 2033
- Figure 56: Asia Pacific Insect Killer Volume (K), by Types 2025 & 2033
- Figure 57: Asia Pacific Insect Killer Revenue Share (%), by Types 2025 & 2033
- Figure 58: Asia Pacific Insect Killer Volume Share (%), by Types 2025 & 2033
- Figure 59: Asia Pacific Insect Killer Revenue (billion), by Country 2025 & 2033
- Figure 60: Asia Pacific Insect Killer Volume (K), by Country 2025 & 2033
- Figure 61: Asia Pacific Insect Killer Revenue Share (%), by Country 2025 & 2033
- Figure 62: Asia Pacific Insect Killer Volume Share (%), by Country 2025 & 2033
List of Tables
- Table 1: Global Insect Killer Revenue billion Forecast, by Application 2020 & 2033
- Table 2: Global Insect Killer Volume K Forecast, by Application 2020 & 2033
- Table 3: Global Insect Killer Revenue billion Forecast, by Types 2020 & 2033
- Table 4: Global Insect Killer Volume K Forecast, by Types 2020 & 2033
- Table 5: Global Insect Killer Revenue billion Forecast, by Region 2020 & 2033
- Table 6: Global Insect Killer Volume K Forecast, by Region 2020 & 2033
- Table 7: Global Insect Killer Revenue billion Forecast, by Application 2020 & 2033
- Table 8: Global Insect Killer Volume K Forecast, by Application 2020 & 2033
- Table 9: Global Insect Killer Revenue billion Forecast, by Types 2020 & 2033
- Table 10: Global Insect Killer Volume K Forecast, by Types 2020 & 2033
- Table 11: Global Insect Killer Revenue billion Forecast, by Country 2020 & 2033
- Table 12: Global Insect Killer Volume K Forecast, by Country 2020 & 2033
- Table 13: United States Insect Killer Revenue (billion) Forecast, by Application 2020 & 2033
- Table 14: United States Insect Killer Volume (K) Forecast, by Application 2020 & 2033
- Table 15: Canada Insect Killer Revenue (billion) Forecast, by Application 2020 & 2033
- Table 16: Canada Insect Killer Volume (K) Forecast, by Application 2020 & 2033
- Table 17: Mexico Insect Killer Revenue (billion) Forecast, by Application 2020 & 2033
- Table 18: Mexico Insect Killer Volume (K) Forecast, by Application 2020 & 2033
- Table 19: Global Insect Killer Revenue billion Forecast, by Application 2020 & 2033
- Table 20: Global Insect Killer Volume K Forecast, by Application 2020 & 2033
- Table 21: Global Insect Killer Revenue billion Forecast, by Types 2020 & 2033
- Table 22: Global Insect Killer Volume K Forecast, by Types 2020 & 2033
- Table 23: Global Insect Killer Revenue billion Forecast, by Country 2020 & 2033
- Table 24: Global Insect Killer Volume K Forecast, by Country 2020 & 2033
- Table 25: Brazil Insect Killer Revenue (billion) Forecast, by Application 2020 & 2033
- Table 26: Brazil Insect Killer Volume (K) Forecast, by Application 2020 & 2033
- Table 27: Argentina Insect Killer Revenue (billion) Forecast, by Application 2020 & 2033
- Table 28: Argentina Insect Killer Volume (K) Forecast, by Application 2020 & 2033
- Table 29: Rest of South America Insect Killer Revenue (billion) Forecast, by Application 2020 & 2033
- Table 30: Rest of South America Insect Killer Volume (K) Forecast, by Application 2020 & 2033
- Table 31: Global Insect Killer Revenue billion Forecast, by Application 2020 & 2033
- Table 32: Global Insect Killer Volume K Forecast, by Application 2020 & 2033
- Table 33: Global Insect Killer Revenue billion Forecast, by Types 2020 & 2033
- Table 34: Global Insect Killer Volume K Forecast, by Types 2020 & 2033
- Table 35: Global Insect Killer Revenue billion Forecast, by Country 2020 & 2033
- Table 36: Global Insect Killer Volume K Forecast, by Country 2020 & 2033
- Table 37: United Kingdom Insect Killer Revenue (billion) Forecast, by Application 2020 & 2033
- Table 38: United Kingdom Insect Killer Volume (K) Forecast, by Application 2020 & 2033
- Table 39: Germany Insect Killer Revenue (billion) Forecast, by Application 2020 & 2033
- Table 40: Germany Insect Killer Volume (K) Forecast, by Application 2020 & 2033
- Table 41: France Insect Killer Revenue (billion) Forecast, by Application 2020 & 2033
- Table 42: France Insect Killer Volume (K) Forecast, by Application 2020 & 2033
- Table 43: Italy Insect Killer Revenue (billion) Forecast, by Application 2020 & 2033
- Table 44: Italy Insect Killer Volume (K) Forecast, by Application 2020 & 2033
- Table 45: Spain Insect Killer Revenue (billion) Forecast, by Application 2020 & 2033
- Table 46: Spain Insect Killer Volume (K) Forecast, by Application 2020 & 2033
- Table 47: Russia Insect Killer Revenue (billion) Forecast, by Application 2020 & 2033
- Table 48: Russia Insect Killer Volume (K) Forecast, by Application 2020 & 2033
- Table 49: Benelux Insect Killer Revenue (billion) Forecast, by Application 2020 & 2033
- Table 50: Benelux Insect Killer Volume (K) Forecast, by Application 2020 & 2033
- Table 51: Nordics Insect Killer Revenue (billion) Forecast, by Application 2020 & 2033
- Table 52: Nordics Insect Killer Volume (K) Forecast, by Application 2020 & 2033
- Table 53: Rest of Europe Insect Killer Revenue (billion) Forecast, by Application 2020 & 2033
- Table 54: Rest of Europe Insect Killer Volume (K) Forecast, by Application 2020 & 2033
- Table 55: Global Insect Killer Revenue billion Forecast, by Application 2020 & 2033
- Table 56: Global Insect Killer Volume K Forecast, by Application 2020 & 2033
- Table 57: Global Insect Killer Revenue billion Forecast, by Types 2020 & 2033
- Table 58: Global Insect Killer Volume K Forecast, by Types 2020 & 2033
- Table 59: Global Insect Killer Revenue billion Forecast, by Country 2020 & 2033
- Table 60: Global Insect Killer Volume K Forecast, by Country 2020 & 2033
- Table 61: Turkey Insect Killer Revenue (billion) Forecast, by Application 2020 & 2033
- Table 62: Turkey Insect Killer Volume (K) Forecast, by Application 2020 & 2033
- Table 63: Israel Insect Killer Revenue (billion) Forecast, by Application 2020 & 2033
- Table 64: Israel Insect Killer Volume (K) Forecast, by Application 2020 & 2033
- Table 65: GCC Insect Killer Revenue (billion) Forecast, by Application 2020 & 2033
- Table 66: GCC Insect Killer Volume (K) Forecast, by Application 2020 & 2033
- Table 67: North Africa Insect Killer Revenue (billion) Forecast, by Application 2020 & 2033
- Table 68: North Africa Insect Killer Volume (K) Forecast, by Application 2020 & 2033
- Table 69: South Africa Insect Killer Revenue (billion) Forecast, by Application 2020 & 2033
- Table 70: South Africa Insect Killer Volume (K) Forecast, by Application 2020 & 2033
- Table 71: Rest of Middle East & Africa Insect Killer Revenue (billion) Forecast, by Application 2020 & 2033
- Table 72: Rest of Middle East & Africa Insect Killer Volume (K) Forecast, by Application 2020 & 2033
- Table 73: Global Insect Killer Revenue billion Forecast, by Application 2020 & 2033
- Table 74: Global Insect Killer Volume K Forecast, by Application 2020 & 2033
- Table 75: Global Insect Killer Revenue billion Forecast, by Types 2020 & 2033
- Table 76: Global Insect Killer Volume K Forecast, by Types 2020 & 2033
- Table 77: Global Insect Killer Revenue billion Forecast, by Country 2020 & 2033
- Table 78: Global Insect Killer Volume K Forecast, by Country 2020 & 2033
- Table 79: China Insect Killer Revenue (billion) Forecast, by Application 2020 & 2033
- Table 80: China Insect Killer Volume (K) Forecast, by Application 2020 & 2033
- Table 81: India Insect Killer Revenue (billion) Forecast, by Application 2020 & 2033
- Table 82: India Insect Killer Volume (K) Forecast, by Application 2020 & 2033
- Table 83: Japan Insect Killer Revenue (billion) Forecast, by Application 2020 & 2033
- Table 84: Japan Insect Killer Volume (K) Forecast, by Application 2020 & 2033
- Table 85: South Korea Insect Killer Revenue (billion) Forecast, by Application 2020 & 2033
- Table 86: South Korea Insect Killer Volume (K) Forecast, by Application 2020 & 2033
- Table 87: ASEAN Insect Killer Revenue (billion) Forecast, by Application 2020 & 2033
- Table 88: ASEAN Insect Killer Volume (K) Forecast, by Application 2020 & 2033
- Table 89: Oceania Insect Killer Revenue (billion) Forecast, by Application 2020 & 2033
- Table 90: Oceania Insect Killer Volume (K) Forecast, by Application 2020 & 2033
- Table 91: Rest of Asia Pacific Insect Killer Revenue (billion) Forecast, by Application 2020 & 2033
- Table 92: Rest of Asia Pacific Insect Killer Volume (K) Forecast, by Application 2020 & 2033
Frequently Asked Questions
1. What is the projected Compound Annual Growth Rate (CAGR) of the Insect Killer?
The projected CAGR is approximately 4.66%.
2. Which companies are prominent players in the Insect Killer?
Key companies in the market include PHILIPS, Tonmas, Woodstream Corporation, Panchao, Chuangji, INVICTUS International, Armatron International, Greenyellow, Thermacell Repellents, Remaig, TONMAS.
3. What are the main segments of the Insect Killer?
The market segments include Application, Types.
4. Can you provide details about the market size?
The market size is estimated to be USD 7.98 billion as of 2022.
5. What are some drivers contributing to market growth?
N/A
6. What are the notable trends driving market growth?
N/A
7. Are there any restraints impacting market growth?
N/A
8. Can you provide examples of recent developments in the market?
N/A
9. What pricing options are available for accessing the report?
Pricing options include single-user, multi-user, and enterprise licenses priced at USD 3350.00, USD 5025.00, and USD 6700.00 respectively.
10. Is the market size provided in terms of value or volume?
The market size is provided in terms of value, measured in billion and volume, measured in K.
11. Are there any specific market keywords associated with the report?
Yes, the market keyword associated with the report is "Insect Killer," which aids in identifying and referencing the specific market segment covered.
12. How do I determine which pricing option suits my needs best?
The pricing options vary based on user requirements and access needs. Individual users may opt for single-user licenses, while businesses requiring broader access may choose multi-user or enterprise licenses for cost-effective access to the report.
13. Are there any additional resources or data provided in the Insect Killer report?
While the report offers comprehensive insights, it's advisable to review the specific contents or supplementary materials provided to ascertain if additional resources or data are available.
14. How can I stay updated on further developments or reports in the Insect Killer?
To stay informed about further developments, trends, and reports in the Insect Killer, consider subscribing to industry newsletters, following relevant companies and organizations, or regularly checking reputable industry news sources and publications.
Methodology
Step 1 - Identification of Relevant Samples Size from Population Database


Step 2 - Approaches for Defining Global Market Size (Value, Volume* & Price*)

Note*: In applicable scenarios
Step 3 - Data Sources
Primary Research
- Web Analytics
- Survey Reports
- Research Institute
- Latest Research Reports
- Opinion Leaders
Secondary Research
- Annual Reports
- White Paper
- Latest Press Release
- Industry Association
- Paid Database
- Investor Presentations

Step 4 - Data Triangulation
Involves using different sources of information in order to increase the validity of a study
These sources are likely to be stakeholders in a program - participants, other researchers, program staff, other community members, and so on.
Then we put all data in single framework & apply various statistical tools to find out the dynamic on the market.
During the analysis stage, feedback from the stakeholder groups would be compared to determine areas of agreement as well as areas of divergence