Key Insights
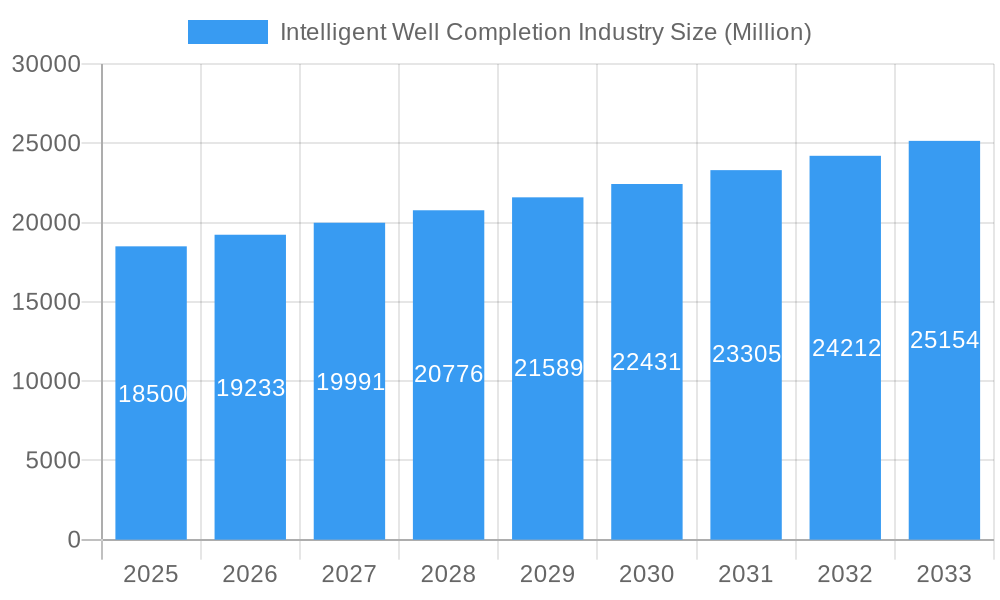
The global Intelligent Well Completion market is poised for significant expansion, projected to reach an estimated $18.5 billion in 2025, exhibiting a steady compound annual growth rate (CAGR) of 3.9% through 2033. This robust growth is primarily propelled by the increasing demand for enhanced oil and gas recovery techniques, driven by the need to maximize production from mature fields and optimize operational efficiency. Technological advancements in smart well technologies, including remote monitoring, automated control systems, and advanced sensor integration, are further fueling market expansion. These innovations enable operators to gain real-time insights into reservoir performance, facilitating proactive decision-making and minimizing downtime, thereby translating into substantial cost savings and improved production yields. The inherent advantages of intelligent well completions, such as precise flow control, improved safety, and reduced environmental impact, are increasingly recognized, leading to wider adoption across various oil and gas exploration and production (E&P) activities.
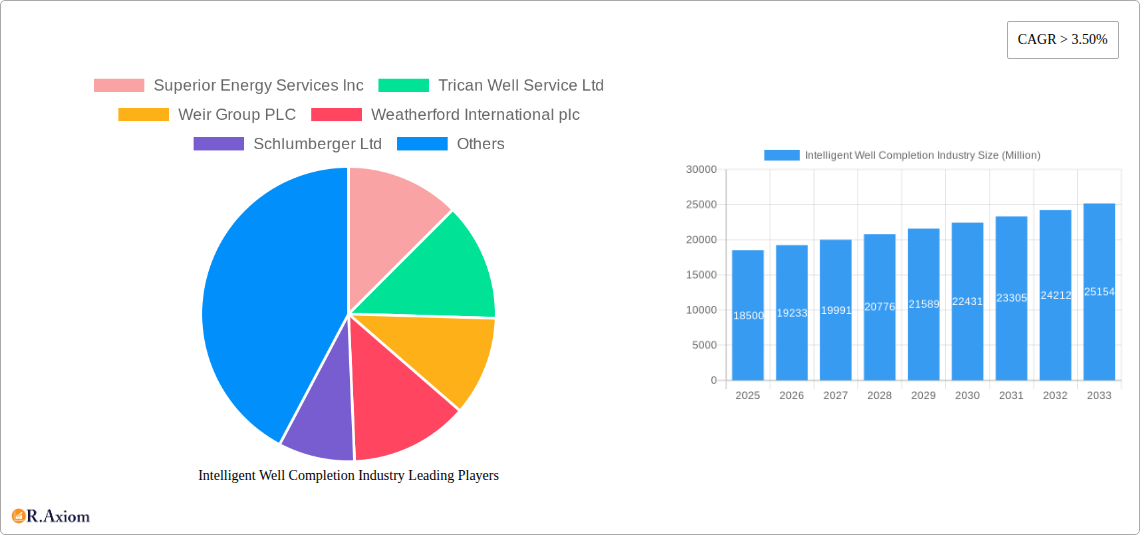
Intelligent Well Completion Industry Market Size (In Billion)
Despite the promising outlook, the market faces certain restraints, including the high initial investment costs associated with sophisticated intelligent well completion systems and the complex operational requirements for their deployment and maintenance. However, the long-term benefits in terms of increased production, reduced operational expenses, and enhanced safety are expected to outweigh these initial hurdles. Key market drivers include the growing emphasis on unconventional resource development, requiring advanced completion strategies for efficient extraction, and the ongoing pursuit of optimizing production in challenging offshore and deepwater environments. The market segmentation reveals a dynamic landscape with distinct growth trajectories for production analysis, consumption analysis, import/export dynamics, and price trends, all contributing to the overall market evolution. Geographically, North America is expected to maintain a dominant position due to extensive oil and gas activities, followed by the Middle East and Asia Pacific regions, driven by increasing exploration and production investments.
Intelligent Well Completion Industry Company Market Share
Intelligent Well Completion Industry Market Concentration & Innovation
The global Intelligent Well Completion Industry is characterized by a moderate to high market concentration, with a few major players dominating a significant portion of the market share. These leaders, including Schlumberger Ltd, Baker Hughes Company, and Halliburton Company, leverage their extensive R&D capabilities, established customer relationships, and integrated service offerings to maintain their competitive edge. Innovation is a critical driver, fueled by the increasing demand for enhanced oil recovery (EOR), optimized production, and reduced operational costs. Key innovation areas include advanced sensor technologies, real-time data analytics, artificial intelligence (AI) for predictive maintenance, and miniaturization of downhole equipment. Regulatory frameworks, while generally supportive of technological advancements that improve safety and environmental performance, can vary by region, influencing market entry and product development. The emergence of sophisticated product substitutes, such as advanced artificial lift systems and enhanced artificial intelligence-driven production optimization software, poses a constant challenge to traditional intelligent well completion solutions. End-user trends are increasingly focused on digitalization, sustainability, and the need for granular operational insights. Mergers and acquisitions (M&A) activities are prevalent, with substantial deal values, as companies seek to expand their technological portfolios, geographic reach, and customer base. For instance, the acquisition of smaller, specialized technology providers allows larger players to quickly integrate cutting-edge solutions.
Intelligent Well Completion Industry Industry Trends & Insights
The Intelligent Well Completion Industry is experiencing robust growth, driven by the undeniable imperative for optimizing hydrocarbon extraction from mature fields and maximizing the efficiency of new developments. The global market is projected to witness a significant Compound Annual Growth Rate (CAGR) of approximately 8.5% throughout the forecast period of 2025–2033, expanding from an estimated market size of $28.7 billion in the base year 2025 to over $56.2 billion by 2033. This expansion is underpinned by several key trends. Firstly, the relentless pursuit of operational efficiency and cost reduction in the upstream oil and gas sector remains a primary catalyst. Intelligent completions, by enabling remote monitoring, automated adjustments, and early detection of production anomalies, directly contribute to lowering operating expenditures and increasing hydrocarbon recovery rates, thereby enhancing profitability. Secondly, the increasing complexity of reservoir challenges, including unconventional resources and deepwater exploration, necessitates sophisticated completion solutions that can precisely manage production across multiple zones, optimize flow assurance, and improve well integrity. The adoption of digitalization and the Industrial Internet of Things (IIoT) is revolutionizing the intelligent well completion landscape. Real-time data streaming from downhole sensors, coupled with advanced analytics and AI, allows for proactive decision-making, predictive maintenance, and a deeper understanding of reservoir performance. This digital transformation enhances well productivity, reduces downtime, and minimizes the need for costly interventions. Furthermore, a growing emphasis on environmental, social, and governance (ESG) factors is indirectly boosting the demand for intelligent completions. These technologies contribute to reduced flaring, improved leak detection, and optimized energy consumption, aligning with the industry's sustainability goals. Consumer preferences are shifting towards solutions that offer greater transparency, control, and demonstrable return on investment. The competitive dynamics within the industry are intense, characterized by technological innovation, strategic partnerships, and global expansion. Companies are investing heavily in R&D to develop next-generation intelligent completion systems that offer greater reliability, enhanced functionality, and broader applicability across diverse operating environments. Market penetration of intelligent completion technologies is expected to deepen significantly as operators recognize their long-term value proposition.
Dominant Markets & Segments in Intelligent Well Completion Industry
The Intelligent Well Completion Industry exhibits distinct dominance across various geographical regions and market segments, driven by a complex interplay of resource availability, regulatory landscapes, and technological adoption rates.
Production Analysis: North America, particularly the United States and Canada, currently dominates production volumes, largely due to its extensive shale oil and gas reserves and the early and widespread adoption of advanced completion technologies in these unconventional plays. The region's mature fields also necessitate optimized production strategies, further driving demand for intelligent solutions.
Consumption Analysis: Similarly, North America leads in consumption, driven by the high number of active wells and the continuous push for enhanced oil recovery (EOR) and improved operational efficiency. The region's established infrastructure and its status as a major oil and gas producer create a consistent demand for intelligent well completion systems. The estimated consumption value in 2025 is projected to be approximately $15.2 billion.
Import Market Analysis (Value & Volume): Europe and Asia-Pacific represent significant import markets, particularly for specialized intelligent completion technologies and services. Countries in these regions with developing or maturing offshore and unconventional resources often rely on imports to access cutting-edge solutions. The import market value is anticipated to reach an estimated $7.8 billion in 2025.
- Key Drivers for Europe: Strict environmental regulations and the need to maximize production from mature North Sea fields drive imports of advanced intelligent completion technologies.
- Key Drivers for Asia-Pacific: Growing energy demand, coupled with exploration in challenging offshore environments and the development of unconventional resources in countries like China, fuels import activities.
Export Market Analysis (Value & Volume): The United States and Canada are major exporters of intelligent well completion equipment and services, leveraging their technological leadership and manufacturing capabilities. Their extensive experience in unconventional resource development provides a strong foundation for exporting advanced solutions globally. The export market value is estimated to be around $9.3 billion in 2025.
- Key Drivers: Technological innovation, cost-competitiveness, and the availability of skilled personnel in these regions contribute to their strong export performance.
Price Trend Analysis: The price trends in the intelligent well completion market are influenced by factors such as raw material costs, technological complexity, demand-supply dynamics, and the competitive landscape. While initial installation costs can be substantial, the long-term benefits in terms of increased production, reduced operational expenses, and improved well integrity often justify the investment. The overall price is expected to see a moderate upward trend due to the integration of more sophisticated digital technologies and increasing demand for high-performance solutions. The estimated average price per intelligent well completion system is projected to be around $1.8 million in 2025.
Intelligent Well Completion Industry Product Developments
Product innovation in the Intelligent Well Completion Industry is rapidly advancing, focusing on enhancing data acquisition, real-time control, and remote operational capabilities. Key developments include the integration of advanced sensor technologies for more precise reservoir monitoring, improved downhole communication systems for seamless data transfer, and intelligent actuators for automated flow control. The competitive advantage of these new products lies in their ability to provide operators with unparalleled visibility into well performance, enabling proactive interventions, optimized production, and reduced operational risks. These technological advancements are crucial for maximizing hydrocarbon recovery from increasingly complex and challenging reservoirs, thereby meeting the growing global energy demand.
Report Scope & Segmentation Analysis
This report provides a comprehensive analysis of the global Intelligent Well Completion Industry, encompassing the study period from 2019 to 2033, with a base year of 2025 and a forecast period from 2025 to 2033. The market is segmented based on key analytical parameters including:
Production Analysis: This segment analyzes the global output of intelligent well completion systems and related services, examining regional production capacities and the contribution of key manufacturing hubs. Growth projections for production are closely tied to the overall expansion of the oil and gas industry.
Consumption Analysis: This segment focuses on the demand for intelligent well completion solutions across various geographical regions and end-user applications. It evaluates market penetration rates and the factors influencing adoption, with an estimated market size of $15.2 billion in 2025.
Import Market Analysis (Value & Volume): This section details the inbound flow of intelligent well completion technologies and services into different countries and regions. It highlights key import destinations and the economic value of these transactions, with an estimated import market value of $7.8 billion in 2025.
Export Market Analysis (Value & Volume): This segment examines the outbound flow of intelligent well completion products and services from exporting nations. It assesses the global reach of key suppliers and the revenue generated from international sales, with an estimated export market value of $9.3 billion in 2025.
Price Trend Analysis: This segment provides insights into the historical and projected pricing dynamics of intelligent well completion systems and services. It considers factors such as technological advancements, material costs, and market competition, with an estimated average price per system of $1.8 million in 2025.
Key Drivers of Intelligent Well Completion Industry Growth
The growth of the Intelligent Well Completion Industry is propelled by a confluence of powerful drivers. The increasing demand for enhanced oil recovery (EOR) from mature fields is paramount, compelling operators to adopt sophisticated technologies that optimize hydrocarbon extraction. Technological advancements, particularly in sensor technology, real-time data analytics, and artificial intelligence (AI), are enabling more precise reservoir monitoring and control, leading to improved production efficiency and reduced operational costs. The relentless pursuit of operational efficiency and cost reduction within the upstream oil and gas sector further fuels the adoption of intelligent completions, as they offer significant savings through automation and predictive maintenance. Additionally, the growing complexity of unconventional and deepwater reservoir developments necessitates advanced completion solutions that can manage diverse production challenges.
Challenges in the Intelligent Well Completion Industry Sector
Despite its strong growth trajectory, the Intelligent Well Completion Industry faces several significant challenges. High initial capital investment for implementing advanced intelligent completion systems can be a deterrent for some operators, particularly smaller independent companies. The complexity of integration and maintenance of sophisticated downhole equipment and data management systems requires a highly skilled workforce, which can be a bottleneck. Furthermore, cybersecurity threats to connected intelligent systems pose a constant risk, necessitating robust security protocols. Fluctuations in oil prices can also impact investment decisions in new technologies, leading to periods of slowed adoption. Regulatory hurdles and standardization issues across different regions can also present challenges for global deployment.
Emerging Opportunities in Intelligent Well Completion Industry
The Intelligent Well Completion Industry is ripe with emerging opportunities, driven by innovation and evolving market demands. The increasing focus on digitalization and the Industrial Internet of Things (IIoT) presents a significant avenue for growth, enabling the development of integrated platforms for real-time monitoring, data analysis, and remote operational control. The burgeoning demand for predictive maintenance and AI-driven optimization solutions offers substantial potential for companies to enhance well performance and reduce downtime. Furthermore, the exploration and development of deepwater and ultra-deepwater fields, along with unconventional resources, will continue to drive the need for more advanced and robust intelligent completion technologies. The growing emphasis on environmental sustainability also creates opportunities for intelligent solutions that can minimize emissions and improve operational efficiency.
Leading Players in the Intelligent Well Completion Industry Market
- Superior Energy Services Inc
- Trican Well Service Ltd
- Weir Group PLC
- Weatherford International plc
- Schlumberger Ltd
- Packers Plus Energy Services Inc
- Baker Hughes Company
- Halliburton Company
- National-Oilwell Varco Inc
- Schoeller-Bleckmann Oilfield Equipment AG
- Welltec A/S
Key Developments in Intelligent Well Completion Industry Industry
- April 2022: Halliburton introduced StrataSta, a deep azimuthal resistivity service that provides multilayer visualization to maximize well contact with the reservoir and improve real-time reserve evaluation. The StrataStar service is an addition to Halliburton's iStar intelligent drilling and logging platform.
- February 2023: Baker Hughes announced the launch of new software aimed at improving efficiency and performance while reducing emissions from well completion.
Strategic Outlook for Intelligent Well Completion Industry Market
The strategic outlook for the Intelligent Well Completion Industry is exceptionally positive, characterized by sustained growth and transformative innovation. The increasing imperative for optimizing hydrocarbon recovery from existing and new reserves, coupled with the drive for operational efficiency and cost reduction, will continue to be the primary growth catalysts. Investments in digitalization, AI, and advanced sensor technologies will be crucial for companies to maintain a competitive edge. The development of solutions for challenging environments such as deepwater and unconventional plays will unlock significant market potential. Furthermore, the industry's alignment with ESG objectives through technologies that enhance safety and reduce environmental impact will solidify its long-term viability and attract further investment. The market is poised for continued expansion as operators increasingly recognize the indispensable role of intelligent well completions in achieving sustainable and profitable hydrocarbon production.
Intelligent Well Completion Industry Segmentation
- 1. Production Analysis
- 2. Consumption Analysis
- 3. Import Market Analysis (Value & Volume)
- 4. Export Market Analysis (Value & Volume)
- 5. Price Trend Analysis
Intelligent Well Completion Industry Segmentation By Geography
- 1. North America
- 2. Europe
- 3. Asia Pacific
- 4. South America
- 5. Middle East and Africa
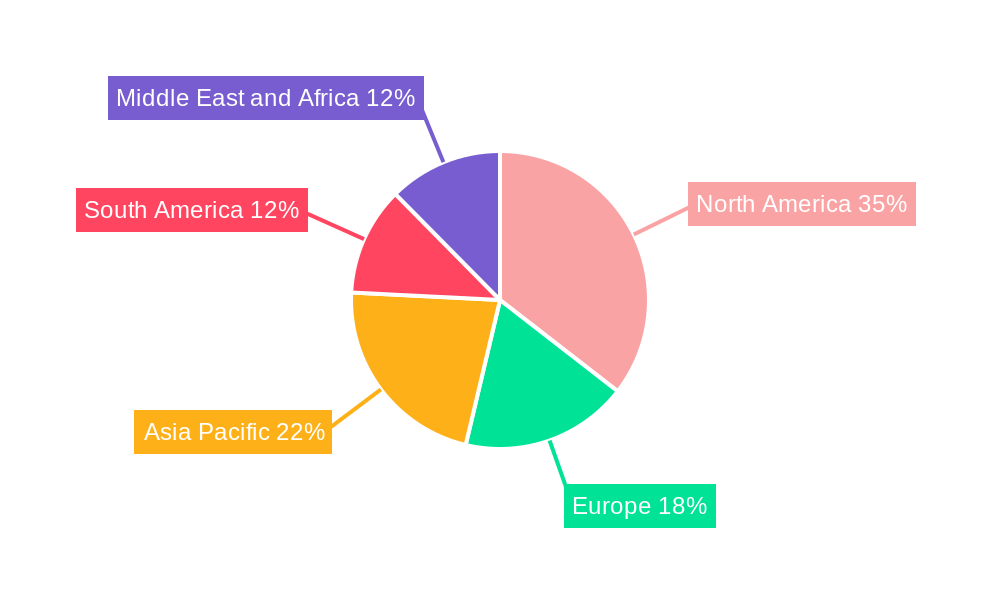
Intelligent Well Completion Industry Regional Market Share
Geographic Coverage of Intelligent Well Completion Industry
Intelligent Well Completion Industry REPORT HIGHLIGHTS
| Aspects | Details |
|---|---|
| Study Period | 2020-2034 |
| Base Year | 2025 |
| Estimated Year | 2026 |
| Forecast Period | 2026-2034 |
| Historical Period | 2020-2025 |
| Growth Rate | CAGR of 7.2% from 2020-2034 |
| Segmentation |
|
Table of Contents
- 1. Introduction
- 1.1. Research Scope
- 1.2. Market Segmentation
- 1.3. Research Objective
- 1.4. Definitions and Assumptions
- 2. Executive Summary
- 2.1. Market Snapshot
- 3. Market Dynamics
- 3.1. Market Drivers
- 3.2. Market Restrains
- 3.3. Market Trends
- 3.4. Market Opportunities
- 4. Market Factor Analysis
- 4.1. Porters Five Forces
- 4.1.1. Bargaining Power of Suppliers
- 4.1.2. Bargaining Power of Buyers
- 4.1.3. Threat of New Entrants
- 4.1.4. Threat of Substitutes
- 4.1.5. Competitive Rivalry
- 4.2. PESTEL analysis
- 4.3. BCG Analysis
- 4.3.1. Stars (High Growth, High Market Share)
- 4.3.2. Cash Cows (Low Growth, High Market Share)
- 4.3.3. Question Mark (High Growth, Low Market Share)
- 4.3.4. Dogs (Low Growth, Low Market Share)
- 4.4. Ansoff Matrix Analysis
- 4.5. Supply Chain Analysis
- 4.6. Regulatory Landscape
- 4.7. Current Market Potential and Opportunity Assessment (TAM–SAM–SOM Framework)
- 4.8. RAX Analyst Note
- 4.1. Porters Five Forces
- 5. Market Analysis, Insights and Forecast 2021-2033
- 5.1. Market Analysis, Insights and Forecast - by Production Analysis
- 5.2. Market Analysis, Insights and Forecast - by Consumption Analysis
- 5.3. Market Analysis, Insights and Forecast - by Import Market Analysis (Value & Volume)
- 5.4. Market Analysis, Insights and Forecast - by Export Market Analysis (Value & Volume)
- 5.5. Market Analysis, Insights and Forecast - by Price Trend Analysis
- 5.6. Market Analysis, Insights and Forecast - by Region
- 5.6.1. North America
- 5.6.2. Europe
- 5.6.3. Asia Pacific
- 5.6.4. South America
- 5.6.5. Middle East and Africa
- 6. Global Intelligent Well Completion Industry Analysis, Insights and Forecast, 2021-2033
- 6.1. Market Analysis, Insights and Forecast - by Production Analysis
- 6.2. Market Analysis, Insights and Forecast - by Consumption Analysis
- 6.3. Market Analysis, Insights and Forecast - by Import Market Analysis (Value & Volume)
- 6.4. Market Analysis, Insights and Forecast - by Export Market Analysis (Value & Volume)
- 6.5. Market Analysis, Insights and Forecast - by Price Trend Analysis
- 7. North America Intelligent Well Completion Industry Analysis, Insights and Forecast, 2020-2032
- 7.1. Market Analysis, Insights and Forecast - by Production Analysis
- 7.2. Market Analysis, Insights and Forecast - by Consumption Analysis
- 7.3. Market Analysis, Insights and Forecast - by Import Market Analysis (Value & Volume)
- 7.4. Market Analysis, Insights and Forecast - by Export Market Analysis (Value & Volume)
- 7.5. Market Analysis, Insights and Forecast - by Price Trend Analysis
- 8. Europe Intelligent Well Completion Industry Analysis, Insights and Forecast, 2020-2032
- 8.1. Market Analysis, Insights and Forecast - by Production Analysis
- 8.2. Market Analysis, Insights and Forecast - by Consumption Analysis
- 8.3. Market Analysis, Insights and Forecast - by Import Market Analysis (Value & Volume)
- 8.4. Market Analysis, Insights and Forecast - by Export Market Analysis (Value & Volume)
- 8.5. Market Analysis, Insights and Forecast - by Price Trend Analysis
- 9. Asia Pacific Intelligent Well Completion Industry Analysis, Insights and Forecast, 2020-2032
- 9.1. Market Analysis, Insights and Forecast - by Production Analysis
- 9.2. Market Analysis, Insights and Forecast - by Consumption Analysis
- 9.3. Market Analysis, Insights and Forecast - by Import Market Analysis (Value & Volume)
- 9.4. Market Analysis, Insights and Forecast - by Export Market Analysis (Value & Volume)
- 9.5. Market Analysis, Insights and Forecast - by Price Trend Analysis
- 10. South America Intelligent Well Completion Industry Analysis, Insights and Forecast, 2020-2032
- 10.1. Market Analysis, Insights and Forecast - by Production Analysis
- 10.2. Market Analysis, Insights and Forecast - by Consumption Analysis
- 10.3. Market Analysis, Insights and Forecast - by Import Market Analysis (Value & Volume)
- 10.4. Market Analysis, Insights and Forecast - by Export Market Analysis (Value & Volume)
- 10.5. Market Analysis, Insights and Forecast - by Price Trend Analysis
- 11. Middle East and Africa Intelligent Well Completion Industry Analysis, Insights and Forecast, 2020-2032
- 11.1. Market Analysis, Insights and Forecast - by Production Analysis
- 11.2. Market Analysis, Insights and Forecast - by Consumption Analysis
- 11.3. Market Analysis, Insights and Forecast - by Import Market Analysis (Value & Volume)
- 11.4. Market Analysis, Insights and Forecast - by Export Market Analysis (Value & Volume)
- 11.5. Market Analysis, Insights and Forecast - by Price Trend Analysis
- 12. Competitive Analysis
- 12.1. Company Profiles
- 12.1.1 Superior Energy Services Inc
- 12.1.1.1. Company Overview
- 12.1.1.2. Products
- 12.1.1.3. Company Financials
- 12.1.1.4. SWOT Analysis
- 12.1.2 Trican Well Service Ltd
- 12.1.2.1. Company Overview
- 12.1.2.2. Products
- 12.1.2.3. Company Financials
- 12.1.2.4. SWOT Analysis
- 12.1.3 Weir Group PLC
- 12.1.3.1. Company Overview
- 12.1.3.2. Products
- 12.1.3.3. Company Financials
- 12.1.3.4. SWOT Analysis
- 12.1.4 Weatherford International plc
- 12.1.4.1. Company Overview
- 12.1.4.2. Products
- 12.1.4.3. Company Financials
- 12.1.4.4. SWOT Analysis
- 12.1.5 Schlumberger Ltd
- 12.1.5.1. Company Overview
- 12.1.5.2. Products
- 12.1.5.3. Company Financials
- 12.1.5.4. SWOT Analysis
- 12.1.6 Packers Plus Energy Services Inc
- 12.1.6.1. Company Overview
- 12.1.6.2. Products
- 12.1.6.3. Company Financials
- 12.1.6.4. SWOT Analysis
- 12.1.7 Baker Hughes Company
- 12.1.7.1. Company Overview
- 12.1.7.2. Products
- 12.1.7.3. Company Financials
- 12.1.7.4. SWOT Analysis
- 12.1.8 Halliburton Company
- 12.1.8.1. Company Overview
- 12.1.8.2. Products
- 12.1.8.3. Company Financials
- 12.1.8.4. SWOT Analysis
- 12.1.9 National-Oilwell Varco Inc
- 12.1.9.1. Company Overview
- 12.1.9.2. Products
- 12.1.9.3. Company Financials
- 12.1.9.4. SWOT Analysis
- 12.1.10 Schoeller-Bleckmann Oilfield Equipment AG
- 12.1.10.1. Company Overview
- 12.1.10.2. Products
- 12.1.10.3. Company Financials
- 12.1.10.4. SWOT Analysis
- 12.1.11 Welltec A/S*List Not Exhaustive
- 12.1.11.1. Company Overview
- 12.1.11.2. Products
- 12.1.11.3. Company Financials
- 12.1.11.4. SWOT Analysis
- 12.1.1 Superior Energy Services Inc
- 12.2. Market Entropy
- 12.2.1 Company's Key Areas Served
- 12.2.2 Recent Developments
- 12.3. Company Market Share Analysis 2025
- 12.3.1 Top 5 Companies Market Share Analysis
- 12.3.2 Top 3 Companies Market Share Analysis
- 12.4. List of Potential Customers
- 13. Research Methodology
List of Figures
- Figure 1: Global Intelligent Well Completion Industry Revenue Breakdown (billion, %) by Region 2025 & 2033
- Figure 2: North America Intelligent Well Completion Industry Revenue (billion), by Production Analysis 2025 & 2033
- Figure 3: North America Intelligent Well Completion Industry Revenue Share (%), by Production Analysis 2025 & 2033
- Figure 4: North America Intelligent Well Completion Industry Revenue (billion), by Consumption Analysis 2025 & 2033
- Figure 5: North America Intelligent Well Completion Industry Revenue Share (%), by Consumption Analysis 2025 & 2033
- Figure 6: North America Intelligent Well Completion Industry Revenue (billion), by Import Market Analysis (Value & Volume) 2025 & 2033
- Figure 7: North America Intelligent Well Completion Industry Revenue Share (%), by Import Market Analysis (Value & Volume) 2025 & 2033
- Figure 8: North America Intelligent Well Completion Industry Revenue (billion), by Export Market Analysis (Value & Volume) 2025 & 2033
- Figure 9: North America Intelligent Well Completion Industry Revenue Share (%), by Export Market Analysis (Value & Volume) 2025 & 2033
- Figure 10: North America Intelligent Well Completion Industry Revenue (billion), by Price Trend Analysis 2025 & 2033
- Figure 11: North America Intelligent Well Completion Industry Revenue Share (%), by Price Trend Analysis 2025 & 2033
- Figure 12: North America Intelligent Well Completion Industry Revenue (billion), by Country 2025 & 2033
- Figure 13: North America Intelligent Well Completion Industry Revenue Share (%), by Country 2025 & 2033
- Figure 14: Europe Intelligent Well Completion Industry Revenue (billion), by Production Analysis 2025 & 2033
- Figure 15: Europe Intelligent Well Completion Industry Revenue Share (%), by Production Analysis 2025 & 2033
- Figure 16: Europe Intelligent Well Completion Industry Revenue (billion), by Consumption Analysis 2025 & 2033
- Figure 17: Europe Intelligent Well Completion Industry Revenue Share (%), by Consumption Analysis 2025 & 2033
- Figure 18: Europe Intelligent Well Completion Industry Revenue (billion), by Import Market Analysis (Value & Volume) 2025 & 2033
- Figure 19: Europe Intelligent Well Completion Industry Revenue Share (%), by Import Market Analysis (Value & Volume) 2025 & 2033
- Figure 20: Europe Intelligent Well Completion Industry Revenue (billion), by Export Market Analysis (Value & Volume) 2025 & 2033
- Figure 21: Europe Intelligent Well Completion Industry Revenue Share (%), by Export Market Analysis (Value & Volume) 2025 & 2033
- Figure 22: Europe Intelligent Well Completion Industry Revenue (billion), by Price Trend Analysis 2025 & 2033
- Figure 23: Europe Intelligent Well Completion Industry Revenue Share (%), by Price Trend Analysis 2025 & 2033
- Figure 24: Europe Intelligent Well Completion Industry Revenue (billion), by Country 2025 & 2033
- Figure 25: Europe Intelligent Well Completion Industry Revenue Share (%), by Country 2025 & 2033
- Figure 26: Asia Pacific Intelligent Well Completion Industry Revenue (billion), by Production Analysis 2025 & 2033
- Figure 27: Asia Pacific Intelligent Well Completion Industry Revenue Share (%), by Production Analysis 2025 & 2033
- Figure 28: Asia Pacific Intelligent Well Completion Industry Revenue (billion), by Consumption Analysis 2025 & 2033
- Figure 29: Asia Pacific Intelligent Well Completion Industry Revenue Share (%), by Consumption Analysis 2025 & 2033
- Figure 30: Asia Pacific Intelligent Well Completion Industry Revenue (billion), by Import Market Analysis (Value & Volume) 2025 & 2033
- Figure 31: Asia Pacific Intelligent Well Completion Industry Revenue Share (%), by Import Market Analysis (Value & Volume) 2025 & 2033
- Figure 32: Asia Pacific Intelligent Well Completion Industry Revenue (billion), by Export Market Analysis (Value & Volume) 2025 & 2033
- Figure 33: Asia Pacific Intelligent Well Completion Industry Revenue Share (%), by Export Market Analysis (Value & Volume) 2025 & 2033
- Figure 34: Asia Pacific Intelligent Well Completion Industry Revenue (billion), by Price Trend Analysis 2025 & 2033
- Figure 35: Asia Pacific Intelligent Well Completion Industry Revenue Share (%), by Price Trend Analysis 2025 & 2033
- Figure 36: Asia Pacific Intelligent Well Completion Industry Revenue (billion), by Country 2025 & 2033
- Figure 37: Asia Pacific Intelligent Well Completion Industry Revenue Share (%), by Country 2025 & 2033
- Figure 38: South America Intelligent Well Completion Industry Revenue (billion), by Production Analysis 2025 & 2033
- Figure 39: South America Intelligent Well Completion Industry Revenue Share (%), by Production Analysis 2025 & 2033
- Figure 40: South America Intelligent Well Completion Industry Revenue (billion), by Consumption Analysis 2025 & 2033
- Figure 41: South America Intelligent Well Completion Industry Revenue Share (%), by Consumption Analysis 2025 & 2033
- Figure 42: South America Intelligent Well Completion Industry Revenue (billion), by Import Market Analysis (Value & Volume) 2025 & 2033
- Figure 43: South America Intelligent Well Completion Industry Revenue Share (%), by Import Market Analysis (Value & Volume) 2025 & 2033
- Figure 44: South America Intelligent Well Completion Industry Revenue (billion), by Export Market Analysis (Value & Volume) 2025 & 2033
- Figure 45: South America Intelligent Well Completion Industry Revenue Share (%), by Export Market Analysis (Value & Volume) 2025 & 2033
- Figure 46: South America Intelligent Well Completion Industry Revenue (billion), by Price Trend Analysis 2025 & 2033
- Figure 47: South America Intelligent Well Completion Industry Revenue Share (%), by Price Trend Analysis 2025 & 2033
- Figure 48: South America Intelligent Well Completion Industry Revenue (billion), by Country 2025 & 2033
- Figure 49: South America Intelligent Well Completion Industry Revenue Share (%), by Country 2025 & 2033
- Figure 50: Middle East and Africa Intelligent Well Completion Industry Revenue (billion), by Production Analysis 2025 & 2033
- Figure 51: Middle East and Africa Intelligent Well Completion Industry Revenue Share (%), by Production Analysis 2025 & 2033
- Figure 52: Middle East and Africa Intelligent Well Completion Industry Revenue (billion), by Consumption Analysis 2025 & 2033
- Figure 53: Middle East and Africa Intelligent Well Completion Industry Revenue Share (%), by Consumption Analysis 2025 & 2033
- Figure 54: Middle East and Africa Intelligent Well Completion Industry Revenue (billion), by Import Market Analysis (Value & Volume) 2025 & 2033
- Figure 55: Middle East and Africa Intelligent Well Completion Industry Revenue Share (%), by Import Market Analysis (Value & Volume) 2025 & 2033
- Figure 56: Middle East and Africa Intelligent Well Completion Industry Revenue (billion), by Export Market Analysis (Value & Volume) 2025 & 2033
- Figure 57: Middle East and Africa Intelligent Well Completion Industry Revenue Share (%), by Export Market Analysis (Value & Volume) 2025 & 2033
- Figure 58: Middle East and Africa Intelligent Well Completion Industry Revenue (billion), by Price Trend Analysis 2025 & 2033
- Figure 59: Middle East and Africa Intelligent Well Completion Industry Revenue Share (%), by Price Trend Analysis 2025 & 2033
- Figure 60: Middle East and Africa Intelligent Well Completion Industry Revenue (billion), by Country 2025 & 2033
- Figure 61: Middle East and Africa Intelligent Well Completion Industry Revenue Share (%), by Country 2025 & 2033
List of Tables
- Table 1: Global Intelligent Well Completion Industry Revenue billion Forecast, by Production Analysis 2020 & 2033
- Table 2: Global Intelligent Well Completion Industry Revenue billion Forecast, by Consumption Analysis 2020 & 2033
- Table 3: Global Intelligent Well Completion Industry Revenue billion Forecast, by Import Market Analysis (Value & Volume) 2020 & 2033
- Table 4: Global Intelligent Well Completion Industry Revenue billion Forecast, by Export Market Analysis (Value & Volume) 2020 & 2033
- Table 5: Global Intelligent Well Completion Industry Revenue billion Forecast, by Price Trend Analysis 2020 & 2033
- Table 6: Global Intelligent Well Completion Industry Revenue billion Forecast, by Region 2020 & 2033
- Table 7: Global Intelligent Well Completion Industry Revenue billion Forecast, by Production Analysis 2020 & 2033
- Table 8: Global Intelligent Well Completion Industry Revenue billion Forecast, by Consumption Analysis 2020 & 2033
- Table 9: Global Intelligent Well Completion Industry Revenue billion Forecast, by Import Market Analysis (Value & Volume) 2020 & 2033
- Table 10: Global Intelligent Well Completion Industry Revenue billion Forecast, by Export Market Analysis (Value & Volume) 2020 & 2033
- Table 11: Global Intelligent Well Completion Industry Revenue billion Forecast, by Price Trend Analysis 2020 & 2033
- Table 12: Global Intelligent Well Completion Industry Revenue billion Forecast, by Country 2020 & 2033
- Table 13: Global Intelligent Well Completion Industry Revenue billion Forecast, by Production Analysis 2020 & 2033
- Table 14: Global Intelligent Well Completion Industry Revenue billion Forecast, by Consumption Analysis 2020 & 2033
- Table 15: Global Intelligent Well Completion Industry Revenue billion Forecast, by Import Market Analysis (Value & Volume) 2020 & 2033
- Table 16: Global Intelligent Well Completion Industry Revenue billion Forecast, by Export Market Analysis (Value & Volume) 2020 & 2033
- Table 17: Global Intelligent Well Completion Industry Revenue billion Forecast, by Price Trend Analysis 2020 & 2033
- Table 18: Global Intelligent Well Completion Industry Revenue billion Forecast, by Country 2020 & 2033
- Table 19: Global Intelligent Well Completion Industry Revenue billion Forecast, by Production Analysis 2020 & 2033
- Table 20: Global Intelligent Well Completion Industry Revenue billion Forecast, by Consumption Analysis 2020 & 2033
- Table 21: Global Intelligent Well Completion Industry Revenue billion Forecast, by Import Market Analysis (Value & Volume) 2020 & 2033
- Table 22: Global Intelligent Well Completion Industry Revenue billion Forecast, by Export Market Analysis (Value & Volume) 2020 & 2033
- Table 23: Global Intelligent Well Completion Industry Revenue billion Forecast, by Price Trend Analysis 2020 & 2033
- Table 24: Global Intelligent Well Completion Industry Revenue billion Forecast, by Country 2020 & 2033
- Table 25: Global Intelligent Well Completion Industry Revenue billion Forecast, by Production Analysis 2020 & 2033
- Table 26: Global Intelligent Well Completion Industry Revenue billion Forecast, by Consumption Analysis 2020 & 2033
- Table 27: Global Intelligent Well Completion Industry Revenue billion Forecast, by Import Market Analysis (Value & Volume) 2020 & 2033
- Table 28: Global Intelligent Well Completion Industry Revenue billion Forecast, by Export Market Analysis (Value & Volume) 2020 & 2033
- Table 29: Global Intelligent Well Completion Industry Revenue billion Forecast, by Price Trend Analysis 2020 & 2033
- Table 30: Global Intelligent Well Completion Industry Revenue billion Forecast, by Country 2020 & 2033
- Table 31: Global Intelligent Well Completion Industry Revenue billion Forecast, by Production Analysis 2020 & 2033
- Table 32: Global Intelligent Well Completion Industry Revenue billion Forecast, by Consumption Analysis 2020 & 2033
- Table 33: Global Intelligent Well Completion Industry Revenue billion Forecast, by Import Market Analysis (Value & Volume) 2020 & 2033
- Table 34: Global Intelligent Well Completion Industry Revenue billion Forecast, by Export Market Analysis (Value & Volume) 2020 & 2033
- Table 35: Global Intelligent Well Completion Industry Revenue billion Forecast, by Price Trend Analysis 2020 & 2033
- Table 36: Global Intelligent Well Completion Industry Revenue billion Forecast, by Country 2020 & 2033
Frequently Asked Questions
1. What is the projected Compound Annual Growth Rate (CAGR) of the Intelligent Well Completion Industry?
The projected CAGR is approximately 7.2%.
2. Which companies are prominent players in the Intelligent Well Completion Industry?
Key companies in the market include Superior Energy Services Inc, Trican Well Service Ltd, Weir Group PLC, Weatherford International plc, Schlumberger Ltd, Packers Plus Energy Services Inc, Baker Hughes Company, Halliburton Company, National-Oilwell Varco Inc, Schoeller-Bleckmann Oilfield Equipment AG, Welltec A/S*List Not Exhaustive.
3. What are the main segments of the Intelligent Well Completion Industry?
The market segments include Production Analysis, Consumption Analysis, Import Market Analysis (Value & Volume), Export Market Analysis (Value & Volume), Price Trend Analysis.
4. Can you provide details about the market size?
The market size is estimated to be USD 2.57 billion as of 2022.
5. What are some drivers contributing to market growth?
4.; Global Inclination toward Renewable-based Power Generation4.; Increased Power Demand in Line with the Increasing Population.
6. What are the notable trends driving market growth?
Offshore to be the Fastest Growing Segment.
7. Are there any restraints impacting market growth?
4.; High Initial Cost.
8. Can you provide examples of recent developments in the market?
April 2022: Halliburton introduced StrataSta, a deep azimuthal resistivity service that provides multilayer visualization to maximize well contact with the reservoir and improve real-time reserve evaluation. The StrataStar service is an addition to Halliburton's iStar intelligent drilling and logging platform.
9. What pricing options are available for accessing the report?
Pricing options include single-user, multi-user, and enterprise licenses priced at USD 4750, USD 5250, and USD 8750 respectively.
10. Is the market size provided in terms of value or volume?
The market size is provided in terms of value, measured in billion.
11. Are there any specific market keywords associated with the report?
Yes, the market keyword associated with the report is "Intelligent Well Completion Industry," which aids in identifying and referencing the specific market segment covered.
12. How do I determine which pricing option suits my needs best?
The pricing options vary based on user requirements and access needs. Individual users may opt for single-user licenses, while businesses requiring broader access may choose multi-user or enterprise licenses for cost-effective access to the report.
13. Are there any additional resources or data provided in the Intelligent Well Completion Industry report?
While the report offers comprehensive insights, it's advisable to review the specific contents or supplementary materials provided to ascertain if additional resources or data are available.
14. How can I stay updated on further developments or reports in the Intelligent Well Completion Industry?
To stay informed about further developments, trends, and reports in the Intelligent Well Completion Industry, consider subscribing to industry newsletters, following relevant companies and organizations, or regularly checking reputable industry news sources and publications.
Methodology
Step 1 - Identification of Relevant Samples Size from Population Database


Step 2 - Approaches for Defining Global Market Size (Value, Volume* & Price*)

Note*: In applicable scenarios
Step 3 - Data Sources
Primary Research
- Web Analytics
- Survey Reports
- Research Institute
- Latest Research Reports
- Opinion Leaders
Secondary Research
- Annual Reports
- White Paper
- Latest Press Release
- Industry Association
- Paid Database
- Investor Presentations

Step 4 - Data Triangulation
Involves using different sources of information in order to increase the validity of a study
These sources are likely to be stakeholders in a program - participants, other researchers, program staff, other community members, and so on.
Then we put all data in single framework & apply various statistical tools to find out the dynamic on the market.
During the analysis stage, feedback from the stakeholder groups would be compared to determine areas of agreement as well as areas of divergence

