

Key Insights
The interactive TV market is experiencing significant expansion, propelled by escalating demand for immersive entertainment and the widespread adoption of smart TVs featuring advanced functionalities. The market, valued at $63.89 billion in the base year of 2025, is projected to achieve a Compound Annual Growth Rate (CAGR) of 4.9%, reaching approximately $100 billion by 2033. This growth trajectory is primarily driven by the increasing availability of high-speed internet, the surging popularity of streaming platforms, continuous advancements in display technologies (including 8K and OLED), and the integration of sophisticated gaming features. Enhanced user engagement is further stimulated by the incorporation of voice assistants, intuitive user interfaces, and personalized content recommendations. Leading manufacturers such as Samsung, LG, Sony, and TCL are actively innovating, launching new models with cutting-edge features and prioritizing superior user experiences to solidify their market positions. Market segmentation indicates a strong consumer preference for larger screen sizes and premium functionalities, underscoring a growing willingness to invest in high-quality home entertainment solutions.
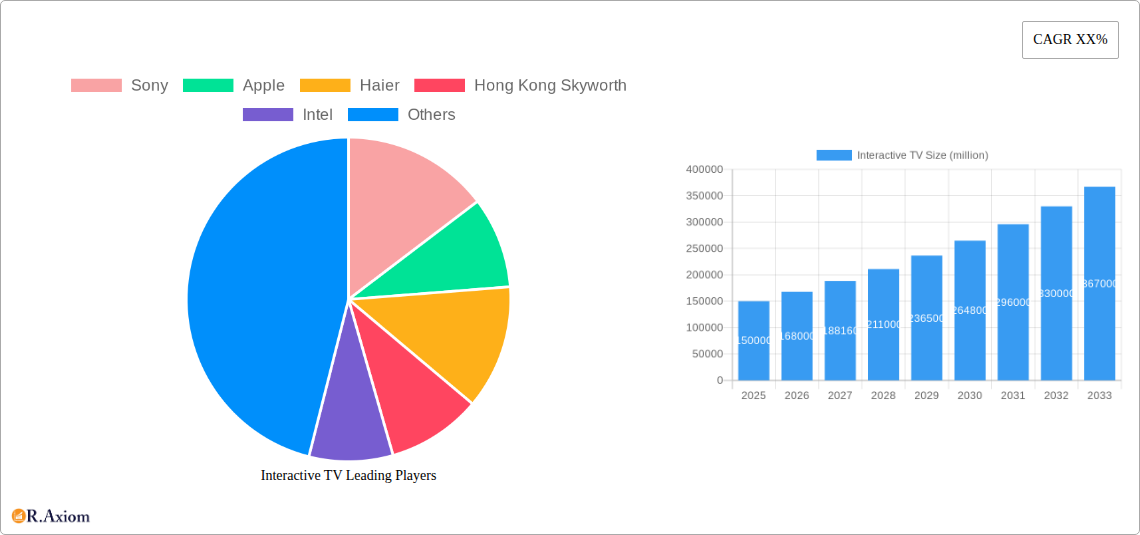
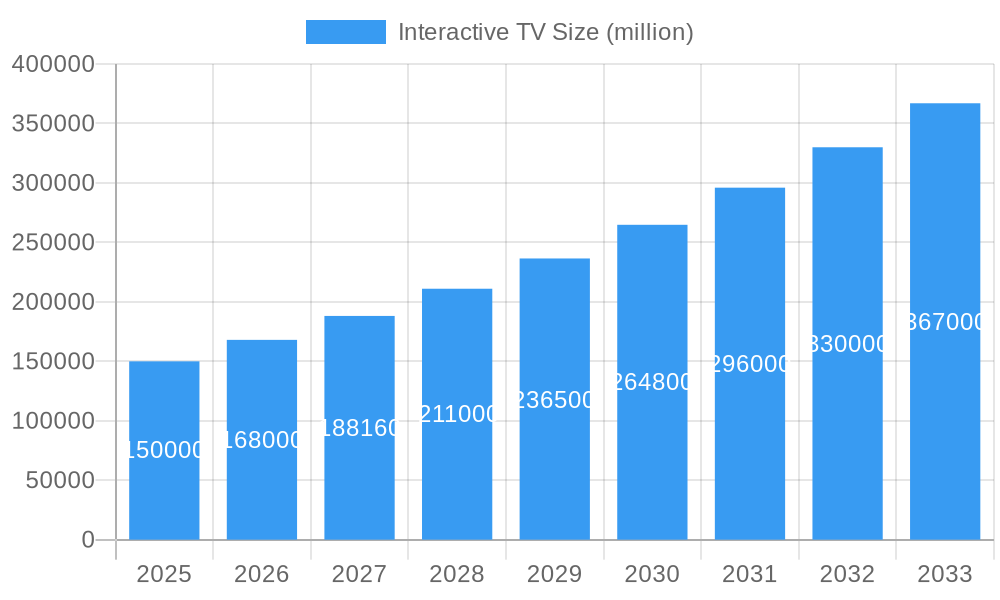
Interactive TV Market Size (In Billion)
While substantial growth potential exists, the market encounters certain obstacles. Cost remains a significant barrier to entry in emerging economies, potentially limiting broader market penetration. Additionally, concerns surrounding data privacy and security inherent in connected TV technology could temper widespread adoption. Nevertheless, continuous technological innovation, combined with manufacturers' strategies to introduce more accessible price points and proactively address privacy issues, is anticipated to alleviate these constraints. The competitive arena is currently led by established electronics giants, yet new entrants are consistently emerging, particularly in the domain of specialized interactive TV applications and services. The ongoing integration of smart home ecosystems and the expanding 5G infrastructure are poised to further accelerate market growth, cultivating a highly dynamic and profitable market environment.
Interactive TV Company Market Share
Interactive TV Market Report: 2019-2033
This comprehensive report provides an in-depth analysis of the global Interactive TV market, encompassing historical data (2019-2024), current estimations (2025), and future projections (2025-2033). The study delves into market dynamics, competitive landscapes, technological advancements, and emerging opportunities, offering actionable insights for industry stakeholders, investors, and businesses operating within the interactive television sector. The report covers major players such as Sony, Apple, Haier, Hong Kong Skyworth, Intel, Koninklijke Philips, Logitech International, Microsoft, Onida Electronics, Sharp, TCL, TechniSat Digital, Toshiba, Videocon Industries, Samsung Electronics, Panasonic, and LG Electronics, offering a granular understanding of their market positions and strategies. The total market value is projected to reach xx million by 2033.
Interactive TV Market Concentration & Innovation
The Interactive TV market exhibits a moderately concentrated landscape, with a few dominant players holding significant market share. While xx million in M&A activity was observed during the 2019-2024 period, the forecast for 2025-2033 suggests a potential increase to xx million, driven by strategic acquisitions and expansion efforts. Key innovation drivers include the integration of advanced technologies such as Artificial Intelligence (AI), 5G connectivity, and enhanced user interfaces. Stringent regulatory frameworks concerning data privacy and content licensing influence market dynamics. Product substitutes, such as streaming services and online gaming platforms, exert competitive pressure. End-user trends reveal a growing preference for personalized content and interactive experiences.
- Market Share: Samsung Electronics holds the largest market share (xx%), followed by LG Electronics (xx%) and Sony (xx%).
- M&A Activity: The majority of deals (xx%) involved companies focused on software and content integration, while hardware acquisitions comprised (xx%).
- Regulatory Frameworks: Stringent data privacy regulations in regions like Europe and North America are shaping the development of interactive TV platforms.
Interactive TV Industry Trends & Insights
The Interactive TV market is experiencing robust growth, with a projected CAGR of xx% during the forecast period (2025-2033). This growth is fueled by factors such as rising broadband penetration, increasing adoption of smart TVs, and the rising demand for immersive entertainment experiences. Technological disruptions, particularly advancements in AI and 5G, are driving innovation. Consumer preferences are shifting towards personalized content, interactive gaming, and seamless integration with other smart home devices. Competitive dynamics are characterized by fierce competition among established players and the emergence of new entrants. Market penetration is expected to reach xx% by 2033.
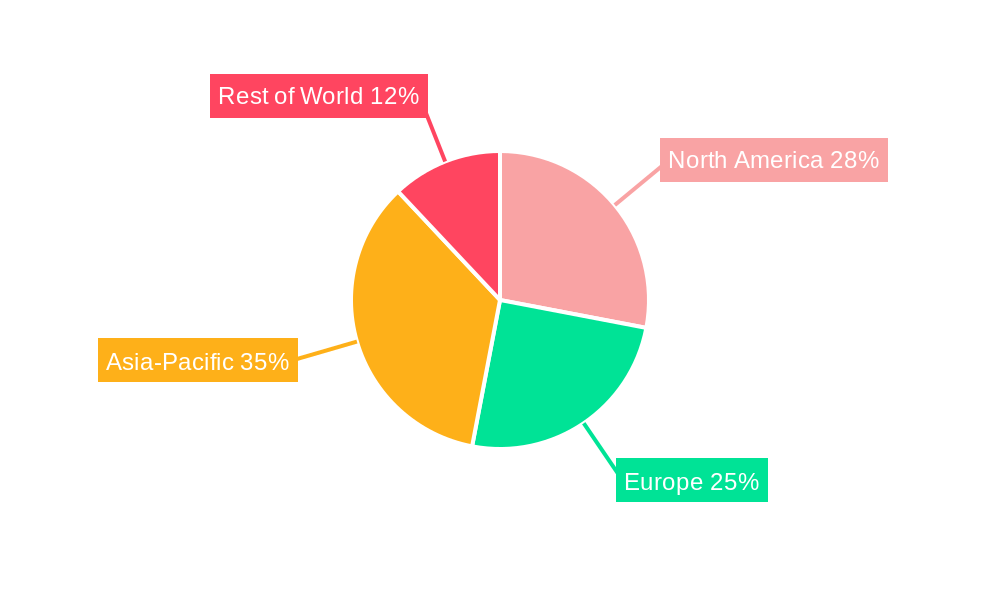
Dominant Markets & Segments in Interactive TV
The North American market currently holds the largest share of the Interactive TV market, driven by high disposable incomes, robust technological infrastructure, and early adoption of new technologies.
- Key Drivers in North America:
- High broadband penetration rates.
- Strong consumer demand for advanced entertainment features.
- Supportive regulatory environment.
- Significant investments in R&D by key players.
- Dominance Analysis: The dominance of North America is attributed to its advanced technological infrastructure, high consumer spending power, and established ecosystem of content providers and technology companies. However, Asia-Pacific is emerging as a rapidly growing region, with significant growth potential in countries like China and India.
Interactive TV Product Developments
Recent product innovations focus on enhanced user interfaces, improved voice control functionalities, and seamless integration with other smart home devices. Interactive gaming, personalized content recommendations, and augmented reality (AR) applications are emerging as key differentiators. The market is moving towards more intuitive and user-friendly interfaces, alongside increased personalization options.
Report Scope & Segmentation Analysis
The report segments the Interactive TV market based on technology (e.g., IPTV, Hybrid TV, OTT), screen size, resolution, application (e.g., gaming, entertainment, education), and region. Each segment’s growth projection, market size, and competitive dynamics are analyzed in detail. For example, the IPTV segment is projected to witness significant growth due to its affordability and widespread availability. The high-resolution segment is expected to gain traction driven by increasing demand for enhanced viewing experience.
Key Drivers of Interactive TV Growth
Several factors contribute to the growth of the Interactive TV market. Technological advancements in display technology, processing power, and network infrastructure play a crucial role. Economic factors, including rising disposable incomes and increasing consumer spending on entertainment, are further driving market growth. Supportive government policies and regulations promoting digitalization also contribute significantly.
Challenges in the Interactive TV Sector
The Interactive TV sector faces challenges such as high initial investment costs, the need for robust network infrastructure, and intense competition among players. Regulatory hurdles related to content licensing and data privacy also pose significant challenges. Supply chain disruptions can cause production delays and impact market availability.
Emerging Opportunities in Interactive TV
Emerging opportunities lie in the integration of AI-powered features, personalized content delivery, and the expansion into developing markets. The integration of virtual reality (VR) and augmented reality (AR) technologies offers significant potential for growth. Developing markets present untapped growth potential as consumer incomes rise and internet penetration increases.
Leading Players in the Interactive TV Market
- Sony
- Apple
- Haier
- Hong Kong Skyworth
- Intel
- Koninklijke Philips
- Logitech International
- Microsoft
- Onida Electronics
- Sharp
- TCL
- TechniSat Digital
- Toshiba
- Videocon Industries
- Samsung Electronics
- Panasonic
- LG Electronics
Key Developments in Interactive TV Industry
- 2022-Q4: Samsung launched its Neo QLED 8K TV with enhanced AI-powered features.
- 2023-Q1: LG Electronics partnered with a major content provider to offer personalized streaming services.
- 2023-Q2: Sony announced a new line of interactive TVs with advanced gaming capabilities.
- (Add further developments with year/month and impact on market dynamics)
Strategic Outlook for Interactive TV Market
The Interactive TV market is poised for continued growth, driven by technological innovation, expanding internet penetration, and evolving consumer preferences. Opportunities exist in the development of innovative features, expansion into new markets, and strategic partnerships to enhance content offerings and user experiences. The market's future success will depend on the ability of players to adapt to changing consumer demands and deliver engaging and personalized experiences.
Interactive TV Segmentation
-
1. Application
- 1.1. Household
- 1.2. Commercial
-
2. Types
- 2.1. Normal Version
- 2.2. Customised Version
Interactive TV Segmentation By Geography
-
1. North America
- 1.1. United States
- 1.2. Canada
- 1.3. Mexico
-
2. South America
- 2.1. Brazil
- 2.2. Argentina
- 2.3. Rest of South America
-
3. Europe
- 3.1. United Kingdom
- 3.2. Germany
- 3.3. France
- 3.4. Italy
- 3.5. Spain
- 3.6. Russia
- 3.7. Benelux
- 3.8. Nordics
- 3.9. Rest of Europe
-
4. Middle East & Africa
- 4.1. Turkey
- 4.2. Israel
- 4.3. GCC
- 4.4. North Africa
- 4.5. South Africa
- 4.6. Rest of Middle East & Africa
-
5. Asia Pacific
- 5.1. China
- 5.2. India
- 5.3. Japan
- 5.4. South Korea
- 5.5. ASEAN
- 5.6. Oceania
- 5.7. Rest of Asia Pacific
Interactive TV Regional Market Share
Geographic Coverage of Interactive TV
Interactive TV REPORT HIGHLIGHTS
| Aspects | Details |
|---|---|
| Study Period | 2020-2034 |
| Base Year | 2025 |
| Estimated Year | 2026 |
| Forecast Period | 2026-2034 |
| Historical Period | 2020-2025 |
| Growth Rate | CAGR of 4.9% from 2020-2034 |
| Segmentation |
|
Table of Contents
- 1. Introduction
- 1.1. Research Scope
- 1.2. Market Segmentation
- 1.3. Research Methodology
- 1.4. Definitions and Assumptions
- 2. Executive Summary
- 2.1. Introduction
- 3. Market Dynamics
- 3.1. Introduction
- 3.2. Market Drivers
- 3.3. Market Restrains
- 3.4. Market Trends
- 4. Market Factor Analysis
- 4.1. Porters Five Forces
- 4.2. Supply/Value Chain
- 4.3. PESTEL analysis
- 4.4. Market Entropy
- 4.5. Patent/Trademark Analysis
- 5. Global Interactive TV Analysis, Insights and Forecast, 2020-2032
- 5.1. Market Analysis, Insights and Forecast - by Application
- 5.1.1. Household
- 5.1.2. Commercial
- 5.2. Market Analysis, Insights and Forecast - by Types
- 5.2.1. Normal Version
- 5.2.2. Customised Version
- 5.3. Market Analysis, Insights and Forecast - by Region
- 5.3.1. North America
- 5.3.2. South America
- 5.3.3. Europe
- 5.3.4. Middle East & Africa
- 5.3.5. Asia Pacific
- 5.1. Market Analysis, Insights and Forecast - by Application
- 6. North America Interactive TV Analysis, Insights and Forecast, 2020-2032
- 6.1. Market Analysis, Insights and Forecast - by Application
- 6.1.1. Household
- 6.1.2. Commercial
- 6.2. Market Analysis, Insights and Forecast - by Types
- 6.2.1. Normal Version
- 6.2.2. Customised Version
- 6.1. Market Analysis, Insights and Forecast - by Application
- 7. South America Interactive TV Analysis, Insights and Forecast, 2020-2032
- 7.1. Market Analysis, Insights and Forecast - by Application
- 7.1.1. Household
- 7.1.2. Commercial
- 7.2. Market Analysis, Insights and Forecast - by Types
- 7.2.1. Normal Version
- 7.2.2. Customised Version
- 7.1. Market Analysis, Insights and Forecast - by Application
- 8. Europe Interactive TV Analysis, Insights and Forecast, 2020-2032
- 8.1. Market Analysis, Insights and Forecast - by Application
- 8.1.1. Household
- 8.1.2. Commercial
- 8.2. Market Analysis, Insights and Forecast - by Types
- 8.2.1. Normal Version
- 8.2.2. Customised Version
- 8.1. Market Analysis, Insights and Forecast - by Application
- 9. Middle East & Africa Interactive TV Analysis, Insights and Forecast, 2020-2032
- 9.1. Market Analysis, Insights and Forecast - by Application
- 9.1.1. Household
- 9.1.2. Commercial
- 9.2. Market Analysis, Insights and Forecast - by Types
- 9.2.1. Normal Version
- 9.2.2. Customised Version
- 9.1. Market Analysis, Insights and Forecast - by Application
- 10. Asia Pacific Interactive TV Analysis, Insights and Forecast, 2020-2032
- 10.1. Market Analysis, Insights and Forecast - by Application
- 10.1.1. Household
- 10.1.2. Commercial
- 10.2. Market Analysis, Insights and Forecast - by Types
- 10.2.1. Normal Version
- 10.2.2. Customised Version
- 10.1. Market Analysis, Insights and Forecast - by Application
- 11. Competitive Analysis
- 11.1. Global Market Share Analysis 2025
- 11.2. Company Profiles
- 11.2.1 Sony
- 11.2.1.1. Overview
- 11.2.1.2. Products
- 11.2.1.3. SWOT Analysis
- 11.2.1.4. Recent Developments
- 11.2.1.5. Financials (Based on Availability)
- 11.2.2 Apple
- 11.2.2.1. Overview
- 11.2.2.2. Products
- 11.2.2.3. SWOT Analysis
- 11.2.2.4. Recent Developments
- 11.2.2.5. Financials (Based on Availability)
- 11.2.3 Haier
- 11.2.3.1. Overview
- 11.2.3.2. Products
- 11.2.3.3. SWOT Analysis
- 11.2.3.4. Recent Developments
- 11.2.3.5. Financials (Based on Availability)
- 11.2.4 Hong Kong Skyworth
- 11.2.4.1. Overview
- 11.2.4.2. Products
- 11.2.4.3. SWOT Analysis
- 11.2.4.4. Recent Developments
- 11.2.4.5. Financials (Based on Availability)
- 11.2.5 Intel
- 11.2.5.1. Overview
- 11.2.5.2. Products
- 11.2.5.3. SWOT Analysis
- 11.2.5.4. Recent Developments
- 11.2.5.5. Financials (Based on Availability)
- 11.2.6 Koninklijke Philips
- 11.2.6.1. Overview
- 11.2.6.2. Products
- 11.2.6.3. SWOT Analysis
- 11.2.6.4. Recent Developments
- 11.2.6.5. Financials (Based on Availability)
- 11.2.7 Logitech International
- 11.2.7.1. Overview
- 11.2.7.2. Products
- 11.2.7.3. SWOT Analysis
- 11.2.7.4. Recent Developments
- 11.2.7.5. Financials (Based on Availability)
- 11.2.8 Microsoft
- 11.2.8.1. Overview
- 11.2.8.2. Products
- 11.2.8.3. SWOT Analysis
- 11.2.8.4. Recent Developments
- 11.2.8.5. Financials (Based on Availability)
- 11.2.9 Onida Electronics
- 11.2.9.1. Overview
- 11.2.9.2. Products
- 11.2.9.3. SWOT Analysis
- 11.2.9.4. Recent Developments
- 11.2.9.5. Financials (Based on Availability)
- 11.2.10 Sharp
- 11.2.10.1. Overview
- 11.2.10.2. Products
- 11.2.10.3. SWOT Analysis
- 11.2.10.4. Recent Developments
- 11.2.10.5. Financials (Based on Availability)
- 11.2.11 TCL
- 11.2.11.1. Overview
- 11.2.11.2. Products
- 11.2.11.3. SWOT Analysis
- 11.2.11.4. Recent Developments
- 11.2.11.5. Financials (Based on Availability)
- 11.2.12 TechniSat Digital
- 11.2.12.1. Overview
- 11.2.12.2. Products
- 11.2.12.3. SWOT Analysis
- 11.2.12.4. Recent Developments
- 11.2.12.5. Financials (Based on Availability)
- 11.2.13 Toshiba
- 11.2.13.1. Overview
- 11.2.13.2. Products
- 11.2.13.3. SWOT Analysis
- 11.2.13.4. Recent Developments
- 11.2.13.5. Financials (Based on Availability)
- 11.2.14 Videocon Industries
- 11.2.14.1. Overview
- 11.2.14.2. Products
- 11.2.14.3. SWOT Analysis
- 11.2.14.4. Recent Developments
- 11.2.14.5. Financials (Based on Availability)
- 11.2.15 Samsung Electronics
- 11.2.15.1. Overview
- 11.2.15.2. Products
- 11.2.15.3. SWOT Analysis
- 11.2.15.4. Recent Developments
- 11.2.15.5. Financials (Based on Availability)
- 11.2.16 Panasonic
- 11.2.16.1. Overview
- 11.2.16.2. Products
- 11.2.16.3. SWOT Analysis
- 11.2.16.4. Recent Developments
- 11.2.16.5. Financials (Based on Availability)
- 11.2.17 LG Electronics
- 11.2.17.1. Overview
- 11.2.17.2. Products
- 11.2.17.3. SWOT Analysis
- 11.2.17.4. Recent Developments
- 11.2.17.5. Financials (Based on Availability)
- 11.2.1 Sony
List of Figures
- Figure 1: Global Interactive TV Revenue Breakdown (billion, %) by Region 2025 & 2033
- Figure 2: Global Interactive TV Volume Breakdown (K, %) by Region 2025 & 2033
- Figure 3: North America Interactive TV Revenue (billion), by Application 2025 & 2033
- Figure 4: North America Interactive TV Volume (K), by Application 2025 & 2033
- Figure 5: North America Interactive TV Revenue Share (%), by Application 2025 & 2033
- Figure 6: North America Interactive TV Volume Share (%), by Application 2025 & 2033
- Figure 7: North America Interactive TV Revenue (billion), by Types 2025 & 2033
- Figure 8: North America Interactive TV Volume (K), by Types 2025 & 2033
- Figure 9: North America Interactive TV Revenue Share (%), by Types 2025 & 2033
- Figure 10: North America Interactive TV Volume Share (%), by Types 2025 & 2033
- Figure 11: North America Interactive TV Revenue (billion), by Country 2025 & 2033
- Figure 12: North America Interactive TV Volume (K), by Country 2025 & 2033
- Figure 13: North America Interactive TV Revenue Share (%), by Country 2025 & 2033
- Figure 14: North America Interactive TV Volume Share (%), by Country 2025 & 2033
- Figure 15: South America Interactive TV Revenue (billion), by Application 2025 & 2033
- Figure 16: South America Interactive TV Volume (K), by Application 2025 & 2033
- Figure 17: South America Interactive TV Revenue Share (%), by Application 2025 & 2033
- Figure 18: South America Interactive TV Volume Share (%), by Application 2025 & 2033
- Figure 19: South America Interactive TV Revenue (billion), by Types 2025 & 2033
- Figure 20: South America Interactive TV Volume (K), by Types 2025 & 2033
- Figure 21: South America Interactive TV Revenue Share (%), by Types 2025 & 2033
- Figure 22: South America Interactive TV Volume Share (%), by Types 2025 & 2033
- Figure 23: South America Interactive TV Revenue (billion), by Country 2025 & 2033
- Figure 24: South America Interactive TV Volume (K), by Country 2025 & 2033
- Figure 25: South America Interactive TV Revenue Share (%), by Country 2025 & 2033
- Figure 26: South America Interactive TV Volume Share (%), by Country 2025 & 2033
- Figure 27: Europe Interactive TV Revenue (billion), by Application 2025 & 2033
- Figure 28: Europe Interactive TV Volume (K), by Application 2025 & 2033
- Figure 29: Europe Interactive TV Revenue Share (%), by Application 2025 & 2033
- Figure 30: Europe Interactive TV Volume Share (%), by Application 2025 & 2033
- Figure 31: Europe Interactive TV Revenue (billion), by Types 2025 & 2033
- Figure 32: Europe Interactive TV Volume (K), by Types 2025 & 2033
- Figure 33: Europe Interactive TV Revenue Share (%), by Types 2025 & 2033
- Figure 34: Europe Interactive TV Volume Share (%), by Types 2025 & 2033
- Figure 35: Europe Interactive TV Revenue (billion), by Country 2025 & 2033
- Figure 36: Europe Interactive TV Volume (K), by Country 2025 & 2033
- Figure 37: Europe Interactive TV Revenue Share (%), by Country 2025 & 2033
- Figure 38: Europe Interactive TV Volume Share (%), by Country 2025 & 2033
- Figure 39: Middle East & Africa Interactive TV Revenue (billion), by Application 2025 & 2033
- Figure 40: Middle East & Africa Interactive TV Volume (K), by Application 2025 & 2033
- Figure 41: Middle East & Africa Interactive TV Revenue Share (%), by Application 2025 & 2033
- Figure 42: Middle East & Africa Interactive TV Volume Share (%), by Application 2025 & 2033
- Figure 43: Middle East & Africa Interactive TV Revenue (billion), by Types 2025 & 2033
- Figure 44: Middle East & Africa Interactive TV Volume (K), by Types 2025 & 2033
- Figure 45: Middle East & Africa Interactive TV Revenue Share (%), by Types 2025 & 2033
- Figure 46: Middle East & Africa Interactive TV Volume Share (%), by Types 2025 & 2033
- Figure 47: Middle East & Africa Interactive TV Revenue (billion), by Country 2025 & 2033
- Figure 48: Middle East & Africa Interactive TV Volume (K), by Country 2025 & 2033
- Figure 49: Middle East & Africa Interactive TV Revenue Share (%), by Country 2025 & 2033
- Figure 50: Middle East & Africa Interactive TV Volume Share (%), by Country 2025 & 2033
- Figure 51: Asia Pacific Interactive TV Revenue (billion), by Application 2025 & 2033
- Figure 52: Asia Pacific Interactive TV Volume (K), by Application 2025 & 2033
- Figure 53: Asia Pacific Interactive TV Revenue Share (%), by Application 2025 & 2033
- Figure 54: Asia Pacific Interactive TV Volume Share (%), by Application 2025 & 2033
- Figure 55: Asia Pacific Interactive TV Revenue (billion), by Types 2025 & 2033
- Figure 56: Asia Pacific Interactive TV Volume (K), by Types 2025 & 2033
- Figure 57: Asia Pacific Interactive TV Revenue Share (%), by Types 2025 & 2033
- Figure 58: Asia Pacific Interactive TV Volume Share (%), by Types 2025 & 2033
- Figure 59: Asia Pacific Interactive TV Revenue (billion), by Country 2025 & 2033
- Figure 60: Asia Pacific Interactive TV Volume (K), by Country 2025 & 2033
- Figure 61: Asia Pacific Interactive TV Revenue Share (%), by Country 2025 & 2033
- Figure 62: Asia Pacific Interactive TV Volume Share (%), by Country 2025 & 2033
List of Tables
- Table 1: Global Interactive TV Revenue billion Forecast, by Application 2020 & 2033
- Table 2: Global Interactive TV Volume K Forecast, by Application 2020 & 2033
- Table 3: Global Interactive TV Revenue billion Forecast, by Types 2020 & 2033
- Table 4: Global Interactive TV Volume K Forecast, by Types 2020 & 2033
- Table 5: Global Interactive TV Revenue billion Forecast, by Region 2020 & 2033
- Table 6: Global Interactive TV Volume K Forecast, by Region 2020 & 2033
- Table 7: Global Interactive TV Revenue billion Forecast, by Application 2020 & 2033
- Table 8: Global Interactive TV Volume K Forecast, by Application 2020 & 2033
- Table 9: Global Interactive TV Revenue billion Forecast, by Types 2020 & 2033
- Table 10: Global Interactive TV Volume K Forecast, by Types 2020 & 2033
- Table 11: Global Interactive TV Revenue billion Forecast, by Country 2020 & 2033
- Table 12: Global Interactive TV Volume K Forecast, by Country 2020 & 2033
- Table 13: United States Interactive TV Revenue (billion) Forecast, by Application 2020 & 2033
- Table 14: United States Interactive TV Volume (K) Forecast, by Application 2020 & 2033
- Table 15: Canada Interactive TV Revenue (billion) Forecast, by Application 2020 & 2033
- Table 16: Canada Interactive TV Volume (K) Forecast, by Application 2020 & 2033
- Table 17: Mexico Interactive TV Revenue (billion) Forecast, by Application 2020 & 2033
- Table 18: Mexico Interactive TV Volume (K) Forecast, by Application 2020 & 2033
- Table 19: Global Interactive TV Revenue billion Forecast, by Application 2020 & 2033
- Table 20: Global Interactive TV Volume K Forecast, by Application 2020 & 2033
- Table 21: Global Interactive TV Revenue billion Forecast, by Types 2020 & 2033
- Table 22: Global Interactive TV Volume K Forecast, by Types 2020 & 2033
- Table 23: Global Interactive TV Revenue billion Forecast, by Country 2020 & 2033
- Table 24: Global Interactive TV Volume K Forecast, by Country 2020 & 2033
- Table 25: Brazil Interactive TV Revenue (billion) Forecast, by Application 2020 & 2033
- Table 26: Brazil Interactive TV Volume (K) Forecast, by Application 2020 & 2033
- Table 27: Argentina Interactive TV Revenue (billion) Forecast, by Application 2020 & 2033
- Table 28: Argentina Interactive TV Volume (K) Forecast, by Application 2020 & 2033
- Table 29: Rest of South America Interactive TV Revenue (billion) Forecast, by Application 2020 & 2033
- Table 30: Rest of South America Interactive TV Volume (K) Forecast, by Application 2020 & 2033
- Table 31: Global Interactive TV Revenue billion Forecast, by Application 2020 & 2033
- Table 32: Global Interactive TV Volume K Forecast, by Application 2020 & 2033
- Table 33: Global Interactive TV Revenue billion Forecast, by Types 2020 & 2033
- Table 34: Global Interactive TV Volume K Forecast, by Types 2020 & 2033
- Table 35: Global Interactive TV Revenue billion Forecast, by Country 2020 & 2033
- Table 36: Global Interactive TV Volume K Forecast, by Country 2020 & 2033
- Table 37: United Kingdom Interactive TV Revenue (billion) Forecast, by Application 2020 & 2033
- Table 38: United Kingdom Interactive TV Volume (K) Forecast, by Application 2020 & 2033
- Table 39: Germany Interactive TV Revenue (billion) Forecast, by Application 2020 & 2033
- Table 40: Germany Interactive TV Volume (K) Forecast, by Application 2020 & 2033
- Table 41: France Interactive TV Revenue (billion) Forecast, by Application 2020 & 2033
- Table 42: France Interactive TV Volume (K) Forecast, by Application 2020 & 2033
- Table 43: Italy Interactive TV Revenue (billion) Forecast, by Application 2020 & 2033
- Table 44: Italy Interactive TV Volume (K) Forecast, by Application 2020 & 2033
- Table 45: Spain Interactive TV Revenue (billion) Forecast, by Application 2020 & 2033
- Table 46: Spain Interactive TV Volume (K) Forecast, by Application 2020 & 2033
- Table 47: Russia Interactive TV Revenue (billion) Forecast, by Application 2020 & 2033
- Table 48: Russia Interactive TV Volume (K) Forecast, by Application 2020 & 2033
- Table 49: Benelux Interactive TV Revenue (billion) Forecast, by Application 2020 & 2033
- Table 50: Benelux Interactive TV Volume (K) Forecast, by Application 2020 & 2033
- Table 51: Nordics Interactive TV Revenue (billion) Forecast, by Application 2020 & 2033
- Table 52: Nordics Interactive TV Volume (K) Forecast, by Application 2020 & 2033
- Table 53: Rest of Europe Interactive TV Revenue (billion) Forecast, by Application 2020 & 2033
- Table 54: Rest of Europe Interactive TV Volume (K) Forecast, by Application 2020 & 2033
- Table 55: Global Interactive TV Revenue billion Forecast, by Application 2020 & 2033
- Table 56: Global Interactive TV Volume K Forecast, by Application 2020 & 2033
- Table 57: Global Interactive TV Revenue billion Forecast, by Types 2020 & 2033
- Table 58: Global Interactive TV Volume K Forecast, by Types 2020 & 2033
- Table 59: Global Interactive TV Revenue billion Forecast, by Country 2020 & 2033
- Table 60: Global Interactive TV Volume K Forecast, by Country 2020 & 2033
- Table 61: Turkey Interactive TV Revenue (billion) Forecast, by Application 2020 & 2033
- Table 62: Turkey Interactive TV Volume (K) Forecast, by Application 2020 & 2033
- Table 63: Israel Interactive TV Revenue (billion) Forecast, by Application 2020 & 2033
- Table 64: Israel Interactive TV Volume (K) Forecast, by Application 2020 & 2033
- Table 65: GCC Interactive TV Revenue (billion) Forecast, by Application 2020 & 2033
- Table 66: GCC Interactive TV Volume (K) Forecast, by Application 2020 & 2033
- Table 67: North Africa Interactive TV Revenue (billion) Forecast, by Application 2020 & 2033
- Table 68: North Africa Interactive TV Volume (K) Forecast, by Application 2020 & 2033
- Table 69: South Africa Interactive TV Revenue (billion) Forecast, by Application 2020 & 2033
- Table 70: South Africa Interactive TV Volume (K) Forecast, by Application 2020 & 2033
- Table 71: Rest of Middle East & Africa Interactive TV Revenue (billion) Forecast, by Application 2020 & 2033
- Table 72: Rest of Middle East & Africa Interactive TV Volume (K) Forecast, by Application 2020 & 2033
- Table 73: Global Interactive TV Revenue billion Forecast, by Application 2020 & 2033
- Table 74: Global Interactive TV Volume K Forecast, by Application 2020 & 2033
- Table 75: Global Interactive TV Revenue billion Forecast, by Types 2020 & 2033
- Table 76: Global Interactive TV Volume K Forecast, by Types 2020 & 2033
- Table 77: Global Interactive TV Revenue billion Forecast, by Country 2020 & 2033
- Table 78: Global Interactive TV Volume K Forecast, by Country 2020 & 2033
- Table 79: China Interactive TV Revenue (billion) Forecast, by Application 2020 & 2033
- Table 80: China Interactive TV Volume (K) Forecast, by Application 2020 & 2033
- Table 81: India Interactive TV Revenue (billion) Forecast, by Application 2020 & 2033
- Table 82: India Interactive TV Volume (K) Forecast, by Application 2020 & 2033
- Table 83: Japan Interactive TV Revenue (billion) Forecast, by Application 2020 & 2033
- Table 84: Japan Interactive TV Volume (K) Forecast, by Application 2020 & 2033
- Table 85: South Korea Interactive TV Revenue (billion) Forecast, by Application 2020 & 2033
- Table 86: South Korea Interactive TV Volume (K) Forecast, by Application 2020 & 2033
- Table 87: ASEAN Interactive TV Revenue (billion) Forecast, by Application 2020 & 2033
- Table 88: ASEAN Interactive TV Volume (K) Forecast, by Application 2020 & 2033
- Table 89: Oceania Interactive TV Revenue (billion) Forecast, by Application 2020 & 2033
- Table 90: Oceania Interactive TV Volume (K) Forecast, by Application 2020 & 2033
- Table 91: Rest of Asia Pacific Interactive TV Revenue (billion) Forecast, by Application 2020 & 2033
- Table 92: Rest of Asia Pacific Interactive TV Volume (K) Forecast, by Application 2020 & 2033
Frequently Asked Questions
1. What is the projected Compound Annual Growth Rate (CAGR) of the Interactive TV?
The projected CAGR is approximately 4.9%.
2. Which companies are prominent players in the Interactive TV?
Key companies in the market include Sony, Apple, Haier, Hong Kong Skyworth, Intel, Koninklijke Philips, Logitech International, Microsoft, Onida Electronics, Sharp, TCL, TechniSat Digital, Toshiba, Videocon Industries, Samsung Electronics, Panasonic, LG Electronics.
3. What are the main segments of the Interactive TV?
The market segments include Application, Types.
4. Can you provide details about the market size?
The market size is estimated to be USD 63.89 billion as of 2022.
5. What are some drivers contributing to market growth?
N/A
6. What are the notable trends driving market growth?
N/A
7. Are there any restraints impacting market growth?
N/A
8. Can you provide examples of recent developments in the market?
N/A
9. What pricing options are available for accessing the report?
Pricing options include single-user, multi-user, and enterprise licenses priced at USD 3350.00, USD 5025.00, and USD 6700.00 respectively.
10. Is the market size provided in terms of value or volume?
The market size is provided in terms of value, measured in billion and volume, measured in K.
11. Are there any specific market keywords associated with the report?
Yes, the market keyword associated with the report is "Interactive TV," which aids in identifying and referencing the specific market segment covered.
12. How do I determine which pricing option suits my needs best?
The pricing options vary based on user requirements and access needs. Individual users may opt for single-user licenses, while businesses requiring broader access may choose multi-user or enterprise licenses for cost-effective access to the report.
13. Are there any additional resources or data provided in the Interactive TV report?
While the report offers comprehensive insights, it's advisable to review the specific contents or supplementary materials provided to ascertain if additional resources or data are available.
14. How can I stay updated on further developments or reports in the Interactive TV?
To stay informed about further developments, trends, and reports in the Interactive TV, consider subscribing to industry newsletters, following relevant companies and organizations, or regularly checking reputable industry news sources and publications.
Methodology
Step 1 - Identification of Relevant Samples Size from Population Database


Step 2 - Approaches for Defining Global Market Size (Value, Volume* & Price*)

Note*: In applicable scenarios
Step 3 - Data Sources
Primary Research
- Web Analytics
- Survey Reports
- Research Institute
- Latest Research Reports
- Opinion Leaders
Secondary Research
- Annual Reports
- White Paper
- Latest Press Release
- Industry Association
- Paid Database
- Investor Presentations

Step 4 - Data Triangulation
Involves using different sources of information in order to increase the validity of a study
These sources are likely to be stakeholders in a program - participants, other researchers, program staff, other community members, and so on.
Then we put all data in single framework & apply various statistical tools to find out the dynamic on the market.
During the analysis stage, feedback from the stakeholder groups would be compared to determine areas of agreement as well as areas of divergence