

Key Insights
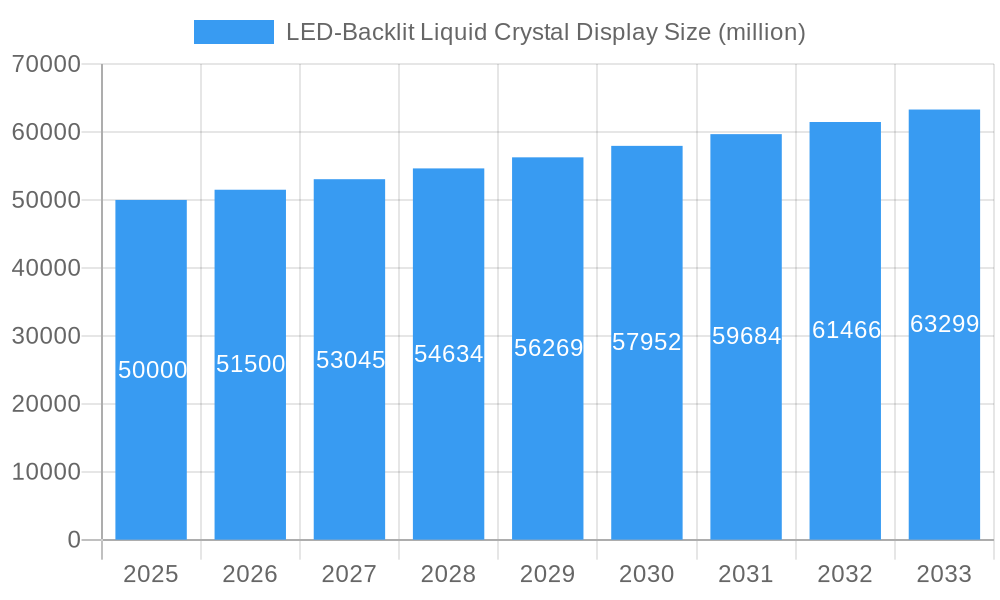
The LED-Backlit Liquid Crystal Display (LED-LCD) market is a mature yet dynamic sector, experiencing steady growth driven by persistent demand across various applications. While the initial explosive growth phase has subsided, the market continues to expand, fueled by ongoing technological advancements, cost reductions, and the inherent advantages of LED-LCD technology in terms of energy efficiency, brightness, and color reproduction compared to its predecessors. The market size in 2025 is estimated to be around $50 billion, with a Compound Annual Growth Rate (CAGR) of approximately 3-5% projected for the forecast period 2025-2033. This moderate yet consistent growth reflects the widespread adoption of LED-LCDs in consumer electronics (televisions, monitors), automotive displays, and commercial applications (signage, displays). Key drivers include the increasing demand for larger screen sizes, higher resolutions, and improved image quality, particularly in the high-end segment. Emerging trends such as mini-LED and micro-LED backlighting technologies are poised to further enhance display performance, leading to premium product offerings and segment-specific growth.
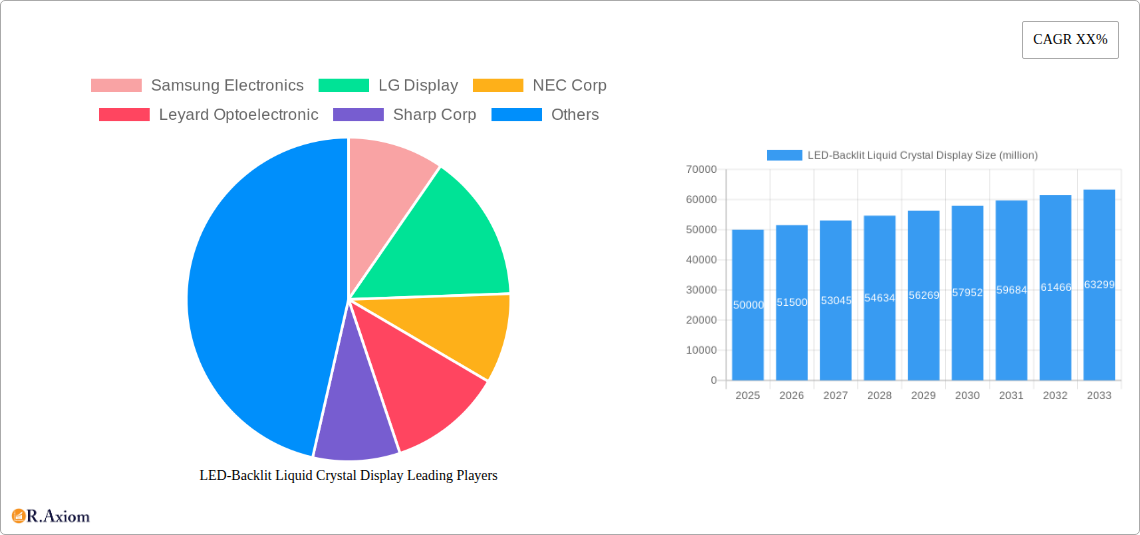
LED-Backlit Liquid Crystal Display Market Size (In Billion)
However, the market faces certain restraints. The rise of alternative display technologies, such as OLED and QLED, presents competition in the premium segment. Furthermore, fluctuations in raw material prices and geopolitical factors can impact manufacturing costs and overall market stability. Market segmentation is crucial, with consumer electronics continuing to dominate, but significant growth potential in automotive, commercial, and industrial applications. Key players like Samsung Electronics, LG Display, and others are continuously innovating to maintain their market share and address emerging challenges. The focus on sustainability and energy efficiency is driving the development of more eco-friendly LED-LCD panels, contributing to the long-term viability of the technology. Ultimately, the LED-LCD market is anticipated to remain a significant force in the display industry, adapting to technological advancements and evolving consumer demands throughout the forecast period.
LED-Backlit Liquid Crystal Display Company Market Share
LED-Backlit Liquid Crystal Display (LCD) Market Report: 2019-2033
This comprehensive report provides an in-depth analysis of the global LED-Backlit Liquid Crystal Display (LCD) market, offering actionable insights for industry stakeholders. Covering the period from 2019 to 2033, with a base year of 2025 and a forecast period of 2025-2033, this report examines market size, segmentation, key players, technological advancements, and future growth prospects. The report leverages extensive data analysis and industry expertise to deliver a precise and insightful overview of this dynamic market. This detailed analysis will help businesses understand the market's current state, anticipate future trends, and make informed strategic decisions. The market value is represented in millions of dollars.
LED-Backlit Liquid Crystal Display Market Concentration & Innovation
The LED-Backlit LCD market exhibits moderate concentration, with several key players dominating significant market shares. Samsung Electronics, LG Display, and Sharp Corp consistently hold leading positions, accounting for approximately xx million in revenue combined in 2025. NEC Corp, Leyard Optoelectronic, Barco NV, Sony Corp, TPV Technology Ltd, and AU Optronics Corp also contribute significantly, although their individual market shares are smaller. The market's innovative landscape is driven by continuous improvements in display resolution, brightness, and power efficiency. Mini-LED and micro-LED technologies are emerging as significant innovation drivers, improving picture quality and reducing power consumption. Stringent regulatory frameworks concerning energy efficiency and material usage influence product development. The increasing demand for larger, higher-resolution displays in various applications fuels this innovation. Substitutes such as OLED displays pose a competitive threat, but the cost-effectiveness of LCD technology continues to ensure its relevance. M&A activities within the industry are infrequent, with deal values in the xx million range over the historical period, reflecting a relatively stable competitive landscape.
- Market Leaders: Samsung Electronics, LG Display, Sharp Corp.
- Emerging Technologies: Mini-LED, Micro-LED.
- Key Regulatory Factors: Energy efficiency standards.
- Substitute Technologies: OLED displays.
- M&A Activity: Infrequent, with deal values typically in the xx million range.
LED-Backlit Liquid Crystal Display Industry Trends & Insights
The global LED-Backlit LCD market is characterized by steady growth, projected to achieve a CAGR of xx% during the forecast period (2025-2033). This growth is fueled by several factors, including the increasing demand for larger screen sizes in consumer electronics like televisions and monitors, the penetration of LCD technology in commercial displays for advertising and information dissemination, and the growing adoption of LCDs in the automotive industry for instrument panels and infotainment systems. Technological advancements, particularly the development of higher-resolution and more energy-efficient displays, are also significant drivers. Consumer preferences are shifting towards higher-resolution screens with improved color accuracy and wider viewing angles, prompting ongoing innovation in display technology. The competitive landscape is intense, with companies continuously striving to improve product features, reduce costs, and enhance their market position through strategic partnerships and technological advancements. Market penetration is currently at approximately xx%, with significant room for growth in emerging markets.
Dominant Markets & Segments in LED-Backlit Liquid Crystal Display
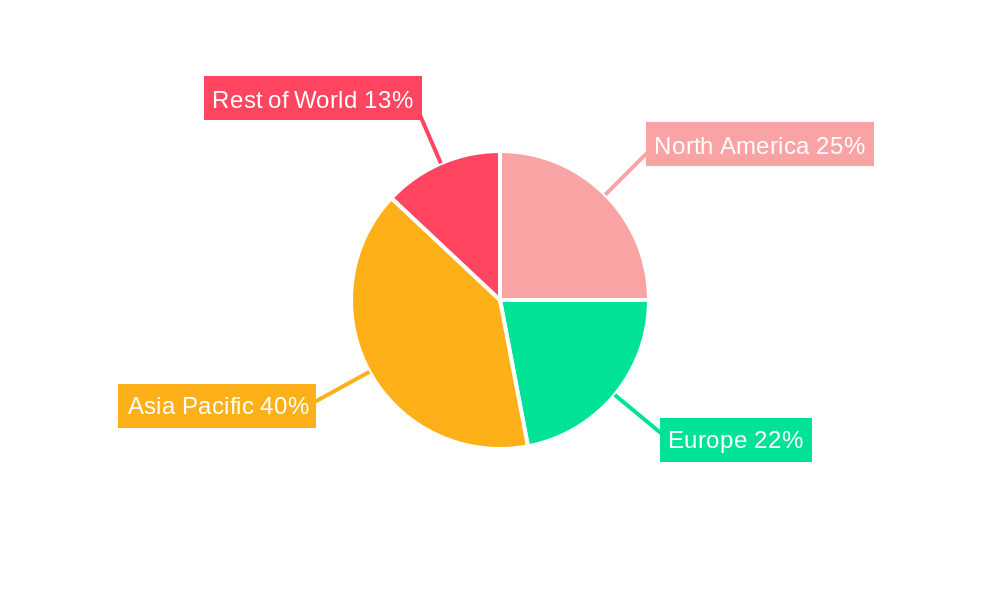
The Asia-Pacific region dominates the LED-Backlit LCD market, driven primarily by strong demand from China and other rapidly developing economies. China's robust manufacturing base, coupled with the rising disposable incomes and consumer electronics adoption, has fuelled exceptional growth in the region. Other significant markets include North America and Europe.
Key Drivers in Asia-Pacific:
- Rapidly expanding consumer electronics market.
- Strong manufacturing infrastructure in China.
- Rising disposable incomes.
- Government support for technology development.
Dominance Analysis: The dominance of the Asia-Pacific region is anticipated to continue throughout the forecast period, fueled by the factors mentioned above. The mature markets of North America and Europe show steady but less pronounced growth compared to the Asia-Pacific region.
LED-Backlit Liquid Crystal Display Product Developments
Recent product innovations in LED-Backlit LCD technology focus on enhancing picture quality, power efficiency, and design flexibility. Mini-LED backlights offer superior contrast ratios and local dimming capabilities, while advancements in LCD panel technology are leading to thinner and lighter displays. These developments cater to the increasing demand for high-quality displays across a wide range of applications, from televisions and monitors to automotive and industrial applications. The competitive advantage lies in offering superior image quality, energy efficiency, and affordability.
Report Scope & Segmentation Analysis
This report segments the LED-Backlit LCD market based on several factors, including screen size (small, medium, large), resolution (HD, Full HD, 4K, 8K), application (consumer electronics, commercial displays, automotive, industrial), and region (North America, Europe, Asia-Pacific, Rest of the World). Each segment displays unique growth trajectories, market sizes, and competitive dynamics. For example, the large screen size segment is expected to witness significant growth due to the increasing popularity of large-screen televisions and monitors. The Asia-Pacific region remains the largest market, while other regions show varied growth potential depending on specific economic conditions and consumer trends. Detailed projections for market size and growth are provided for each segment within the full report.
Key Drivers of LED-Backlit Liquid Crystal Display Growth
The LED-Backlit LCD market's growth is driven by several factors: the increasing demand for high-resolution displays in consumer electronics (smartphones, tablets, TVs), the growing adoption of LCD technology in commercial applications (digital signage, advertising displays), and the continuous technological advancements leading to cost reductions and improved performance. Government initiatives promoting energy efficiency and the rising disposable income in emerging economies are also significant contributors. The automotive industry's increasing demand for advanced driver-assistance systems (ADAS) is another key driver.
Challenges in the LED-Backlit Liquid Crystal Display Sector
The LED-Backlit LCD sector faces several challenges, including the increasing competition from OLED and other display technologies, stringent environmental regulations on material usage and energy consumption, and potential supply chain disruptions affecting component availability and pricing. These factors can significantly impact profitability and market share. The fluctuations in raw material prices and the need for continuous investment in R&D also present significant challenges. The estimated impact on the market due to these challenges is a reduction of xx million in annual revenue by 2033.
Emerging Opportunities in LED-Backlit Liquid Crystal Display
The market presents several emerging opportunities, including the expansion into niche applications like flexible displays and transparent displays. Advancements in mini-LED and micro-LED backlighting technologies are paving the way for high-dynamic-range (HDR) displays with improved contrast and color accuracy. The growing demand for larger and higher-resolution displays in gaming and virtual reality applications also presents significant opportunities. The exploration of sustainable materials and manufacturing processes aligns with environmental concerns and presents significant growth opportunities.
Leading Players in the LED-Backlit Liquid Crystal Display Market
- Samsung Electronics
- LG Display
- NEC Corp
- Leyard Optoelectronic
- Sharp Corp
- Barco NV
- Sony Corp
- TPV Technology Ltd
- AU Optronics Corp
Key Developments in LED-Backlit Liquid Crystal Display Industry
- 2022 Q4: Samsung Electronics launched its new Neo QLED TV line featuring advanced mini-LED backlighting.
- 2023 Q1: LG Display announced a significant investment in micro-LED production facilities.
- 2023 Q3: Sharp Corp partnered with a major automotive manufacturer to supply advanced LCD displays for in-car entertainment systems. (Further specific details on partnerships and product launches throughout the historical and forecast period are detailed in the full report.)
Strategic Outlook for LED-Backlit Liquid Crystal Display Market
The LED-Backlit LCD market is poised for continued growth, driven by technological innovation, expanding applications, and increasing demand from various sectors. While facing competition from emerging display technologies, LCDs will maintain a significant market share due to their cost-effectiveness and mature manufacturing infrastructure. The focus on improving energy efficiency, enhancing image quality, and exploring new applications will shape the future of this dynamic market. Strategic partnerships, technological advancements, and market penetration in emerging economies will be key to success in the coming years.
LED-Backlit Liquid Crystal Display Segmentation
-
1. Application
- 1.1. Electronics
- 1.2. Automotive
- 1.3. Aerospace
- 1.4. Consumer Goods
- 1.5. Others
-
2. Types
- 2.1. Curved Screen
- 2.2. Flat Screen
LED-Backlit Liquid Crystal Display Segmentation By Geography
-
1. North America
- 1.1. United States
- 1.2. Canada
- 1.3. Mexico
-
2. South America
- 2.1. Brazil
- 2.2. Argentina
- 2.3. Rest of South America
-
3. Europe
- 3.1. United Kingdom
- 3.2. Germany
- 3.3. France
- 3.4. Italy
- 3.5. Spain
- 3.6. Russia
- 3.7. Benelux
- 3.8. Nordics
- 3.9. Rest of Europe
-
4. Middle East & Africa
- 4.1. Turkey
- 4.2. Israel
- 4.3. GCC
- 4.4. North Africa
- 4.5. South Africa
- 4.6. Rest of Middle East & Africa
-
5. Asia Pacific
- 5.1. China
- 5.2. India
- 5.3. Japan
- 5.4. South Korea
- 5.5. ASEAN
- 5.6. Oceania
- 5.7. Rest of Asia Pacific
LED-Backlit Liquid Crystal Display Regional Market Share
Geographic Coverage of LED-Backlit Liquid Crystal Display
LED-Backlit Liquid Crystal Display REPORT HIGHLIGHTS
| Aspects | Details |
|---|---|
| Study Period | 2020-2034 |
| Base Year | 2025 |
| Estimated Year | 2026 |
| Forecast Period | 2026-2034 |
| Historical Period | 2020-2025 |
| Growth Rate | CAGR of XX% from 2020-2034 |
| Segmentation |
|
Table of Contents
- 1. Introduction
- 1.1. Research Scope
- 1.2. Market Segmentation
- 1.3. Research Objective
- 1.4. Definitions and Assumptions
- 2. Executive Summary
- 2.1. Market Snapshot
- 3. Market Dynamics
- 3.1. Market Drivers
- 3.2. Market Restrains
- 3.3. Market Trends
- 3.4. Market Opportunities
- 4. Market Factor Analysis
- 4.1. Porters Five Forces
- 4.1.1. Bargaining Power of Suppliers
- 4.1.2. Bargaining Power of Buyers
- 4.1.3. Threat of New Entrants
- 4.1.4. Threat of Substitutes
- 4.1.5. Competitive Rivalry
- 4.2. PESTEL analysis
- 4.3. BCG Analysis
- 4.3.1. Stars (High Growth, High Market Share)
- 4.3.2. Cash Cows (Low Growth, High Market Share)
- 4.3.3. Question Mark (High Growth, Low Market Share)
- 4.3.4. Dogs (Low Growth, Low Market Share)
- 4.4. Ansoff Matrix Analysis
- 4.5. Supply Chain Analysis
- 4.6. Regulatory Landscape
- 4.7. Current Market Potential and Opportunity Assessment (TAM–SAM–SOM Framework)
- 4.8. RAX Analyst Note
- 4.1. Porters Five Forces
- 5. Market Analysis, Insights and Forecast 2021-2033
- 5.1. Market Analysis, Insights and Forecast - by Application
- 5.1.1. Electronics
- 5.1.2. Automotive
- 5.1.3. Aerospace
- 5.1.4. Consumer Goods
- 5.1.5. Others
- 5.2. Market Analysis, Insights and Forecast - by Types
- 5.2.1. Curved Screen
- 5.2.2. Flat Screen
- 5.3. Market Analysis, Insights and Forecast - by Region
- 5.3.1. North America
- 5.3.2. South America
- 5.3.3. Europe
- 5.3.4. Middle East & Africa
- 5.3.5. Asia Pacific
- 5.1. Market Analysis, Insights and Forecast - by Application
- 6. Global LED-Backlit Liquid Crystal Display Analysis, Insights and Forecast, 2021-2033
- 6.1. Market Analysis, Insights and Forecast - by Application
- 6.1.1. Electronics
- 6.1.2. Automotive
- 6.1.3. Aerospace
- 6.1.4. Consumer Goods
- 6.1.5. Others
- 6.2. Market Analysis, Insights and Forecast - by Types
- 6.2.1. Curved Screen
- 6.2.2. Flat Screen
- 6.1. Market Analysis, Insights and Forecast - by Application
- 7. North America LED-Backlit Liquid Crystal Display Analysis, Insights and Forecast, 2020-2032
- 7.1. Market Analysis, Insights and Forecast - by Application
- 7.1.1. Electronics
- 7.1.2. Automotive
- 7.1.3. Aerospace
- 7.1.4. Consumer Goods
- 7.1.5. Others
- 7.2. Market Analysis, Insights and Forecast - by Types
- 7.2.1. Curved Screen
- 7.2.2. Flat Screen
- 7.1. Market Analysis, Insights and Forecast - by Application
- 8. South America LED-Backlit Liquid Crystal Display Analysis, Insights and Forecast, 2020-2032
- 8.1. Market Analysis, Insights and Forecast - by Application
- 8.1.1. Electronics
- 8.1.2. Automotive
- 8.1.3. Aerospace
- 8.1.4. Consumer Goods
- 8.1.5. Others
- 8.2. Market Analysis, Insights and Forecast - by Types
- 8.2.1. Curved Screen
- 8.2.2. Flat Screen
- 8.1. Market Analysis, Insights and Forecast - by Application
- 9. Europe LED-Backlit Liquid Crystal Display Analysis, Insights and Forecast, 2020-2032
- 9.1. Market Analysis, Insights and Forecast - by Application
- 9.1.1. Electronics
- 9.1.2. Automotive
- 9.1.3. Aerospace
- 9.1.4. Consumer Goods
- 9.1.5. Others
- 9.2. Market Analysis, Insights and Forecast - by Types
- 9.2.1. Curved Screen
- 9.2.2. Flat Screen
- 9.1. Market Analysis, Insights and Forecast - by Application
- 10. Middle East & Africa LED-Backlit Liquid Crystal Display Analysis, Insights and Forecast, 2020-2032
- 10.1. Market Analysis, Insights and Forecast - by Application
- 10.1.1. Electronics
- 10.1.2. Automotive
- 10.1.3. Aerospace
- 10.1.4. Consumer Goods
- 10.1.5. Others
- 10.2. Market Analysis, Insights and Forecast - by Types
- 10.2.1. Curved Screen
- 10.2.2. Flat Screen
- 10.1. Market Analysis, Insights and Forecast - by Application
- 11. Asia Pacific LED-Backlit Liquid Crystal Display Analysis, Insights and Forecast, 2020-2032
- 11.1. Market Analysis, Insights and Forecast - by Application
- 11.1.1. Electronics
- 11.1.2. Automotive
- 11.1.3. Aerospace
- 11.1.4. Consumer Goods
- 11.1.5. Others
- 11.2. Market Analysis, Insights and Forecast - by Types
- 11.2.1. Curved Screen
- 11.2.2. Flat Screen
- 11.1. Market Analysis, Insights and Forecast - by Application
- 12. Competitive Analysis
- 12.1. Company Profiles
- 12.1.1 Samsung Electronics
- 12.1.1.1. Company Overview
- 12.1.1.2. Products
- 12.1.1.3. Company Financials
- 12.1.1.4. SWOT Analysis
- 12.1.2 LG Display
- 12.1.2.1. Company Overview
- 12.1.2.2. Products
- 12.1.2.3. Company Financials
- 12.1.2.4. SWOT Analysis
- 12.1.3 NEC Corp
- 12.1.3.1. Company Overview
- 12.1.3.2. Products
- 12.1.3.3. Company Financials
- 12.1.3.4. SWOT Analysis
- 12.1.4 Leyard Optoelectronic
- 12.1.4.1. Company Overview
- 12.1.4.2. Products
- 12.1.4.3. Company Financials
- 12.1.4.4. SWOT Analysis
- 12.1.5 Sharp Corp
- 12.1.5.1. Company Overview
- 12.1.5.2. Products
- 12.1.5.3. Company Financials
- 12.1.5.4. SWOT Analysis
- 12.1.6 Barco NV
- 12.1.6.1. Company Overview
- 12.1.6.2. Products
- 12.1.6.3. Company Financials
- 12.1.6.4. SWOT Analysis
- 12.1.7 Sony Corp
- 12.1.7.1. Company Overview
- 12.1.7.2. Products
- 12.1.7.3. Company Financials
- 12.1.7.4. SWOT Analysis
- 12.1.8 TPV Technology Ltd
- 12.1.8.1. Company Overview
- 12.1.8.2. Products
- 12.1.8.3. Company Financials
- 12.1.8.4. SWOT Analysis
- 12.1.9 AU Optronics Corp
- 12.1.9.1. Company Overview
- 12.1.9.2. Products
- 12.1.9.3. Company Financials
- 12.1.9.4. SWOT Analysis
- 12.1.1 Samsung Electronics
- 12.2. Market Entropy
- 12.2.1 Company's Key Areas Served
- 12.2.2 Recent Developments
- 12.3. Company Market Share Analysis 2025
- 12.3.1 Top 5 Companies Market Share Analysis
- 12.3.2 Top 3 Companies Market Share Analysis
- 12.4. List of Potential Customers
- 13. Research Methodology
List of Figures
- Figure 1: Global LED-Backlit Liquid Crystal Display Revenue Breakdown (million, %) by Region 2025 & 2033
- Figure 2: Global LED-Backlit Liquid Crystal Display Volume Breakdown (K, %) by Region 2025 & 2033
- Figure 3: North America LED-Backlit Liquid Crystal Display Revenue (million), by Application 2025 & 2033
- Figure 4: North America LED-Backlit Liquid Crystal Display Volume (K), by Application 2025 & 2033
- Figure 5: North America LED-Backlit Liquid Crystal Display Revenue Share (%), by Application 2025 & 2033
- Figure 6: North America LED-Backlit Liquid Crystal Display Volume Share (%), by Application 2025 & 2033
- Figure 7: North America LED-Backlit Liquid Crystal Display Revenue (million), by Types 2025 & 2033
- Figure 8: North America LED-Backlit Liquid Crystal Display Volume (K), by Types 2025 & 2033
- Figure 9: North America LED-Backlit Liquid Crystal Display Revenue Share (%), by Types 2025 & 2033
- Figure 10: North America LED-Backlit Liquid Crystal Display Volume Share (%), by Types 2025 & 2033
- Figure 11: North America LED-Backlit Liquid Crystal Display Revenue (million), by Country 2025 & 2033
- Figure 12: North America LED-Backlit Liquid Crystal Display Volume (K), by Country 2025 & 2033
- Figure 13: North America LED-Backlit Liquid Crystal Display Revenue Share (%), by Country 2025 & 2033
- Figure 14: North America LED-Backlit Liquid Crystal Display Volume Share (%), by Country 2025 & 2033
- Figure 15: South America LED-Backlit Liquid Crystal Display Revenue (million), by Application 2025 & 2033
- Figure 16: South America LED-Backlit Liquid Crystal Display Volume (K), by Application 2025 & 2033
- Figure 17: South America LED-Backlit Liquid Crystal Display Revenue Share (%), by Application 2025 & 2033
- Figure 18: South America LED-Backlit Liquid Crystal Display Volume Share (%), by Application 2025 & 2033
- Figure 19: South America LED-Backlit Liquid Crystal Display Revenue (million), by Types 2025 & 2033
- Figure 20: South America LED-Backlit Liquid Crystal Display Volume (K), by Types 2025 & 2033
- Figure 21: South America LED-Backlit Liquid Crystal Display Revenue Share (%), by Types 2025 & 2033
- Figure 22: South America LED-Backlit Liquid Crystal Display Volume Share (%), by Types 2025 & 2033
- Figure 23: South America LED-Backlit Liquid Crystal Display Revenue (million), by Country 2025 & 2033
- Figure 24: South America LED-Backlit Liquid Crystal Display Volume (K), by Country 2025 & 2033
- Figure 25: South America LED-Backlit Liquid Crystal Display Revenue Share (%), by Country 2025 & 2033
- Figure 26: South America LED-Backlit Liquid Crystal Display Volume Share (%), by Country 2025 & 2033
- Figure 27: Europe LED-Backlit Liquid Crystal Display Revenue (million), by Application 2025 & 2033
- Figure 28: Europe LED-Backlit Liquid Crystal Display Volume (K), by Application 2025 & 2033
- Figure 29: Europe LED-Backlit Liquid Crystal Display Revenue Share (%), by Application 2025 & 2033
- Figure 30: Europe LED-Backlit Liquid Crystal Display Volume Share (%), by Application 2025 & 2033
- Figure 31: Europe LED-Backlit Liquid Crystal Display Revenue (million), by Types 2025 & 2033
- Figure 32: Europe LED-Backlit Liquid Crystal Display Volume (K), by Types 2025 & 2033
- Figure 33: Europe LED-Backlit Liquid Crystal Display Revenue Share (%), by Types 2025 & 2033
- Figure 34: Europe LED-Backlit Liquid Crystal Display Volume Share (%), by Types 2025 & 2033
- Figure 35: Europe LED-Backlit Liquid Crystal Display Revenue (million), by Country 2025 & 2033
- Figure 36: Europe LED-Backlit Liquid Crystal Display Volume (K), by Country 2025 & 2033
- Figure 37: Europe LED-Backlit Liquid Crystal Display Revenue Share (%), by Country 2025 & 2033
- Figure 38: Europe LED-Backlit Liquid Crystal Display Volume Share (%), by Country 2025 & 2033
- Figure 39: Middle East & Africa LED-Backlit Liquid Crystal Display Revenue (million), by Application 2025 & 2033
- Figure 40: Middle East & Africa LED-Backlit Liquid Crystal Display Volume (K), by Application 2025 & 2033
- Figure 41: Middle East & Africa LED-Backlit Liquid Crystal Display Revenue Share (%), by Application 2025 & 2033
- Figure 42: Middle East & Africa LED-Backlit Liquid Crystal Display Volume Share (%), by Application 2025 & 2033
- Figure 43: Middle East & Africa LED-Backlit Liquid Crystal Display Revenue (million), by Types 2025 & 2033
- Figure 44: Middle East & Africa LED-Backlit Liquid Crystal Display Volume (K), by Types 2025 & 2033
- Figure 45: Middle East & Africa LED-Backlit Liquid Crystal Display Revenue Share (%), by Types 2025 & 2033
- Figure 46: Middle East & Africa LED-Backlit Liquid Crystal Display Volume Share (%), by Types 2025 & 2033
- Figure 47: Middle East & Africa LED-Backlit Liquid Crystal Display Revenue (million), by Country 2025 & 2033
- Figure 48: Middle East & Africa LED-Backlit Liquid Crystal Display Volume (K), by Country 2025 & 2033
- Figure 49: Middle East & Africa LED-Backlit Liquid Crystal Display Revenue Share (%), by Country 2025 & 2033
- Figure 50: Middle East & Africa LED-Backlit Liquid Crystal Display Volume Share (%), by Country 2025 & 2033
- Figure 51: Asia Pacific LED-Backlit Liquid Crystal Display Revenue (million), by Application 2025 & 2033
- Figure 52: Asia Pacific LED-Backlit Liquid Crystal Display Volume (K), by Application 2025 & 2033
- Figure 53: Asia Pacific LED-Backlit Liquid Crystal Display Revenue Share (%), by Application 2025 & 2033
- Figure 54: Asia Pacific LED-Backlit Liquid Crystal Display Volume Share (%), by Application 2025 & 2033
- Figure 55: Asia Pacific LED-Backlit Liquid Crystal Display Revenue (million), by Types 2025 & 2033
- Figure 56: Asia Pacific LED-Backlit Liquid Crystal Display Volume (K), by Types 2025 & 2033
- Figure 57: Asia Pacific LED-Backlit Liquid Crystal Display Revenue Share (%), by Types 2025 & 2033
- Figure 58: Asia Pacific LED-Backlit Liquid Crystal Display Volume Share (%), by Types 2025 & 2033
- Figure 59: Asia Pacific LED-Backlit Liquid Crystal Display Revenue (million), by Country 2025 & 2033
- Figure 60: Asia Pacific LED-Backlit Liquid Crystal Display Volume (K), by Country 2025 & 2033
- Figure 61: Asia Pacific LED-Backlit Liquid Crystal Display Revenue Share (%), by Country 2025 & 2033
- Figure 62: Asia Pacific LED-Backlit Liquid Crystal Display Volume Share (%), by Country 2025 & 2033
List of Tables
- Table 1: Global LED-Backlit Liquid Crystal Display Revenue million Forecast, by Application 2020 & 2033
- Table 2: Global LED-Backlit Liquid Crystal Display Volume K Forecast, by Application 2020 & 2033
- Table 3: Global LED-Backlit Liquid Crystal Display Revenue million Forecast, by Types 2020 & 2033
- Table 4: Global LED-Backlit Liquid Crystal Display Volume K Forecast, by Types 2020 & 2033
- Table 5: Global LED-Backlit Liquid Crystal Display Revenue million Forecast, by Region 2020 & 2033
- Table 6: Global LED-Backlit Liquid Crystal Display Volume K Forecast, by Region 2020 & 2033
- Table 7: Global LED-Backlit Liquid Crystal Display Revenue million Forecast, by Application 2020 & 2033
- Table 8: Global LED-Backlit Liquid Crystal Display Volume K Forecast, by Application 2020 & 2033
- Table 9: Global LED-Backlit Liquid Crystal Display Revenue million Forecast, by Types 2020 & 2033
- Table 10: Global LED-Backlit Liquid Crystal Display Volume K Forecast, by Types 2020 & 2033
- Table 11: Global LED-Backlit Liquid Crystal Display Revenue million Forecast, by Country 2020 & 2033
- Table 12: Global LED-Backlit Liquid Crystal Display Volume K Forecast, by Country 2020 & 2033
- Table 13: United States LED-Backlit Liquid Crystal Display Revenue (million) Forecast, by Application 2020 & 2033
- Table 14: United States LED-Backlit Liquid Crystal Display Volume (K) Forecast, by Application 2020 & 2033
- Table 15: Canada LED-Backlit Liquid Crystal Display Revenue (million) Forecast, by Application 2020 & 2033
- Table 16: Canada LED-Backlit Liquid Crystal Display Volume (K) Forecast, by Application 2020 & 2033
- Table 17: Mexico LED-Backlit Liquid Crystal Display Revenue (million) Forecast, by Application 2020 & 2033
- Table 18: Mexico LED-Backlit Liquid Crystal Display Volume (K) Forecast, by Application 2020 & 2033
- Table 19: Global LED-Backlit Liquid Crystal Display Revenue million Forecast, by Application 2020 & 2033
- Table 20: Global LED-Backlit Liquid Crystal Display Volume K Forecast, by Application 2020 & 2033
- Table 21: Global LED-Backlit Liquid Crystal Display Revenue million Forecast, by Types 2020 & 2033
- Table 22: Global LED-Backlit Liquid Crystal Display Volume K Forecast, by Types 2020 & 2033
- Table 23: Global LED-Backlit Liquid Crystal Display Revenue million Forecast, by Country 2020 & 2033
- Table 24: Global LED-Backlit Liquid Crystal Display Volume K Forecast, by Country 2020 & 2033
- Table 25: Brazil LED-Backlit Liquid Crystal Display Revenue (million) Forecast, by Application 2020 & 2033
- Table 26: Brazil LED-Backlit Liquid Crystal Display Volume (K) Forecast, by Application 2020 & 2033
- Table 27: Argentina LED-Backlit Liquid Crystal Display Revenue (million) Forecast, by Application 2020 & 2033
- Table 28: Argentina LED-Backlit Liquid Crystal Display Volume (K) Forecast, by Application 2020 & 2033
- Table 29: Rest of South America LED-Backlit Liquid Crystal Display Revenue (million) Forecast, by Application 2020 & 2033
- Table 30: Rest of South America LED-Backlit Liquid Crystal Display Volume (K) Forecast, by Application 2020 & 2033
- Table 31: Global LED-Backlit Liquid Crystal Display Revenue million Forecast, by Application 2020 & 2033
- Table 32: Global LED-Backlit Liquid Crystal Display Volume K Forecast, by Application 2020 & 2033
- Table 33: Global LED-Backlit Liquid Crystal Display Revenue million Forecast, by Types 2020 & 2033
- Table 34: Global LED-Backlit Liquid Crystal Display Volume K Forecast, by Types 2020 & 2033
- Table 35: Global LED-Backlit Liquid Crystal Display Revenue million Forecast, by Country 2020 & 2033
- Table 36: Global LED-Backlit Liquid Crystal Display Volume K Forecast, by Country 2020 & 2033
- Table 37: United Kingdom LED-Backlit Liquid Crystal Display Revenue (million) Forecast, by Application 2020 & 2033
- Table 38: United Kingdom LED-Backlit Liquid Crystal Display Volume (K) Forecast, by Application 2020 & 2033
- Table 39: Germany LED-Backlit Liquid Crystal Display Revenue (million) Forecast, by Application 2020 & 2033
- Table 40: Germany LED-Backlit Liquid Crystal Display Volume (K) Forecast, by Application 2020 & 2033
- Table 41: France LED-Backlit Liquid Crystal Display Revenue (million) Forecast, by Application 2020 & 2033
- Table 42: France LED-Backlit Liquid Crystal Display Volume (K) Forecast, by Application 2020 & 2033
- Table 43: Italy LED-Backlit Liquid Crystal Display Revenue (million) Forecast, by Application 2020 & 2033
- Table 44: Italy LED-Backlit Liquid Crystal Display Volume (K) Forecast, by Application 2020 & 2033
- Table 45: Spain LED-Backlit Liquid Crystal Display Revenue (million) Forecast, by Application 2020 & 2033
- Table 46: Spain LED-Backlit Liquid Crystal Display Volume (K) Forecast, by Application 2020 & 2033
- Table 47: Russia LED-Backlit Liquid Crystal Display Revenue (million) Forecast, by Application 2020 & 2033
- Table 48: Russia LED-Backlit Liquid Crystal Display Volume (K) Forecast, by Application 2020 & 2033
- Table 49: Benelux LED-Backlit Liquid Crystal Display Revenue (million) Forecast, by Application 2020 & 2033
- Table 50: Benelux LED-Backlit Liquid Crystal Display Volume (K) Forecast, by Application 2020 & 2033
- Table 51: Nordics LED-Backlit Liquid Crystal Display Revenue (million) Forecast, by Application 2020 & 2033
- Table 52: Nordics LED-Backlit Liquid Crystal Display Volume (K) Forecast, by Application 2020 & 2033
- Table 53: Rest of Europe LED-Backlit Liquid Crystal Display Revenue (million) Forecast, by Application 2020 & 2033
- Table 54: Rest of Europe LED-Backlit Liquid Crystal Display Volume (K) Forecast, by Application 2020 & 2033
- Table 55: Global LED-Backlit Liquid Crystal Display Revenue million Forecast, by Application 2020 & 2033
- Table 56: Global LED-Backlit Liquid Crystal Display Volume K Forecast, by Application 2020 & 2033
- Table 57: Global LED-Backlit Liquid Crystal Display Revenue million Forecast, by Types 2020 & 2033
- Table 58: Global LED-Backlit Liquid Crystal Display Volume K Forecast, by Types 2020 & 2033
- Table 59: Global LED-Backlit Liquid Crystal Display Revenue million Forecast, by Country 2020 & 2033
- Table 60: Global LED-Backlit Liquid Crystal Display Volume K Forecast, by Country 2020 & 2033
- Table 61: Turkey LED-Backlit Liquid Crystal Display Revenue (million) Forecast, by Application 2020 & 2033
- Table 62: Turkey LED-Backlit Liquid Crystal Display Volume (K) Forecast, by Application 2020 & 2033
- Table 63: Israel LED-Backlit Liquid Crystal Display Revenue (million) Forecast, by Application 2020 & 2033
- Table 64: Israel LED-Backlit Liquid Crystal Display Volume (K) Forecast, by Application 2020 & 2033
- Table 65: GCC LED-Backlit Liquid Crystal Display Revenue (million) Forecast, by Application 2020 & 2033
- Table 66: GCC LED-Backlit Liquid Crystal Display Volume (K) Forecast, by Application 2020 & 2033
- Table 67: North Africa LED-Backlit Liquid Crystal Display Revenue (million) Forecast, by Application 2020 & 2033
- Table 68: North Africa LED-Backlit Liquid Crystal Display Volume (K) Forecast, by Application 2020 & 2033
- Table 69: South Africa LED-Backlit Liquid Crystal Display Revenue (million) Forecast, by Application 2020 & 2033
- Table 70: South Africa LED-Backlit Liquid Crystal Display Volume (K) Forecast, by Application 2020 & 2033
- Table 71: Rest of Middle East & Africa LED-Backlit Liquid Crystal Display Revenue (million) Forecast, by Application 2020 & 2033
- Table 72: Rest of Middle East & Africa LED-Backlit Liquid Crystal Display Volume (K) Forecast, by Application 2020 & 2033
- Table 73: Global LED-Backlit Liquid Crystal Display Revenue million Forecast, by Application 2020 & 2033
- Table 74: Global LED-Backlit Liquid Crystal Display Volume K Forecast, by Application 2020 & 2033
- Table 75: Global LED-Backlit Liquid Crystal Display Revenue million Forecast, by Types 2020 & 2033
- Table 76: Global LED-Backlit Liquid Crystal Display Volume K Forecast, by Types 2020 & 2033
- Table 77: Global LED-Backlit Liquid Crystal Display Revenue million Forecast, by Country 2020 & 2033
- Table 78: Global LED-Backlit Liquid Crystal Display Volume K Forecast, by Country 2020 & 2033
- Table 79: China LED-Backlit Liquid Crystal Display Revenue (million) Forecast, by Application 2020 & 2033
- Table 80: China LED-Backlit Liquid Crystal Display Volume (K) Forecast, by Application 2020 & 2033
- Table 81: India LED-Backlit Liquid Crystal Display Revenue (million) Forecast, by Application 2020 & 2033
- Table 82: India LED-Backlit Liquid Crystal Display Volume (K) Forecast, by Application 2020 & 2033
- Table 83: Japan LED-Backlit Liquid Crystal Display Revenue (million) Forecast, by Application 2020 & 2033
- Table 84: Japan LED-Backlit Liquid Crystal Display Volume (K) Forecast, by Application 2020 & 2033
- Table 85: South Korea LED-Backlit Liquid Crystal Display Revenue (million) Forecast, by Application 2020 & 2033
- Table 86: South Korea LED-Backlit Liquid Crystal Display Volume (K) Forecast, by Application 2020 & 2033
- Table 87: ASEAN LED-Backlit Liquid Crystal Display Revenue (million) Forecast, by Application 2020 & 2033
- Table 88: ASEAN LED-Backlit Liquid Crystal Display Volume (K) Forecast, by Application 2020 & 2033
- Table 89: Oceania LED-Backlit Liquid Crystal Display Revenue (million) Forecast, by Application 2020 & 2033
- Table 90: Oceania LED-Backlit Liquid Crystal Display Volume (K) Forecast, by Application 2020 & 2033
- Table 91: Rest of Asia Pacific LED-Backlit Liquid Crystal Display Revenue (million) Forecast, by Application 2020 & 2033
- Table 92: Rest of Asia Pacific LED-Backlit Liquid Crystal Display Volume (K) Forecast, by Application 2020 & 2033
Frequently Asked Questions
1. What is the projected Compound Annual Growth Rate (CAGR) of the LED-Backlit Liquid Crystal Display?
The projected CAGR is approximately XX%.
2. Which companies are prominent players in the LED-Backlit Liquid Crystal Display?
Key companies in the market include Samsung Electronics, LG Display, NEC Corp, Leyard Optoelectronic, Sharp Corp, Barco NV, Sony Corp, TPV Technology Ltd, AU Optronics Corp.
3. What are the main segments of the LED-Backlit Liquid Crystal Display?
The market segments include Application, Types.
4. Can you provide details about the market size?
The market size is estimated to be USD XXX million as of 2022.
5. What are some drivers contributing to market growth?
N/A
6. What are the notable trends driving market growth?
N/A
7. Are there any restraints impacting market growth?
N/A
8. Can you provide examples of recent developments in the market?
N/A
9. What pricing options are available for accessing the report?
Pricing options include single-user, multi-user, and enterprise licenses priced at USD 3350.00, USD 5025.00, and USD 6700.00 respectively.
10. Is the market size provided in terms of value or volume?
The market size is provided in terms of value, measured in million and volume, measured in K.
11. Are there any specific market keywords associated with the report?
Yes, the market keyword associated with the report is "LED-Backlit Liquid Crystal Display," which aids in identifying and referencing the specific market segment covered.
12. How do I determine which pricing option suits my needs best?
The pricing options vary based on user requirements and access needs. Individual users may opt for single-user licenses, while businesses requiring broader access may choose multi-user or enterprise licenses for cost-effective access to the report.
13. Are there any additional resources or data provided in the LED-Backlit Liquid Crystal Display report?
While the report offers comprehensive insights, it's advisable to review the specific contents or supplementary materials provided to ascertain if additional resources or data are available.
14. How can I stay updated on further developments or reports in the LED-Backlit Liquid Crystal Display?
To stay informed about further developments, trends, and reports in the LED-Backlit Liquid Crystal Display, consider subscribing to industry newsletters, following relevant companies and organizations, or regularly checking reputable industry news sources and publications.
Methodology
Step 1 - Identification of Relevant Samples Size from Population Database


Step 2 - Approaches for Defining Global Market Size (Value, Volume* & Price*)

Note*: In applicable scenarios
Step 3 - Data Sources
Primary Research
- Web Analytics
- Survey Reports
- Research Institute
- Latest Research Reports
- Opinion Leaders
Secondary Research
- Annual Reports
- White Paper
- Latest Press Release
- Industry Association
- Paid Database
- Investor Presentations

Step 4 - Data Triangulation
Involves using different sources of information in order to increase the validity of a study
These sources are likely to be stakeholders in a program - participants, other researchers, program staff, other community members, and so on.
Then we put all data in single framework & apply various statistical tools to find out the dynamic on the market.
During the analysis stage, feedback from the stakeholder groups would be compared to determine areas of agreement as well as areas of divergence