

Key Insights
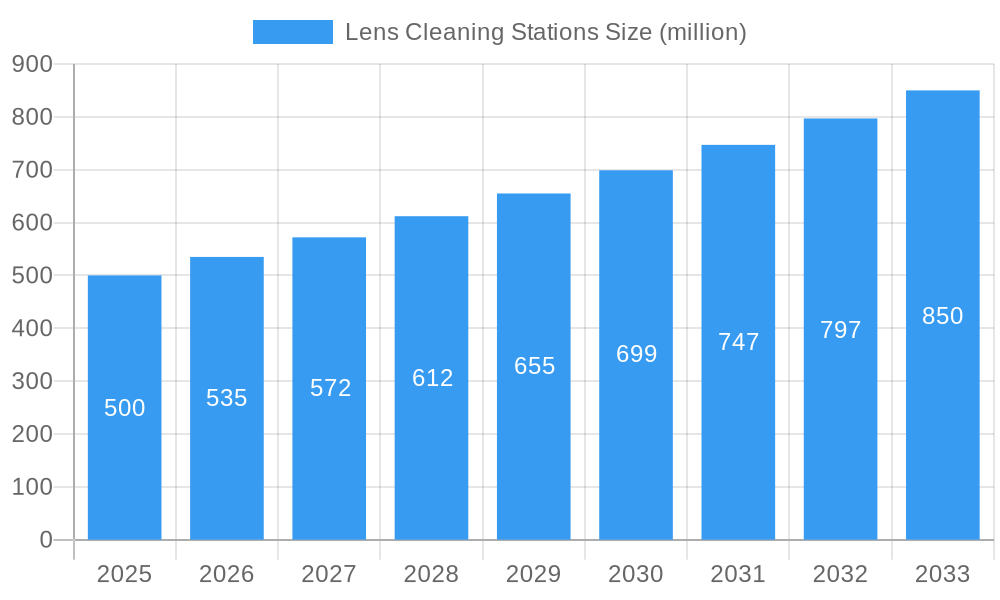
The lens cleaning station market is experiencing robust growth, driven by increasing demand for advanced cleaning solutions across various industries. The market, estimated at $500 million in 2025, is projected to exhibit a Compound Annual Growth Rate (CAGR) of 7% from 2025 to 2033, reaching approximately $900 million by 2033. This growth is fueled by several key factors. The rising adoption of sophisticated optical equipment in healthcare (microsurgery, ophthalmology), manufacturing (precision engineering, semiconductor), and research (microscopy, spectroscopy) demands meticulous lens cleaning for optimal performance and extended lifespan. Technological advancements, such as the introduction of automated and high-throughput lens cleaning stations, are enhancing efficiency and reducing cleaning time, thereby further stimulating market expansion. Furthermore, the increasing awareness of contamination control and the growing need for maintaining high levels of hygiene in sensitive environments contribute significantly to market growth. Key players like Sellstrom Manufacturing, Honeywell, Bausch + Lomb, and Kimberly-Clark are actively shaping the market landscape through product innovation and strategic partnerships.
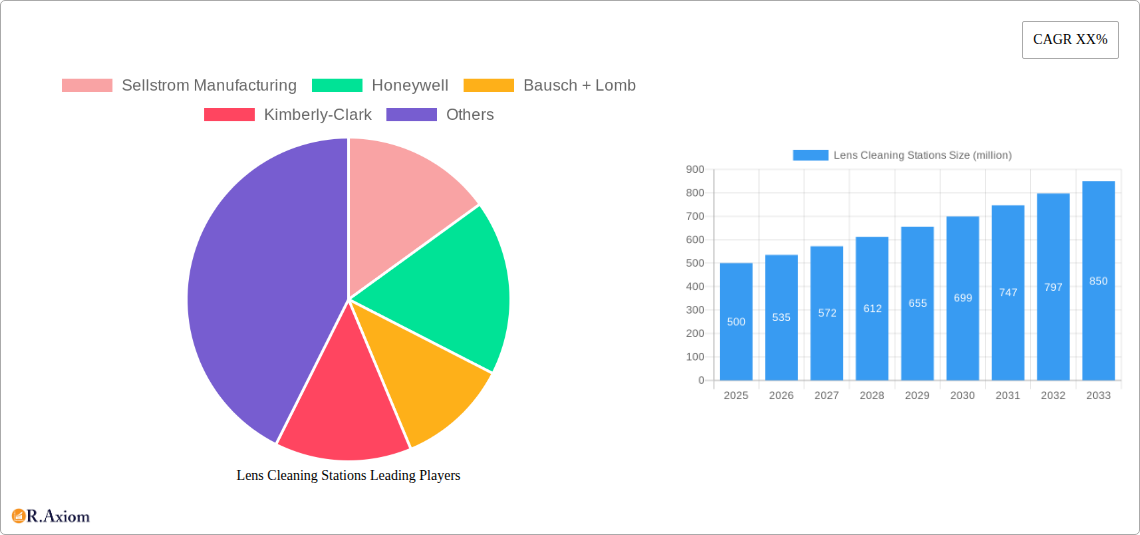
Lens Cleaning Stations Market Size (In Million)
However, the market's expansion is not without its challenges. High initial investment costs associated with advanced lens cleaning stations might hinder adoption in smaller companies or laboratories with limited budgets. Moreover, the need for specialized training and maintenance for some sophisticated systems could pose a barrier to entry for certain end-users. Despite these restraints, the long-term prospects for the lens cleaning station market remain positive, driven by continuous technological improvements and the rising demand for precision cleaning across numerous applications. The industry is poised for continued growth as more businesses recognize the crucial role of lens cleanliness in their operations and seek advanced solutions for maintaining the integrity and performance of their valuable equipment.
Lens Cleaning Stations Company Market Share
Lens Cleaning Stations Market: A Comprehensive Report (2019-2033)
This detailed report provides a comprehensive analysis of the global Lens Cleaning Stations market, offering actionable insights for industry stakeholders, investors, and businesses. The study covers the period from 2019 to 2033, with 2025 serving as the base and estimated year. The report incorporates extensive market sizing, segmentation, and competitive landscape analysis, leveraging data from various sources to provide a holistic understanding of this dynamic market. The market is expected to reach a value of $XX million by 2033.
Lens Cleaning Stations Market Concentration & Innovation
The global Lens Cleaning Stations market exhibits a moderately concentrated landscape, with a few key players holding significant market share. Sellstrom Manufacturing, Honeywell, Bausch + Lomb, and Kimberly-Clark are among the prominent companies shaping the market. These companies compete primarily on product features, technological advancements, and pricing strategies. The market share of the top five players is estimated at xx%.
Innovation is a key driver in this market, with companies constantly striving to develop more efficient, user-friendly, and environmentally sustainable lens cleaning solutions. Regulatory frameworks, particularly concerning the safety and environmental impact of cleaning solutions, play a significant role. The emergence of eco-friendly cleaning solutions is a major trend, driven by growing environmental concerns. Product substitutes, such as reusable cleaning cloths and wipes, pose a competitive challenge. End-user trends lean toward convenient and effective solutions that minimize damage and maximize lens lifespan. M&A activity within the sector has been moderate in recent years, with reported deal values totaling approximately $XX million over the past five years. This activity reflects a strategy to expand market reach and acquire cutting-edge technology.
- Market Share: Top 5 players hold xx%
- M&A Deal Value (2019-2024): $XX million
Lens Cleaning Stations Industry Trends & Insights
The Lens Cleaning Stations market is experiencing robust growth, driven by several factors. The increasing prevalence of eye-related conditions and the rising demand for corrective eyewear contribute significantly to market expansion. Technological advancements, particularly in the development of automated and portable cleaning solutions, are enhancing market appeal. Consumer preference leans towards efficient and convenient solutions that can be easily integrated into daily routines. Furthermore, the increasing awareness of the importance of proper lens hygiene has positively influenced market growth. The market is expected to exhibit a Compound Annual Growth Rate (CAGR) of xx% during the forecast period (2025-2033). Market penetration stands at xx% as of 2025. Competitive dynamics are intense, characterized by product innovation, strategic partnerships, and marketing efforts aimed at capturing market share.
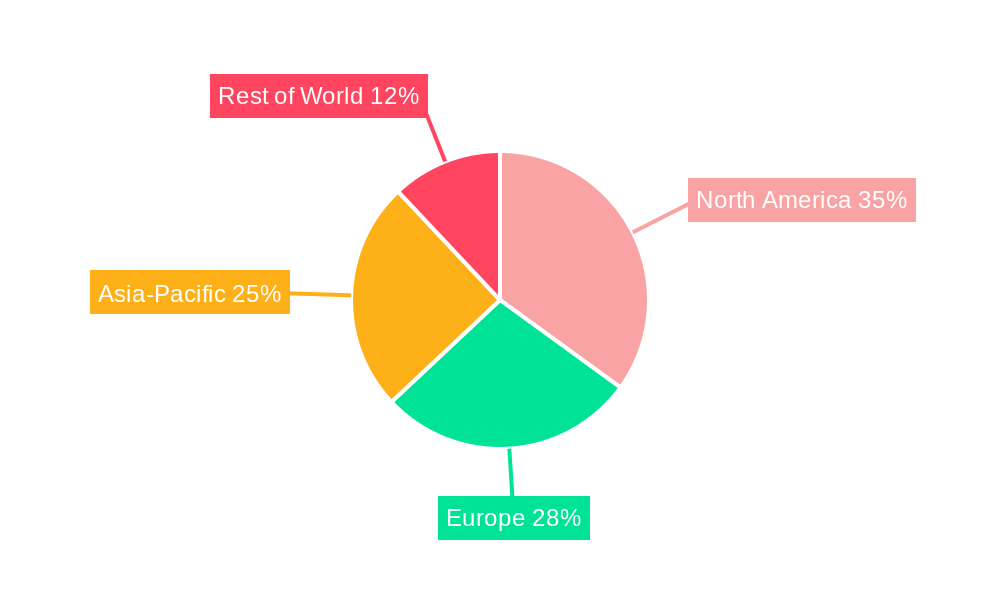
Dominant Markets & Segments in Lens Cleaning Stations
The North American region currently dominates the global Lens Cleaning Stations market, driven by factors such as high disposable incomes, the prevalence of eye-related issues, and the robust presence of established players.
- Key Drivers for North American Dominance:
- High per capita disposable income
- Strong regulatory frameworks supporting technological advancement
- High prevalence of eye-related disorders
- Established market presence of major players
- Advanced healthcare infrastructure.
This dominance is further supported by a mature and well-developed healthcare infrastructure. The European market is another significant region, showing considerable growth potential, followed by the Asia-Pacific market.
Lens Cleaning Stations Product Developments
Recent product innovations include the development of compact, portable cleaning stations integrating advanced cleaning technologies. These advancements cater to the growing demand for convenience and efficiency among consumers. The market is witnessing a surge in eco-friendly cleaning solutions designed to minimize environmental impact. These developments leverage technological advancements in fluid dynamics and material science, offering distinct competitive advantages, primarily in terms of efficacy, speed, and environmental consciousness.
Report Scope & Segmentation Analysis
This report segments the Lens Cleaning Stations market based on several key factors: product type (e.g., automated, manual), application (e.g., ophthalmic lenses, industrial lenses), end-user (e.g., hospitals, optical stores, industrial facilities), and geography. Each segment exhibits unique growth trajectories and competitive dynamics. Growth projections vary across segments, with the automated segment expected to experience the highest growth rate due to increased demand for efficiency and convenience.
Key Drivers of Lens Cleaning Stations Growth
Several key factors are propelling the growth of the Lens Cleaning Stations market. Technological advancements leading to improved cleaning efficacy and convenience are a major catalyst. Rising disposable incomes, particularly in developing economies, are expanding the consumer base. Stringent regulatory frameworks promoting lens hygiene and safety are positively influencing market expansion. The increasing prevalence of eye-related conditions is a major factor.
Challenges in the Lens Cleaning Stations Sector
The Lens Cleaning Stations market faces several challenges, including the high initial investment costs associated with advanced cleaning technologies. Supply chain disruptions due to geopolitical factors can affect the availability and cost of raw materials. Intense competition from established and emerging players requires businesses to remain innovative and adaptable. Strict regulatory compliance requirements and the potential for adverse environmental impacts also pose challenges. These factors could negatively impact market growth by up to xx% in the worst-case scenario.
Emerging Opportunities in Lens Cleaning Stations
Several emerging opportunities exist within the Lens Cleaning Stations market. The expanding use of lens cleaning stations in industrial settings for precision lenses is a promising area. The integration of advanced technologies like AI and IoT into cleaning stations could enhance efficiency and customization. The rise of disposable lens cleaning solutions offers additional growth potential. These opportunities promise significant market expansion and innovation.
Leading Players in the Lens Cleaning Stations Market
- Sellstrom Manufacturing
- Honeywell
- Bausch + Lomb
- Kimberly-Clark
Key Developments in Lens Cleaning Stations Industry
- 2022 Q4: Sellstrom Manufacturing launched a new line of eco-friendly lens cleaning stations.
- 2023 Q1: Honeywell acquired a smaller competitor, expanding its market reach.
- 2024 Q2: Bausch + Lomb introduced a technologically advanced automated cleaning station.
- 2024 Q4: Kimberly-Clark expanded distribution channels in developing markets.
Strategic Outlook for Lens Cleaning Stations Market
The Lens Cleaning Stations market holds considerable future potential, fueled by ongoing technological advancements, and the increasing demand for efficient and convenient lens cleaning solutions. The market's expansion into new sectors and the incorporation of cutting-edge technologies will continue to drive growth, offering lucrative opportunities for businesses to innovate and capture market share. The forecasted market value of $XX million by 2033 reflects a positive outlook for the sector.
Lens Cleaning Stations Segmentation
-
1. Application
- 1.1. Factory
- 1.2. Laboratory
- 1.3. Office
- 1.4. Others
-
2. Types
- 2.1. Desktop Type
- 2.2. Vertical Type
Lens Cleaning Stations Segmentation By Geography
-
1. North America
- 1.1. United States
- 1.2. Canada
- 1.3. Mexico
-
2. South America
- 2.1. Brazil
- 2.2. Argentina
- 2.3. Rest of South America
-
3. Europe
- 3.1. United Kingdom
- 3.2. Germany
- 3.3. France
- 3.4. Italy
- 3.5. Spain
- 3.6. Russia
- 3.7. Benelux
- 3.8. Nordics
- 3.9. Rest of Europe
-
4. Middle East & Africa
- 4.1. Turkey
- 4.2. Israel
- 4.3. GCC
- 4.4. North Africa
- 4.5. South Africa
- 4.6. Rest of Middle East & Africa
-
5. Asia Pacific
- 5.1. China
- 5.2. India
- 5.3. Japan
- 5.4. South Korea
- 5.5. ASEAN
- 5.6. Oceania
- 5.7. Rest of Asia Pacific
Lens Cleaning Stations Regional Market Share
Geographic Coverage of Lens Cleaning Stations
Lens Cleaning Stations REPORT HIGHLIGHTS
| Aspects | Details |
|---|---|
| Study Period | 2020-2034 |
| Base Year | 2025 |
| Estimated Year | 2026 |
| Forecast Period | 2026-2034 |
| Historical Period | 2020-2025 |
| Growth Rate | CAGR of 7% from 2020-2034 |
| Segmentation |
|
Table of Contents
- 1. Introduction
- 1.1. Research Scope
- 1.2. Market Segmentation
- 1.3. Research Objective
- 1.4. Definitions and Assumptions
- 2. Executive Summary
- 2.1. Market Snapshot
- 3. Market Dynamics
- 3.1. Market Drivers
- 3.2. Market Restrains
- 3.3. Market Trends
- 3.4. Market Opportunities
- 4. Market Factor Analysis
- 4.1. Porters Five Forces
- 4.1.1. Bargaining Power of Suppliers
- 4.1.2. Bargaining Power of Buyers
- 4.1.3. Threat of New Entrants
- 4.1.4. Threat of Substitutes
- 4.1.5. Competitive Rivalry
- 4.2. PESTEL analysis
- 4.3. BCG Analysis
- 4.3.1. Stars (High Growth, High Market Share)
- 4.3.2. Cash Cows (Low Growth, High Market Share)
- 4.3.3. Question Mark (High Growth, Low Market Share)
- 4.3.4. Dogs (Low Growth, Low Market Share)
- 4.4. Ansoff Matrix Analysis
- 4.5. Supply Chain Analysis
- 4.6. Regulatory Landscape
- 4.7. Current Market Potential and Opportunity Assessment (TAM–SAM–SOM Framework)
- 4.8. RAX Analyst Note
- 4.1. Porters Five Forces
- 5. Market Analysis, Insights and Forecast 2021-2033
- 5.1. Market Analysis, Insights and Forecast - by Application
- 5.1.1. Factory
- 5.1.2. Laboratory
- 5.1.3. Office
- 5.1.4. Others
- 5.2. Market Analysis, Insights and Forecast - by Types
- 5.2.1. Desktop Type
- 5.2.2. Vertical Type
- 5.3. Market Analysis, Insights and Forecast - by Region
- 5.3.1. North America
- 5.3.2. South America
- 5.3.3. Europe
- 5.3.4. Middle East & Africa
- 5.3.5. Asia Pacific
- 5.1. Market Analysis, Insights and Forecast - by Application
- 6. Global Lens Cleaning Stations Analysis, Insights and Forecast, 2021-2033
- 6.1. Market Analysis, Insights and Forecast - by Application
- 6.1.1. Factory
- 6.1.2. Laboratory
- 6.1.3. Office
- 6.1.4. Others
- 6.2. Market Analysis, Insights and Forecast - by Types
- 6.2.1. Desktop Type
- 6.2.2. Vertical Type
- 6.1. Market Analysis, Insights and Forecast - by Application
- 7. North America Lens Cleaning Stations Analysis, Insights and Forecast, 2020-2032
- 7.1. Market Analysis, Insights and Forecast - by Application
- 7.1.1. Factory
- 7.1.2. Laboratory
- 7.1.3. Office
- 7.1.4. Others
- 7.2. Market Analysis, Insights and Forecast - by Types
- 7.2.1. Desktop Type
- 7.2.2. Vertical Type
- 7.1. Market Analysis, Insights and Forecast - by Application
- 8. South America Lens Cleaning Stations Analysis, Insights and Forecast, 2020-2032
- 8.1. Market Analysis, Insights and Forecast - by Application
- 8.1.1. Factory
- 8.1.2. Laboratory
- 8.1.3. Office
- 8.1.4. Others
- 8.2. Market Analysis, Insights and Forecast - by Types
- 8.2.1. Desktop Type
- 8.2.2. Vertical Type
- 8.1. Market Analysis, Insights and Forecast - by Application
- 9. Europe Lens Cleaning Stations Analysis, Insights and Forecast, 2020-2032
- 9.1. Market Analysis, Insights and Forecast - by Application
- 9.1.1. Factory
- 9.1.2. Laboratory
- 9.1.3. Office
- 9.1.4. Others
- 9.2. Market Analysis, Insights and Forecast - by Types
- 9.2.1. Desktop Type
- 9.2.2. Vertical Type
- 9.1. Market Analysis, Insights and Forecast - by Application
- 10. Middle East & Africa Lens Cleaning Stations Analysis, Insights and Forecast, 2020-2032
- 10.1. Market Analysis, Insights and Forecast - by Application
- 10.1.1. Factory
- 10.1.2. Laboratory
- 10.1.3. Office
- 10.1.4. Others
- 10.2. Market Analysis, Insights and Forecast - by Types
- 10.2.1. Desktop Type
- 10.2.2. Vertical Type
- 10.1. Market Analysis, Insights and Forecast - by Application
- 11. Asia Pacific Lens Cleaning Stations Analysis, Insights and Forecast, 2020-2032
- 11.1. Market Analysis, Insights and Forecast - by Application
- 11.1.1. Factory
- 11.1.2. Laboratory
- 11.1.3. Office
- 11.1.4. Others
- 11.2. Market Analysis, Insights and Forecast - by Types
- 11.2.1. Desktop Type
- 11.2.2. Vertical Type
- 11.1. Market Analysis, Insights and Forecast - by Application
- 12. Competitive Analysis
- 12.1. Company Profiles
- 12.1.1 Sellstrom Manufacturing
- 12.1.1.1. Company Overview
- 12.1.1.2. Products
- 12.1.1.3. Company Financials
- 12.1.1.4. SWOT Analysis
- 12.1.2 Honeywell
- 12.1.2.1. Company Overview
- 12.1.2.2. Products
- 12.1.2.3. Company Financials
- 12.1.2.4. SWOT Analysis
- 12.1.3 Bausch + Lomb
- 12.1.3.1. Company Overview
- 12.1.3.2. Products
- 12.1.3.3. Company Financials
- 12.1.3.4. SWOT Analysis
- 12.1.4 Kimberly-Clark
- 12.1.4.1. Company Overview
- 12.1.4.2. Products
- 12.1.4.3. Company Financials
- 12.1.4.4. SWOT Analysis
- 12.1.1 Sellstrom Manufacturing
- 12.2. Market Entropy
- 12.2.1 Company's Key Areas Served
- 12.2.2 Recent Developments
- 12.3. Company Market Share Analysis 2025
- 12.3.1 Top 5 Companies Market Share Analysis
- 12.3.2 Top 3 Companies Market Share Analysis
- 12.4. List of Potential Customers
- 13. Research Methodology
List of Figures
- Figure 1: Global Lens Cleaning Stations Revenue Breakdown (undefined, %) by Region 2025 & 2033
- Figure 2: Global Lens Cleaning Stations Volume Breakdown (K, %) by Region 2025 & 2033
- Figure 3: North America Lens Cleaning Stations Revenue (undefined), by Application 2025 & 2033
- Figure 4: North America Lens Cleaning Stations Volume (K), by Application 2025 & 2033
- Figure 5: North America Lens Cleaning Stations Revenue Share (%), by Application 2025 & 2033
- Figure 6: North America Lens Cleaning Stations Volume Share (%), by Application 2025 & 2033
- Figure 7: North America Lens Cleaning Stations Revenue (undefined), by Types 2025 & 2033
- Figure 8: North America Lens Cleaning Stations Volume (K), by Types 2025 & 2033
- Figure 9: North America Lens Cleaning Stations Revenue Share (%), by Types 2025 & 2033
- Figure 10: North America Lens Cleaning Stations Volume Share (%), by Types 2025 & 2033
- Figure 11: North America Lens Cleaning Stations Revenue (undefined), by Country 2025 & 2033
- Figure 12: North America Lens Cleaning Stations Volume (K), by Country 2025 & 2033
- Figure 13: North America Lens Cleaning Stations Revenue Share (%), by Country 2025 & 2033
- Figure 14: North America Lens Cleaning Stations Volume Share (%), by Country 2025 & 2033
- Figure 15: South America Lens Cleaning Stations Revenue (undefined), by Application 2025 & 2033
- Figure 16: South America Lens Cleaning Stations Volume (K), by Application 2025 & 2033
- Figure 17: South America Lens Cleaning Stations Revenue Share (%), by Application 2025 & 2033
- Figure 18: South America Lens Cleaning Stations Volume Share (%), by Application 2025 & 2033
- Figure 19: South America Lens Cleaning Stations Revenue (undefined), by Types 2025 & 2033
- Figure 20: South America Lens Cleaning Stations Volume (K), by Types 2025 & 2033
- Figure 21: South America Lens Cleaning Stations Revenue Share (%), by Types 2025 & 2033
- Figure 22: South America Lens Cleaning Stations Volume Share (%), by Types 2025 & 2033
- Figure 23: South America Lens Cleaning Stations Revenue (undefined), by Country 2025 & 2033
- Figure 24: South America Lens Cleaning Stations Volume (K), by Country 2025 & 2033
- Figure 25: South America Lens Cleaning Stations Revenue Share (%), by Country 2025 & 2033
- Figure 26: South America Lens Cleaning Stations Volume Share (%), by Country 2025 & 2033
- Figure 27: Europe Lens Cleaning Stations Revenue (undefined), by Application 2025 & 2033
- Figure 28: Europe Lens Cleaning Stations Volume (K), by Application 2025 & 2033
- Figure 29: Europe Lens Cleaning Stations Revenue Share (%), by Application 2025 & 2033
- Figure 30: Europe Lens Cleaning Stations Volume Share (%), by Application 2025 & 2033
- Figure 31: Europe Lens Cleaning Stations Revenue (undefined), by Types 2025 & 2033
- Figure 32: Europe Lens Cleaning Stations Volume (K), by Types 2025 & 2033
- Figure 33: Europe Lens Cleaning Stations Revenue Share (%), by Types 2025 & 2033
- Figure 34: Europe Lens Cleaning Stations Volume Share (%), by Types 2025 & 2033
- Figure 35: Europe Lens Cleaning Stations Revenue (undefined), by Country 2025 & 2033
- Figure 36: Europe Lens Cleaning Stations Volume (K), by Country 2025 & 2033
- Figure 37: Europe Lens Cleaning Stations Revenue Share (%), by Country 2025 & 2033
- Figure 38: Europe Lens Cleaning Stations Volume Share (%), by Country 2025 & 2033
- Figure 39: Middle East & Africa Lens Cleaning Stations Revenue (undefined), by Application 2025 & 2033
- Figure 40: Middle East & Africa Lens Cleaning Stations Volume (K), by Application 2025 & 2033
- Figure 41: Middle East & Africa Lens Cleaning Stations Revenue Share (%), by Application 2025 & 2033
- Figure 42: Middle East & Africa Lens Cleaning Stations Volume Share (%), by Application 2025 & 2033
- Figure 43: Middle East & Africa Lens Cleaning Stations Revenue (undefined), by Types 2025 & 2033
- Figure 44: Middle East & Africa Lens Cleaning Stations Volume (K), by Types 2025 & 2033
- Figure 45: Middle East & Africa Lens Cleaning Stations Revenue Share (%), by Types 2025 & 2033
- Figure 46: Middle East & Africa Lens Cleaning Stations Volume Share (%), by Types 2025 & 2033
- Figure 47: Middle East & Africa Lens Cleaning Stations Revenue (undefined), by Country 2025 & 2033
- Figure 48: Middle East & Africa Lens Cleaning Stations Volume (K), by Country 2025 & 2033
- Figure 49: Middle East & Africa Lens Cleaning Stations Revenue Share (%), by Country 2025 & 2033
- Figure 50: Middle East & Africa Lens Cleaning Stations Volume Share (%), by Country 2025 & 2033
- Figure 51: Asia Pacific Lens Cleaning Stations Revenue (undefined), by Application 2025 & 2033
- Figure 52: Asia Pacific Lens Cleaning Stations Volume (K), by Application 2025 & 2033
- Figure 53: Asia Pacific Lens Cleaning Stations Revenue Share (%), by Application 2025 & 2033
- Figure 54: Asia Pacific Lens Cleaning Stations Volume Share (%), by Application 2025 & 2033
- Figure 55: Asia Pacific Lens Cleaning Stations Revenue (undefined), by Types 2025 & 2033
- Figure 56: Asia Pacific Lens Cleaning Stations Volume (K), by Types 2025 & 2033
- Figure 57: Asia Pacific Lens Cleaning Stations Revenue Share (%), by Types 2025 & 2033
- Figure 58: Asia Pacific Lens Cleaning Stations Volume Share (%), by Types 2025 & 2033
- Figure 59: Asia Pacific Lens Cleaning Stations Revenue (undefined), by Country 2025 & 2033
- Figure 60: Asia Pacific Lens Cleaning Stations Volume (K), by Country 2025 & 2033
- Figure 61: Asia Pacific Lens Cleaning Stations Revenue Share (%), by Country 2025 & 2033
- Figure 62: Asia Pacific Lens Cleaning Stations Volume Share (%), by Country 2025 & 2033
List of Tables
- Table 1: Global Lens Cleaning Stations Revenue undefined Forecast, by Application 2020 & 2033
- Table 2: Global Lens Cleaning Stations Volume K Forecast, by Application 2020 & 2033
- Table 3: Global Lens Cleaning Stations Revenue undefined Forecast, by Types 2020 & 2033
- Table 4: Global Lens Cleaning Stations Volume K Forecast, by Types 2020 & 2033
- Table 5: Global Lens Cleaning Stations Revenue undefined Forecast, by Region 2020 & 2033
- Table 6: Global Lens Cleaning Stations Volume K Forecast, by Region 2020 & 2033
- Table 7: Global Lens Cleaning Stations Revenue undefined Forecast, by Application 2020 & 2033
- Table 8: Global Lens Cleaning Stations Volume K Forecast, by Application 2020 & 2033
- Table 9: Global Lens Cleaning Stations Revenue undefined Forecast, by Types 2020 & 2033
- Table 10: Global Lens Cleaning Stations Volume K Forecast, by Types 2020 & 2033
- Table 11: Global Lens Cleaning Stations Revenue undefined Forecast, by Country 2020 & 2033
- Table 12: Global Lens Cleaning Stations Volume K Forecast, by Country 2020 & 2033
- Table 13: United States Lens Cleaning Stations Revenue (undefined) Forecast, by Application 2020 & 2033
- Table 14: United States Lens Cleaning Stations Volume (K) Forecast, by Application 2020 & 2033
- Table 15: Canada Lens Cleaning Stations Revenue (undefined) Forecast, by Application 2020 & 2033
- Table 16: Canada Lens Cleaning Stations Volume (K) Forecast, by Application 2020 & 2033
- Table 17: Mexico Lens Cleaning Stations Revenue (undefined) Forecast, by Application 2020 & 2033
- Table 18: Mexico Lens Cleaning Stations Volume (K) Forecast, by Application 2020 & 2033
- Table 19: Global Lens Cleaning Stations Revenue undefined Forecast, by Application 2020 & 2033
- Table 20: Global Lens Cleaning Stations Volume K Forecast, by Application 2020 & 2033
- Table 21: Global Lens Cleaning Stations Revenue undefined Forecast, by Types 2020 & 2033
- Table 22: Global Lens Cleaning Stations Volume K Forecast, by Types 2020 & 2033
- Table 23: Global Lens Cleaning Stations Revenue undefined Forecast, by Country 2020 & 2033
- Table 24: Global Lens Cleaning Stations Volume K Forecast, by Country 2020 & 2033
- Table 25: Brazil Lens Cleaning Stations Revenue (undefined) Forecast, by Application 2020 & 2033
- Table 26: Brazil Lens Cleaning Stations Volume (K) Forecast, by Application 2020 & 2033
- Table 27: Argentina Lens Cleaning Stations Revenue (undefined) Forecast, by Application 2020 & 2033
- Table 28: Argentina Lens Cleaning Stations Volume (K) Forecast, by Application 2020 & 2033
- Table 29: Rest of South America Lens Cleaning Stations Revenue (undefined) Forecast, by Application 2020 & 2033
- Table 30: Rest of South America Lens Cleaning Stations Volume (K) Forecast, by Application 2020 & 2033
- Table 31: Global Lens Cleaning Stations Revenue undefined Forecast, by Application 2020 & 2033
- Table 32: Global Lens Cleaning Stations Volume K Forecast, by Application 2020 & 2033
- Table 33: Global Lens Cleaning Stations Revenue undefined Forecast, by Types 2020 & 2033
- Table 34: Global Lens Cleaning Stations Volume K Forecast, by Types 2020 & 2033
- Table 35: Global Lens Cleaning Stations Revenue undefined Forecast, by Country 2020 & 2033
- Table 36: Global Lens Cleaning Stations Volume K Forecast, by Country 2020 & 2033
- Table 37: United Kingdom Lens Cleaning Stations Revenue (undefined) Forecast, by Application 2020 & 2033
- Table 38: United Kingdom Lens Cleaning Stations Volume (K) Forecast, by Application 2020 & 2033
- Table 39: Germany Lens Cleaning Stations Revenue (undefined) Forecast, by Application 2020 & 2033
- Table 40: Germany Lens Cleaning Stations Volume (K) Forecast, by Application 2020 & 2033
- Table 41: France Lens Cleaning Stations Revenue (undefined) Forecast, by Application 2020 & 2033
- Table 42: France Lens Cleaning Stations Volume (K) Forecast, by Application 2020 & 2033
- Table 43: Italy Lens Cleaning Stations Revenue (undefined) Forecast, by Application 2020 & 2033
- Table 44: Italy Lens Cleaning Stations Volume (K) Forecast, by Application 2020 & 2033
- Table 45: Spain Lens Cleaning Stations Revenue (undefined) Forecast, by Application 2020 & 2033
- Table 46: Spain Lens Cleaning Stations Volume (K) Forecast, by Application 2020 & 2033
- Table 47: Russia Lens Cleaning Stations Revenue (undefined) Forecast, by Application 2020 & 2033
- Table 48: Russia Lens Cleaning Stations Volume (K) Forecast, by Application 2020 & 2033
- Table 49: Benelux Lens Cleaning Stations Revenue (undefined) Forecast, by Application 2020 & 2033
- Table 50: Benelux Lens Cleaning Stations Volume (K) Forecast, by Application 2020 & 2033
- Table 51: Nordics Lens Cleaning Stations Revenue (undefined) Forecast, by Application 2020 & 2033
- Table 52: Nordics Lens Cleaning Stations Volume (K) Forecast, by Application 2020 & 2033
- Table 53: Rest of Europe Lens Cleaning Stations Revenue (undefined) Forecast, by Application 2020 & 2033
- Table 54: Rest of Europe Lens Cleaning Stations Volume (K) Forecast, by Application 2020 & 2033
- Table 55: Global Lens Cleaning Stations Revenue undefined Forecast, by Application 2020 & 2033
- Table 56: Global Lens Cleaning Stations Volume K Forecast, by Application 2020 & 2033
- Table 57: Global Lens Cleaning Stations Revenue undefined Forecast, by Types 2020 & 2033
- Table 58: Global Lens Cleaning Stations Volume K Forecast, by Types 2020 & 2033
- Table 59: Global Lens Cleaning Stations Revenue undefined Forecast, by Country 2020 & 2033
- Table 60: Global Lens Cleaning Stations Volume K Forecast, by Country 2020 & 2033
- Table 61: Turkey Lens Cleaning Stations Revenue (undefined) Forecast, by Application 2020 & 2033
- Table 62: Turkey Lens Cleaning Stations Volume (K) Forecast, by Application 2020 & 2033
- Table 63: Israel Lens Cleaning Stations Revenue (undefined) Forecast, by Application 2020 & 2033
- Table 64: Israel Lens Cleaning Stations Volume (K) Forecast, by Application 2020 & 2033
- Table 65: GCC Lens Cleaning Stations Revenue (undefined) Forecast, by Application 2020 & 2033
- Table 66: GCC Lens Cleaning Stations Volume (K) Forecast, by Application 2020 & 2033
- Table 67: North Africa Lens Cleaning Stations Revenue (undefined) Forecast, by Application 2020 & 2033
- Table 68: North Africa Lens Cleaning Stations Volume (K) Forecast, by Application 2020 & 2033
- Table 69: South Africa Lens Cleaning Stations Revenue (undefined) Forecast, by Application 2020 & 2033
- Table 70: South Africa Lens Cleaning Stations Volume (K) Forecast, by Application 2020 & 2033
- Table 71: Rest of Middle East & Africa Lens Cleaning Stations Revenue (undefined) Forecast, by Application 2020 & 2033
- Table 72: Rest of Middle East & Africa Lens Cleaning Stations Volume (K) Forecast, by Application 2020 & 2033
- Table 73: Global Lens Cleaning Stations Revenue undefined Forecast, by Application 2020 & 2033
- Table 74: Global Lens Cleaning Stations Volume K Forecast, by Application 2020 & 2033
- Table 75: Global Lens Cleaning Stations Revenue undefined Forecast, by Types 2020 & 2033
- Table 76: Global Lens Cleaning Stations Volume K Forecast, by Types 2020 & 2033
- Table 77: Global Lens Cleaning Stations Revenue undefined Forecast, by Country 2020 & 2033
- Table 78: Global Lens Cleaning Stations Volume K Forecast, by Country 2020 & 2033
- Table 79: China Lens Cleaning Stations Revenue (undefined) Forecast, by Application 2020 & 2033
- Table 80: China Lens Cleaning Stations Volume (K) Forecast, by Application 2020 & 2033
- Table 81: India Lens Cleaning Stations Revenue (undefined) Forecast, by Application 2020 & 2033
- Table 82: India Lens Cleaning Stations Volume (K) Forecast, by Application 2020 & 2033
- Table 83: Japan Lens Cleaning Stations Revenue (undefined) Forecast, by Application 2020 & 2033
- Table 84: Japan Lens Cleaning Stations Volume (K) Forecast, by Application 2020 & 2033
- Table 85: South Korea Lens Cleaning Stations Revenue (undefined) Forecast, by Application 2020 & 2033
- Table 86: South Korea Lens Cleaning Stations Volume (K) Forecast, by Application 2020 & 2033
- Table 87: ASEAN Lens Cleaning Stations Revenue (undefined) Forecast, by Application 2020 & 2033
- Table 88: ASEAN Lens Cleaning Stations Volume (K) Forecast, by Application 2020 & 2033
- Table 89: Oceania Lens Cleaning Stations Revenue (undefined) Forecast, by Application 2020 & 2033
- Table 90: Oceania Lens Cleaning Stations Volume (K) Forecast, by Application 2020 & 2033
- Table 91: Rest of Asia Pacific Lens Cleaning Stations Revenue (undefined) Forecast, by Application 2020 & 2033
- Table 92: Rest of Asia Pacific Lens Cleaning Stations Volume (K) Forecast, by Application 2020 & 2033
Frequently Asked Questions
1. What is the projected Compound Annual Growth Rate (CAGR) of the Lens Cleaning Stations?
The projected CAGR is approximately 7%.
2. Which companies are prominent players in the Lens Cleaning Stations?
Key companies in the market include Sellstrom Manufacturing, Honeywell, Bausch + Lomb, Kimberly-Clark.
3. What are the main segments of the Lens Cleaning Stations?
The market segments include Application, Types.
4. Can you provide details about the market size?
The market size is estimated to be USD XXX N/A as of 2022.
5. What are some drivers contributing to market growth?
N/A
6. What are the notable trends driving market growth?
N/A
7. Are there any restraints impacting market growth?
N/A
8. Can you provide examples of recent developments in the market?
N/A
9. What pricing options are available for accessing the report?
Pricing options include single-user, multi-user, and enterprise licenses priced at USD 3350.00, USD 5025.00, and USD 6700.00 respectively.
10. Is the market size provided in terms of value or volume?
The market size is provided in terms of value, measured in N/A and volume, measured in K.
11. Are there any specific market keywords associated with the report?
Yes, the market keyword associated with the report is "Lens Cleaning Stations," which aids in identifying and referencing the specific market segment covered.
12. How do I determine which pricing option suits my needs best?
The pricing options vary based on user requirements and access needs. Individual users may opt for single-user licenses, while businesses requiring broader access may choose multi-user or enterprise licenses for cost-effective access to the report.
13. Are there any additional resources or data provided in the Lens Cleaning Stations report?
While the report offers comprehensive insights, it's advisable to review the specific contents or supplementary materials provided to ascertain if additional resources or data are available.
14. How can I stay updated on further developments or reports in the Lens Cleaning Stations?
To stay informed about further developments, trends, and reports in the Lens Cleaning Stations, consider subscribing to industry newsletters, following relevant companies and organizations, or regularly checking reputable industry news sources and publications.
Methodology
Step 1 - Identification of Relevant Samples Size from Population Database


Step 2 - Approaches for Defining Global Market Size (Value, Volume* & Price*)

Note*: In applicable scenarios
Step 3 - Data Sources
Primary Research
- Web Analytics
- Survey Reports
- Research Institute
- Latest Research Reports
- Opinion Leaders
Secondary Research
- Annual Reports
- White Paper
- Latest Press Release
- Industry Association
- Paid Database
- Investor Presentations

Step 4 - Data Triangulation
Involves using different sources of information in order to increase the validity of a study
These sources are likely to be stakeholders in a program - participants, other researchers, program staff, other community members, and so on.
Then we put all data in single framework & apply various statistical tools to find out the dynamic on the market.
During the analysis stage, feedback from the stakeholder groups would be compared to determine areas of agreement as well as areas of divergence