

Key Insights
The Low Earth Orbit (LEO) Satellite Market is experiencing a robust expansion, poised for significant growth in the coming years. Projections indicate a market size of USD 11.81 billion in 2025, driven by a compelling compound annual growth rate (CAGR) of 11.9% through 2033. This surge is largely propelled by increasing demand in critical applications such as advanced communication networks, sophisticated Earth observation missions for environmental monitoring and resource management, and the ever-expanding realm of satellite navigation. The miniaturization of satellite technology and the increasing accessibility of space through cost-effective launch solutions are key enablers, fostering innovation across various market segments. Electric propulsion systems are gaining traction due to their efficiency and reduced environmental impact, further stimulating market development.
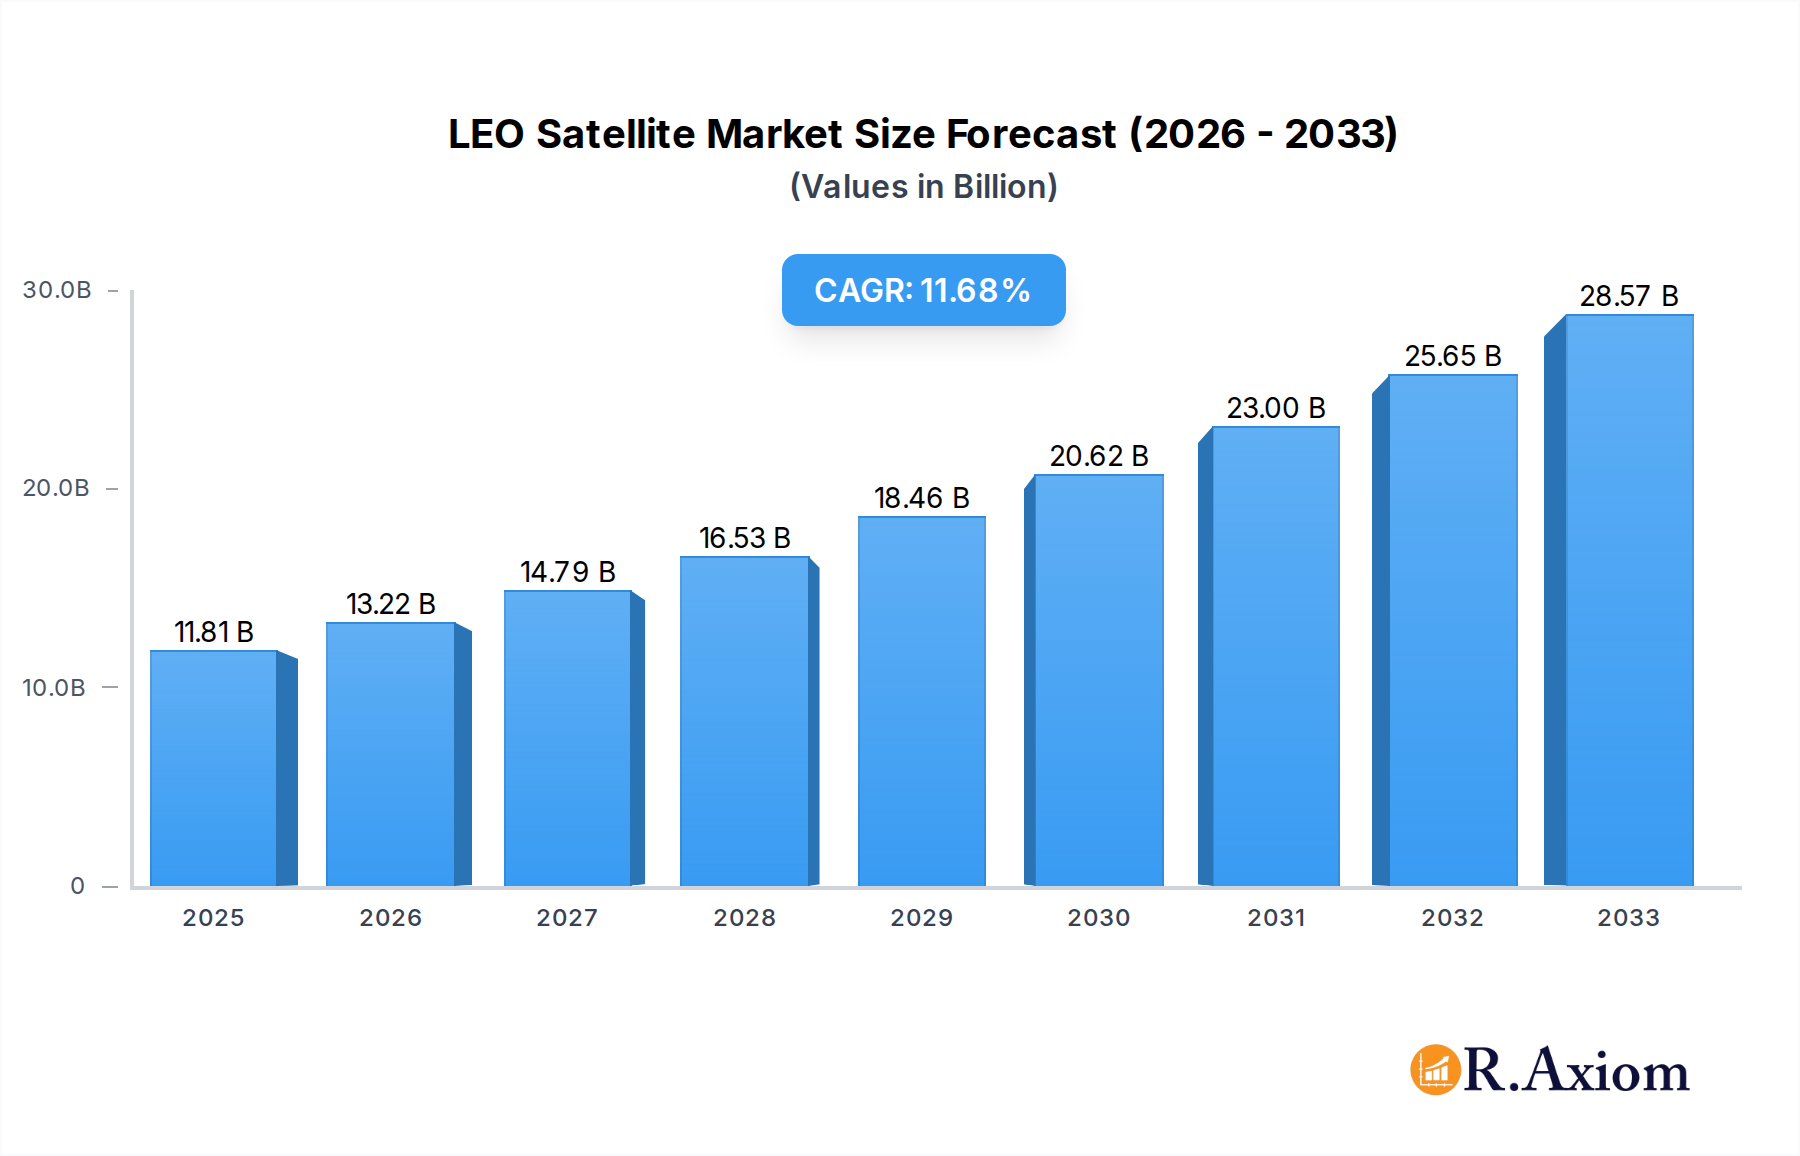
LEO Satellite Market Market Size (In Billion)
The market's dynamism is further underscored by a diverse range of satellite masses being deployed, from below 10 kg nano-satellites for specialized tasks to larger platforms exceeding 1000 kg for more complex payloads. End-user segments are similarly varied, with significant contributions from commercial ventures seeking to leverage satellite data and services, alongside critical military and government applications. Emerging trends in LEO include the rise of mega-constellations for global internet coverage and the increasing use of LEO satellites for scientific research and in-orbit servicing. While the market benefits from substantial investment and technological advancements, potential restraints such as increasing space debris and the need for robust regulatory frameworks governing LEO operations will require careful management to ensure sustainable growth.

LEO Satellite Market Company Market Share
This in-depth market research report provides a detailed analysis of the Low Earth Orbit (LEO) satellite market, examining its current landscape, future trajectory, and key growth drivers. Covering the study period from 2019 to 2033, with a base year of 2025 and a forecast period from 2025 to 2033, this report offers actionable insights for industry stakeholders, investors, and strategic decision-makers. The global LEO satellite market is projected to reach hundreds of billions by 2025, experiencing robust growth driven by advancements in communication technologies, expanding Earth observation capabilities, and increasing demand for global connectivity.
LEO Satellite Market Market Concentration & Innovation
The LEO satellite market is characterized by a moderate level of market concentration, with a few dominant players and a growing number of innovative startups. Space Exploration Technologies Corp. (SpaceX), China Aerospace Science and Technology Corporation (CASC), and Lockheed Martin Corporation are significant players, holding substantial market shares. Innovation is a primary driver, fueled by the miniaturization of satellites, advancements in propulsion technologies like electric propulsion, and the development of sophisticated data analytics for Earth observation. Regulatory frameworks are evolving to address satellite debris mitigation and spectrum allocation, crucial for sustainable growth. Product substitutes, such as terrestrial networks for certain communication applications, exist but are increasingly being complemented by LEO constellations for global coverage and low latency. End-user trends point towards increasing adoption by commercial entities for broadband internet, IoT services, and advanced geospatial intelligence. M&A activities are on the rise, with companies acquiring smaller players to expand their technological capabilities and market reach, exemplified by Planet Labs' acquisition of VanderSat for approximately $28 million.
LEO Satellite Market Industry Trends & Insights
The LEO satellite market is witnessing an unprecedented surge in growth, projected to achieve a Compound Annual Growth Rate (CAGR) of over 20% during the forecast period. This expansion is primarily propelled by the burgeoning demand for global broadband internet, enabling seamless connectivity in underserved regions and enhancing digital inclusion. The proliferation of Internet of Things (IoT) devices further fuels this growth, as LEO satellites offer cost-effective and scalable solutions for remote data collection and management. Advancements in miniaturization and mass production techniques have dramatically reduced the cost of satellite deployment, making LEO constellations economically viable. Electric propulsion systems are gaining traction due to their efficiency and lower thrust, contributing to longer mission durations and reduced operational costs. The competitive landscape is intensifying, with companies like SpaceX, OneWeb, and Amazon's Project Kuiper investing billions in launching vast constellations of small satellites. Earth observation applications are also a major growth segment, providing critical data for climate monitoring, disaster management, precision agriculture, and urban planning. The military and government sector is a significant end-user, leveraging LEO satellites for reconnaissance, communication, and intelligence gathering. The increasing focus on space sustainability, including active debris removal and collision avoidance, is becoming a critical trend shaping the industry's future. The market penetration of LEO satellite services is expected to rise significantly as more affordable and robust solutions become available, disrupting traditional communication and data services.
Dominant Markets & Segments in LEO Satellite Market
The Communication segment is poised to dominate the LEO satellite market, driven by the insatiable global demand for high-speed, low-latency internet access. This includes broadband services for consumers and enterprises, as well as specialized connectivity solutions for industries like maritime, aviation, and remote operations. The Commercial end-user segment is leading the adoption, fueled by businesses seeking to enhance operational efficiency, expand their reach, and leverage real-time data analytics.
- Application: Communication:
- Key Drivers: The need for ubiquitous global broadband, the growth of the IoT ecosystem, and the increasing reliance on remote work and digital services.
- Dominance Analysis: LEO constellations offer a compelling alternative to terrestrial infrastructure, particularly in areas with limited or no existing connectivity. The low latency provided by LEO satellites is crucial for applications like online gaming, video conferencing, and real-time data processing.
- Application: Earth Observation:
- Key Drivers: Growing demand for geospatial data for environmental monitoring, climate change research, disaster response, and precision agriculture.
- Dominance Analysis: The ability of LEO satellites to provide high-resolution, frequent imagery of the Earth's surface allows for timely and accurate decision-making across various sectors.
- Satellite Mass: 10-100kg:
- Key Drivers: The trend towards smaller, more agile satellites ("smallsats") lowers manufacturing and launch costs.
- Dominance Analysis: This mass category allows for the deployment of large constellations with reduced individual satellite complexity and cost, facilitating rapid scaling of services.
- End User: Commercial:
- Key Drivers: Businesses across various sectors are actively seeking to leverage satellite-enabled services for improved connectivity, data acquisition, and operational insights.
- Dominance Analysis: The commercial sector's pursuit of innovation and efficiency makes it a primary driver for the adoption of new satellite technologies and applications.
- Propulsion Tech: Electric:
- Key Drivers: High fuel efficiency, enabling longer operational life and greater maneuverability for satellites.
- Dominance Analysis: Electric propulsion is increasingly favored for its cost-effectiveness and ability to support sustained orbital operations, crucial for long-term LEO constellation missions.
LEO Satellite Market Product Developments
Product development in the LEO satellite market is characterized by a focus on miniaturization, increased payload capacity, and enhanced data processing capabilities. Companies are developing advanced satellite platforms capable of supporting a range of applications, from high-bandwidth communication to sophisticated Earth observation sensors. The competitive advantage lies in offering integrated solutions that combine satellite hardware, ground segment infrastructure, and data analytics platforms, providing end-to-end services. Technological trends such as phased array antennas for improved communication efficiency and AI-powered onboard processing for faster data insights are shaping the next generation of LEO satellites.
Report Scope & Segmentation Analysis
This report segments the LEO satellite market across several key dimensions to provide a granular understanding of market dynamics.
- Application: Communication, Earth Observation, Navigation, Space Observation, and Others. The Communication segment is expected to lead with significant growth projections driven by global connectivity demands.
- Satellite Mass: Below 10 Kg, 10-100kg, 100-500kg, 500-1000kg, and above 1000kg. The 10-100kg category is witnessing substantial growth due to the trend of small satellite constellations.
- End User: Commercial, Military & Government, and Other. The Commercial sector is anticipated to exhibit the highest market share and growth rate.
- Propulsion Tech: Electric, Gas based, Liquid Fuel. Electric propulsion is gaining prominence due to its efficiency and cost-effectiveness.
Key Drivers of LEO Satellite Market Growth
The LEO satellite market is propelled by several key drivers:
- Technological Advancements: Miniaturization of satellites, cost-effective launch services, and improvements in propulsion technologies are making LEO constellations more accessible and economically viable.
- Increasing Demand for Global Connectivity: The need for broadband internet in underserved regions, the proliferation of IoT devices, and the growing reliance on digital services worldwide are creating a massive market opportunity.
- Supportive Government Policies and Investments: Many governments are actively investing in space programs and promoting private sector involvement in LEO satellite development and deployment.
- Advancements in Earth Observation Capabilities: The demand for high-resolution, frequent geospatial data for various applications, including climate monitoring and disaster management, is a significant growth catalyst.
Challenges in the LEO Satellite Market Sector
Despite its robust growth, the LEO satellite market faces several challenges:
- Space Debris and Congestion: The increasing number of satellites in LEO raises concerns about space debris and the risk of collisions, necessitating robust mitigation strategies.
- Regulatory Hurdles: Navigating complex international regulations for satellite deployment, spectrum allocation, and orbital management can be challenging.
- Supply Chain Constraints: Rapid scaling of production for LEO satellites and their components can lead to supply chain bottlenecks.
- Competition and Pricing Pressures: The intense competition among satellite operators and the drive to offer cost-effective services can lead to pricing pressures.
Emerging Opportunities in LEO Satellite Market
Emerging opportunities in the LEO satellite market are abundant and diverse:
- Expansion of IoT Networks: Providing reliable connectivity for the burgeoning Internet of Things ecosystem in remote and previously unconnected areas.
- Next-Generation Broadband Services: Delivering high-speed, low-latency internet to consumers and businesses, potentially transforming industries like remote healthcare, education, and entertainment.
- In-Orbit Servicing and Assembly: Developing capabilities for satellite maintenance, repair, and in-orbit manufacturing to extend satellite lifespan and reduce space debris.
- Space-Based Manufacturing and Resource Utilization: Exploring the potential for LEO to serve as a platform for in-space manufacturing and the utilization of extraterrestrial resources.
Leading Players in the LEO Satellite Market Market
- Space Exploration Technologies Corp.
- German Orbital Systems
- GomSpace ApS
- SpaceQuest Ltd
- Lockheed Martin Corporation
- Airbus SE
- Astrocast
- Nano Avionics
- China Aerospace Science and Technology Corporation (CASC)
- Surrey Satellite Technology Ltd
- ROSCOSMOS
- Planet Labs Inc
Key Developments in LEO Satellite Market Industry
- January 2022: Planet Labs launches 44 SuperDove satellites on SpaceX's Falcon 9 rocket, significantly expanding its Earth observation constellation.
- November 2021: Planet Labs announced an agreement to acquire VanderSat, a Dutch company that provides data on Earth surface conditions, like soil moisture and land surface temperature, by combining public satellite data with proprietary algorithms, for about $28 million.
- January 2021: In January 2021, 5 Astrocast satellites were launched to collect and downlink data from weather buoys, wellhead sensors, pollution monitors, and other remote stations, underscoring the growing application of LEO for IoT connectivity.
Strategic Outlook for LEO Satellite Market Market
The strategic outlook for the LEO satellite market is exceptionally positive, driven by continuous innovation and expanding market applications. Key growth catalysts include the ongoing reduction in launch costs, the increasing demand for resilient and pervasive connectivity solutions, and the development of advanced satellite technologies enabling greater functionality and efficiency. The market is expected to witness further consolidation and strategic partnerships as companies strive to offer end-to-end solutions, from satellite deployment to data delivery and analysis. Emerging opportunities in areas like satellite-based quantum communication and advanced space situational awareness will shape the future landscape. The increasing focus on sustainability and responsible space operations will also be a critical factor influencing long-term market development.
LEO Satellite Market Segmentation
-
1. Application
- 1.1. Communication
- 1.2. Earth Observation
- 1.3. Navigation
- 1.4. Space Observation
- 1.5. Others
-
2. Satellite Mass
- 2.1. 10-100kg
- 2.2. 100-500kg
- 2.3. 500-1000kg
- 2.4. Below 10 Kg
- 2.5. above 1000kg
-
3. End User
- 3.1. Commercial
- 3.2. Military & Government
- 3.3. Other
-
4. Propulsion Tech
- 4.1. Electric
- 4.2. Gas based
- 4.3. Liquid Fuel
LEO Satellite Market Segmentation By Geography
-
1. North America
- 1.1. United States
- 1.2. Canada
- 1.3. Mexico
-
2. South America
- 2.1. Brazil
- 2.2. Argentina
- 2.3. Rest of South America
-
3. Europe
- 3.1. United Kingdom
- 3.2. Germany
- 3.3. France
- 3.4. Italy
- 3.5. Spain
- 3.6. Russia
- 3.7. Benelux
- 3.8. Nordics
- 3.9. Rest of Europe
-
4. Middle East & Africa
- 4.1. Turkey
- 4.2. Israel
- 4.3. GCC
- 4.4. North Africa
- 4.5. South Africa
- 4.6. Rest of Middle East & Africa
-
5. Asia Pacific
- 5.1. China
- 5.2. India
- 5.3. Japan
- 5.4. South Korea
- 5.5. ASEAN
- 5.6. Oceania
- 5.7. Rest of Asia Pacific
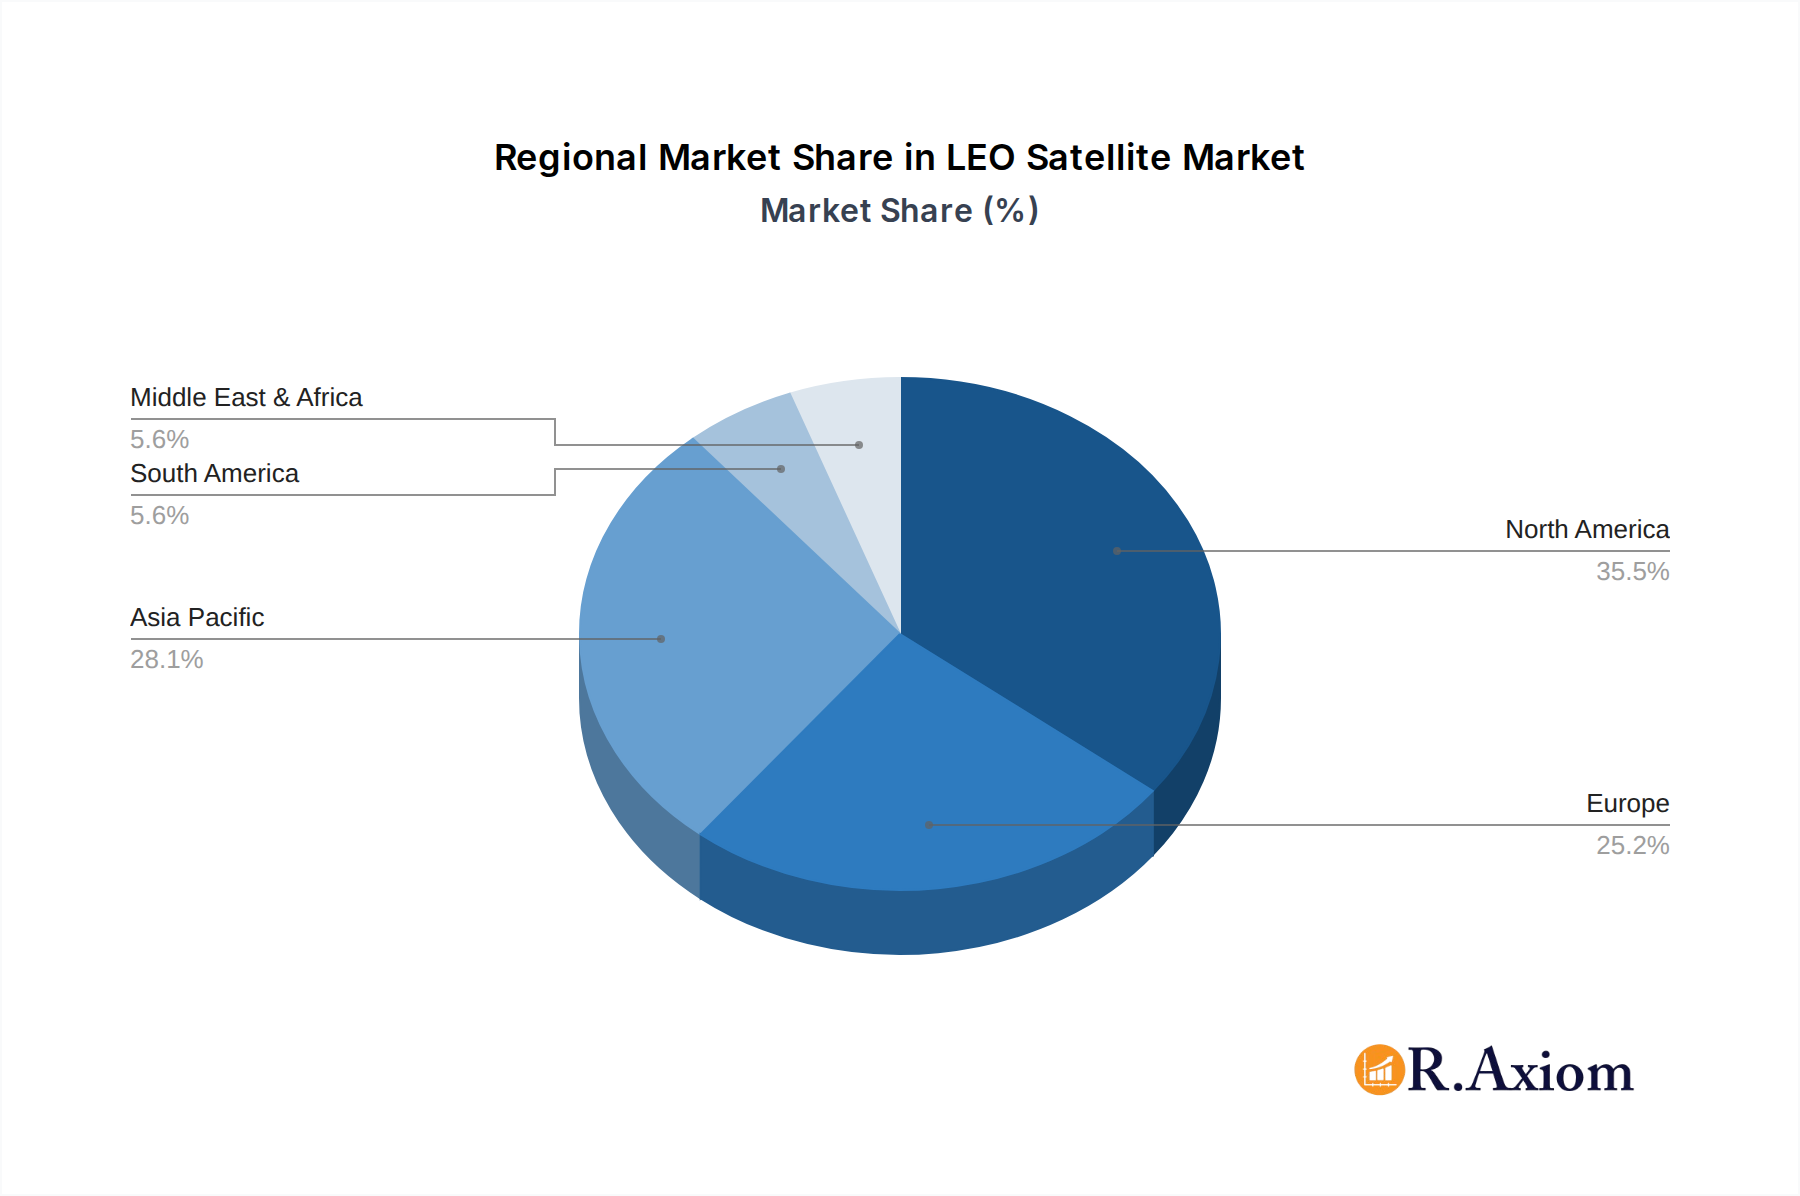
LEO Satellite Market Regional Market Share
Geographic Coverage of LEO Satellite Market
LEO Satellite Market REPORT HIGHLIGHTS
| Aspects | Details |
|---|---|
| Study Period | 2020-2034 |
| Base Year | 2025 |
| Estimated Year | 2026 |
| Forecast Period | 2026-2034 |
| Historical Period | 2020-2025 |
| Growth Rate | CAGR of 11.9% from 2020-2034 |
| Segmentation |
|
Table of Contents
- 1. Introduction
- 1.1. Research Scope
- 1.2. Market Segmentation
- 1.3. Research Objective
- 1.4. Definitions and Assumptions
- 2. Executive Summary
- 2.1. Market Snapshot
- 3. Market Dynamics
- 3.1. Market Drivers
- 3.2. Market Restrains
- 3.3. Market Trends
- 3.4. Market Opportunities
- 4. Market Factor Analysis
- 4.1. Porters Five Forces
- 4.1.1. Bargaining Power of Suppliers
- 4.1.2. Bargaining Power of Buyers
- 4.1.3. Threat of New Entrants
- 4.1.4. Threat of Substitutes
- 4.1.5. Competitive Rivalry
- 4.2. PESTEL analysis
- 4.3. BCG Analysis
- 4.3.1. Stars (High Growth, High Market Share)
- 4.3.2. Cash Cows (Low Growth, High Market Share)
- 4.3.3. Question Mark (High Growth, Low Market Share)
- 4.3.4. Dogs (Low Growth, Low Market Share)
- 4.4. Ansoff Matrix Analysis
- 4.5. Supply Chain Analysis
- 4.6. Regulatory Landscape
- 4.7. Current Market Potential and Opportunity Assessment (TAM–SAM–SOM Framework)
- 4.8. RAX Analyst Note
- 4.1. Porters Five Forces
- 5. Market Analysis, Insights and Forecast 2021-2033
- 5.1. Market Analysis, Insights and Forecast - by Application
- 5.1.1. Communication
- 5.1.2. Earth Observation
- 5.1.3. Navigation
- 5.1.4. Space Observation
- 5.1.5. Others
- 5.2. Market Analysis, Insights and Forecast - by Satellite Mass
- 5.2.1. 10-100kg
- 5.2.2. 100-500kg
- 5.2.3. 500-1000kg
- 5.2.4. Below 10 Kg
- 5.2.5. above 1000kg
- 5.3. Market Analysis, Insights and Forecast - by End User
- 5.3.1. Commercial
- 5.3.2. Military & Government
- 5.3.3. Other
- 5.4. Market Analysis, Insights and Forecast - by Propulsion Tech
- 5.4.1. Electric
- 5.4.2. Gas based
- 5.4.3. Liquid Fuel
- 5.5. Market Analysis, Insights and Forecast - by Region
- 5.5.1. North America
- 5.5.2. South America
- 5.5.3. Europe
- 5.5.4. Middle East & Africa
- 5.5.5. Asia Pacific
- 5.1. Market Analysis, Insights and Forecast - by Application
- 6. Global LEO Satellite Market Analysis, Insights and Forecast, 2021-2033
- 6.1. Market Analysis, Insights and Forecast - by Application
- 6.1.1. Communication
- 6.1.2. Earth Observation
- 6.1.3. Navigation
- 6.1.4. Space Observation
- 6.1.5. Others
- 6.2. Market Analysis, Insights and Forecast - by Satellite Mass
- 6.2.1. 10-100kg
- 6.2.2. 100-500kg
- 6.2.3. 500-1000kg
- 6.2.4. Below 10 Kg
- 6.2.5. above 1000kg
- 6.3. Market Analysis, Insights and Forecast - by End User
- 6.3.1. Commercial
- 6.3.2. Military & Government
- 6.3.3. Other
- 6.4. Market Analysis, Insights and Forecast - by Propulsion Tech
- 6.4.1. Electric
- 6.4.2. Gas based
- 6.4.3. Liquid Fuel
- 6.1. Market Analysis, Insights and Forecast - by Application
- 7. North America LEO Satellite Market Analysis, Insights and Forecast, 2020-2032
- 7.1. Market Analysis, Insights and Forecast - by Application
- 7.1.1. Communication
- 7.1.2. Earth Observation
- 7.1.3. Navigation
- 7.1.4. Space Observation
- 7.1.5. Others
- 7.2. Market Analysis, Insights and Forecast - by Satellite Mass
- 7.2.1. 10-100kg
- 7.2.2. 100-500kg
- 7.2.3. 500-1000kg
- 7.2.4. Below 10 Kg
- 7.2.5. above 1000kg
- 7.3. Market Analysis, Insights and Forecast - by End User
- 7.3.1. Commercial
- 7.3.2. Military & Government
- 7.3.3. Other
- 7.4. Market Analysis, Insights and Forecast - by Propulsion Tech
- 7.4.1. Electric
- 7.4.2. Gas based
- 7.4.3. Liquid Fuel
- 7.1. Market Analysis, Insights and Forecast - by Application
- 8. South America LEO Satellite Market Analysis, Insights and Forecast, 2020-2032
- 8.1. Market Analysis, Insights and Forecast - by Application
- 8.1.1. Communication
- 8.1.2. Earth Observation
- 8.1.3. Navigation
- 8.1.4. Space Observation
- 8.1.5. Others
- 8.2. Market Analysis, Insights and Forecast - by Satellite Mass
- 8.2.1. 10-100kg
- 8.2.2. 100-500kg
- 8.2.3. 500-1000kg
- 8.2.4. Below 10 Kg
- 8.2.5. above 1000kg
- 8.3. Market Analysis, Insights and Forecast - by End User
- 8.3.1. Commercial
- 8.3.2. Military & Government
- 8.3.3. Other
- 8.4. Market Analysis, Insights and Forecast - by Propulsion Tech
- 8.4.1. Electric
- 8.4.2. Gas based
- 8.4.3. Liquid Fuel
- 8.1. Market Analysis, Insights and Forecast - by Application
- 9. Europe LEO Satellite Market Analysis, Insights and Forecast, 2020-2032
- 9.1. Market Analysis, Insights and Forecast - by Application
- 9.1.1. Communication
- 9.1.2. Earth Observation
- 9.1.3. Navigation
- 9.1.4. Space Observation
- 9.1.5. Others
- 9.2. Market Analysis, Insights and Forecast - by Satellite Mass
- 9.2.1. 10-100kg
- 9.2.2. 100-500kg
- 9.2.3. 500-1000kg
- 9.2.4. Below 10 Kg
- 9.2.5. above 1000kg
- 9.3. Market Analysis, Insights and Forecast - by End User
- 9.3.1. Commercial
- 9.3.2. Military & Government
- 9.3.3. Other
- 9.4. Market Analysis, Insights and Forecast - by Propulsion Tech
- 9.4.1. Electric
- 9.4.2. Gas based
- 9.4.3. Liquid Fuel
- 9.1. Market Analysis, Insights and Forecast - by Application
- 10. Middle East & Africa LEO Satellite Market Analysis, Insights and Forecast, 2020-2032
- 10.1. Market Analysis, Insights and Forecast - by Application
- 10.1.1. Communication
- 10.1.2. Earth Observation
- 10.1.3. Navigation
- 10.1.4. Space Observation
- 10.1.5. Others
- 10.2. Market Analysis, Insights and Forecast - by Satellite Mass
- 10.2.1. 10-100kg
- 10.2.2. 100-500kg
- 10.2.3. 500-1000kg
- 10.2.4. Below 10 Kg
- 10.2.5. above 1000kg
- 10.3. Market Analysis, Insights and Forecast - by End User
- 10.3.1. Commercial
- 10.3.2. Military & Government
- 10.3.3. Other
- 10.4. Market Analysis, Insights and Forecast - by Propulsion Tech
- 10.4.1. Electric
- 10.4.2. Gas based
- 10.4.3. Liquid Fuel
- 10.1. Market Analysis, Insights and Forecast - by Application
- 11. Asia Pacific LEO Satellite Market Analysis, Insights and Forecast, 2020-2032
- 11.1. Market Analysis, Insights and Forecast - by Application
- 11.1.1. Communication
- 11.1.2. Earth Observation
- 11.1.3. Navigation
- 11.1.4. Space Observation
- 11.1.5. Others
- 11.2. Market Analysis, Insights and Forecast - by Satellite Mass
- 11.2.1. 10-100kg
- 11.2.2. 100-500kg
- 11.2.3. 500-1000kg
- 11.2.4. Below 10 Kg
- 11.2.5. above 1000kg
- 11.3. Market Analysis, Insights and Forecast - by End User
- 11.3.1. Commercial
- 11.3.2. Military & Government
- 11.3.3. Other
- 11.4. Market Analysis, Insights and Forecast - by Propulsion Tech
- 11.4.1. Electric
- 11.4.2. Gas based
- 11.4.3. Liquid Fuel
- 11.1. Market Analysis, Insights and Forecast - by Application
- 12. Competitive Analysis
- 12.1. Company Profiles
- 12.1.1 Space Exploration Technologies Corp
- 12.1.1.1. Company Overview
- 12.1.1.2. Products
- 12.1.1.3. Company Financials
- 12.1.1.4. SWOT Analysis
- 12.1.2 German Orbital Systems
- 12.1.2.1. Company Overview
- 12.1.2.2. Products
- 12.1.2.3. Company Financials
- 12.1.2.4. SWOT Analysis
- 12.1.3 GomSpaceApS
- 12.1.3.1. Company Overview
- 12.1.3.2. Products
- 12.1.3.3. Company Financials
- 12.1.3.4. SWOT Analysis
- 12.1.4 SpaceQuest Ltd
- 12.1.4.1. Company Overview
- 12.1.4.2. Products
- 12.1.4.3. Company Financials
- 12.1.4.4. SWOT Analysis
- 12.1.5 Lockheed Martin Corporation
- 12.1.5.1. Company Overview
- 12.1.5.2. Products
- 12.1.5.3. Company Financials
- 12.1.5.4. SWOT Analysis
- 12.1.6 Airbus SE
- 12.1.6.1. Company Overview
- 12.1.6.2. Products
- 12.1.6.3. Company Financials
- 12.1.6.4. SWOT Analysis
- 12.1.7 Astrocast
- 12.1.7.1. Company Overview
- 12.1.7.2. Products
- 12.1.7.3. Company Financials
- 12.1.7.4. SWOT Analysis
- 12.1.8 Nano Avionics
- 12.1.8.1. Company Overview
- 12.1.8.2. Products
- 12.1.8.3. Company Financials
- 12.1.8.4. SWOT Analysis
- 12.1.9 China Aerospace Science and Technology Corporation (CASC)
- 12.1.9.1. Company Overview
- 12.1.9.2. Products
- 12.1.9.3. Company Financials
- 12.1.9.4. SWOT Analysis
- 12.1.10 Surrey Satellite Technology Ltd
- 12.1.10.1. Company Overview
- 12.1.10.2. Products
- 12.1.10.3. Company Financials
- 12.1.10.4. SWOT Analysis
- 12.1.11 ROSCOSMOS
- 12.1.11.1. Company Overview
- 12.1.11.2. Products
- 12.1.11.3. Company Financials
- 12.1.11.4. SWOT Analysis
- 12.1.12 Planet Labs Inc
- 12.1.12.1. Company Overview
- 12.1.12.2. Products
- 12.1.12.3. Company Financials
- 12.1.12.4. SWOT Analysis
- 12.1.1 Space Exploration Technologies Corp
- 12.2. Market Entropy
- 12.2.1 Company's Key Areas Served
- 12.2.2 Recent Developments
- 12.3. Company Market Share Analysis 2025
- 12.3.1 Top 5 Companies Market Share Analysis
- 12.3.2 Top 3 Companies Market Share Analysis
- 12.4. List of Potential Customers
- 13. Research Methodology
List of Figures
- Figure 1: Global LEO Satellite Market Revenue Breakdown (billion, %) by Region 2025 & 2033
- Figure 2: North America LEO Satellite Market Revenue (billion), by Application 2025 & 2033
- Figure 3: North America LEO Satellite Market Revenue Share (%), by Application 2025 & 2033
- Figure 4: North America LEO Satellite Market Revenue (billion), by Satellite Mass 2025 & 2033
- Figure 5: North America LEO Satellite Market Revenue Share (%), by Satellite Mass 2025 & 2033
- Figure 6: North America LEO Satellite Market Revenue (billion), by End User 2025 & 2033
- Figure 7: North America LEO Satellite Market Revenue Share (%), by End User 2025 & 2033
- Figure 8: North America LEO Satellite Market Revenue (billion), by Propulsion Tech 2025 & 2033
- Figure 9: North America LEO Satellite Market Revenue Share (%), by Propulsion Tech 2025 & 2033
- Figure 10: North America LEO Satellite Market Revenue (billion), by Country 2025 & 2033
- Figure 11: North America LEO Satellite Market Revenue Share (%), by Country 2025 & 2033
- Figure 12: South America LEO Satellite Market Revenue (billion), by Application 2025 & 2033
- Figure 13: South America LEO Satellite Market Revenue Share (%), by Application 2025 & 2033
- Figure 14: South America LEO Satellite Market Revenue (billion), by Satellite Mass 2025 & 2033
- Figure 15: South America LEO Satellite Market Revenue Share (%), by Satellite Mass 2025 & 2033
- Figure 16: South America LEO Satellite Market Revenue (billion), by End User 2025 & 2033
- Figure 17: South America LEO Satellite Market Revenue Share (%), by End User 2025 & 2033
- Figure 18: South America LEO Satellite Market Revenue (billion), by Propulsion Tech 2025 & 2033
- Figure 19: South America LEO Satellite Market Revenue Share (%), by Propulsion Tech 2025 & 2033
- Figure 20: South America LEO Satellite Market Revenue (billion), by Country 2025 & 2033
- Figure 21: South America LEO Satellite Market Revenue Share (%), by Country 2025 & 2033
- Figure 22: Europe LEO Satellite Market Revenue (billion), by Application 2025 & 2033
- Figure 23: Europe LEO Satellite Market Revenue Share (%), by Application 2025 & 2033
- Figure 24: Europe LEO Satellite Market Revenue (billion), by Satellite Mass 2025 & 2033
- Figure 25: Europe LEO Satellite Market Revenue Share (%), by Satellite Mass 2025 & 2033
- Figure 26: Europe LEO Satellite Market Revenue (billion), by End User 2025 & 2033
- Figure 27: Europe LEO Satellite Market Revenue Share (%), by End User 2025 & 2033
- Figure 28: Europe LEO Satellite Market Revenue (billion), by Propulsion Tech 2025 & 2033
- Figure 29: Europe LEO Satellite Market Revenue Share (%), by Propulsion Tech 2025 & 2033
- Figure 30: Europe LEO Satellite Market Revenue (billion), by Country 2025 & 2033
- Figure 31: Europe LEO Satellite Market Revenue Share (%), by Country 2025 & 2033
- Figure 32: Middle East & Africa LEO Satellite Market Revenue (billion), by Application 2025 & 2033
- Figure 33: Middle East & Africa LEO Satellite Market Revenue Share (%), by Application 2025 & 2033
- Figure 34: Middle East & Africa LEO Satellite Market Revenue (billion), by Satellite Mass 2025 & 2033
- Figure 35: Middle East & Africa LEO Satellite Market Revenue Share (%), by Satellite Mass 2025 & 2033
- Figure 36: Middle East & Africa LEO Satellite Market Revenue (billion), by End User 2025 & 2033
- Figure 37: Middle East & Africa LEO Satellite Market Revenue Share (%), by End User 2025 & 2033
- Figure 38: Middle East & Africa LEO Satellite Market Revenue (billion), by Propulsion Tech 2025 & 2033
- Figure 39: Middle East & Africa LEO Satellite Market Revenue Share (%), by Propulsion Tech 2025 & 2033
- Figure 40: Middle East & Africa LEO Satellite Market Revenue (billion), by Country 2025 & 2033
- Figure 41: Middle East & Africa LEO Satellite Market Revenue Share (%), by Country 2025 & 2033
- Figure 42: Asia Pacific LEO Satellite Market Revenue (billion), by Application 2025 & 2033
- Figure 43: Asia Pacific LEO Satellite Market Revenue Share (%), by Application 2025 & 2033
- Figure 44: Asia Pacific LEO Satellite Market Revenue (billion), by Satellite Mass 2025 & 2033
- Figure 45: Asia Pacific LEO Satellite Market Revenue Share (%), by Satellite Mass 2025 & 2033
- Figure 46: Asia Pacific LEO Satellite Market Revenue (billion), by End User 2025 & 2033
- Figure 47: Asia Pacific LEO Satellite Market Revenue Share (%), by End User 2025 & 2033
- Figure 48: Asia Pacific LEO Satellite Market Revenue (billion), by Propulsion Tech 2025 & 2033
- Figure 49: Asia Pacific LEO Satellite Market Revenue Share (%), by Propulsion Tech 2025 & 2033
- Figure 50: Asia Pacific LEO Satellite Market Revenue (billion), by Country 2025 & 2033
- Figure 51: Asia Pacific LEO Satellite Market Revenue Share (%), by Country 2025 & 2033
List of Tables
- Table 1: Global LEO Satellite Market Revenue billion Forecast, by Application 2020 & 2033
- Table 2: Global LEO Satellite Market Revenue billion Forecast, by Satellite Mass 2020 & 2033
- Table 3: Global LEO Satellite Market Revenue billion Forecast, by End User 2020 & 2033
- Table 4: Global LEO Satellite Market Revenue billion Forecast, by Propulsion Tech 2020 & 2033
- Table 5: Global LEO Satellite Market Revenue billion Forecast, by Region 2020 & 2033
- Table 6: Global LEO Satellite Market Revenue billion Forecast, by Application 2020 & 2033
- Table 7: Global LEO Satellite Market Revenue billion Forecast, by Satellite Mass 2020 & 2033
- Table 8: Global LEO Satellite Market Revenue billion Forecast, by End User 2020 & 2033
- Table 9: Global LEO Satellite Market Revenue billion Forecast, by Propulsion Tech 2020 & 2033
- Table 10: Global LEO Satellite Market Revenue billion Forecast, by Country 2020 & 2033
- Table 11: United States LEO Satellite Market Revenue (billion) Forecast, by Application 2020 & 2033
- Table 12: Canada LEO Satellite Market Revenue (billion) Forecast, by Application 2020 & 2033
- Table 13: Mexico LEO Satellite Market Revenue (billion) Forecast, by Application 2020 & 2033
- Table 14: Global LEO Satellite Market Revenue billion Forecast, by Application 2020 & 2033
- Table 15: Global LEO Satellite Market Revenue billion Forecast, by Satellite Mass 2020 & 2033
- Table 16: Global LEO Satellite Market Revenue billion Forecast, by End User 2020 & 2033
- Table 17: Global LEO Satellite Market Revenue billion Forecast, by Propulsion Tech 2020 & 2033
- Table 18: Global LEO Satellite Market Revenue billion Forecast, by Country 2020 & 2033
- Table 19: Brazil LEO Satellite Market Revenue (billion) Forecast, by Application 2020 & 2033
- Table 20: Argentina LEO Satellite Market Revenue (billion) Forecast, by Application 2020 & 2033
- Table 21: Rest of South America LEO Satellite Market Revenue (billion) Forecast, by Application 2020 & 2033
- Table 22: Global LEO Satellite Market Revenue billion Forecast, by Application 2020 & 2033
- Table 23: Global LEO Satellite Market Revenue billion Forecast, by Satellite Mass 2020 & 2033
- Table 24: Global LEO Satellite Market Revenue billion Forecast, by End User 2020 & 2033
- Table 25: Global LEO Satellite Market Revenue billion Forecast, by Propulsion Tech 2020 & 2033
- Table 26: Global LEO Satellite Market Revenue billion Forecast, by Country 2020 & 2033
- Table 27: United Kingdom LEO Satellite Market Revenue (billion) Forecast, by Application 2020 & 2033
- Table 28: Germany LEO Satellite Market Revenue (billion) Forecast, by Application 2020 & 2033
- Table 29: France LEO Satellite Market Revenue (billion) Forecast, by Application 2020 & 2033
- Table 30: Italy LEO Satellite Market Revenue (billion) Forecast, by Application 2020 & 2033
- Table 31: Spain LEO Satellite Market Revenue (billion) Forecast, by Application 2020 & 2033
- Table 32: Russia LEO Satellite Market Revenue (billion) Forecast, by Application 2020 & 2033
- Table 33: Benelux LEO Satellite Market Revenue (billion) Forecast, by Application 2020 & 2033
- Table 34: Nordics LEO Satellite Market Revenue (billion) Forecast, by Application 2020 & 2033
- Table 35: Rest of Europe LEO Satellite Market Revenue (billion) Forecast, by Application 2020 & 2033
- Table 36: Global LEO Satellite Market Revenue billion Forecast, by Application 2020 & 2033
- Table 37: Global LEO Satellite Market Revenue billion Forecast, by Satellite Mass 2020 & 2033
- Table 38: Global LEO Satellite Market Revenue billion Forecast, by End User 2020 & 2033
- Table 39: Global LEO Satellite Market Revenue billion Forecast, by Propulsion Tech 2020 & 2033
- Table 40: Global LEO Satellite Market Revenue billion Forecast, by Country 2020 & 2033
- Table 41: Turkey LEO Satellite Market Revenue (billion) Forecast, by Application 2020 & 2033
- Table 42: Israel LEO Satellite Market Revenue (billion) Forecast, by Application 2020 & 2033
- Table 43: GCC LEO Satellite Market Revenue (billion) Forecast, by Application 2020 & 2033
- Table 44: North Africa LEO Satellite Market Revenue (billion) Forecast, by Application 2020 & 2033
- Table 45: South Africa LEO Satellite Market Revenue (billion) Forecast, by Application 2020 & 2033
- Table 46: Rest of Middle East & Africa LEO Satellite Market Revenue (billion) Forecast, by Application 2020 & 2033
- Table 47: Global LEO Satellite Market Revenue billion Forecast, by Application 2020 & 2033
- Table 48: Global LEO Satellite Market Revenue billion Forecast, by Satellite Mass 2020 & 2033
- Table 49: Global LEO Satellite Market Revenue billion Forecast, by End User 2020 & 2033
- Table 50: Global LEO Satellite Market Revenue billion Forecast, by Propulsion Tech 2020 & 2033
- Table 51: Global LEO Satellite Market Revenue billion Forecast, by Country 2020 & 2033
- Table 52: China LEO Satellite Market Revenue (billion) Forecast, by Application 2020 & 2033
- Table 53: India LEO Satellite Market Revenue (billion) Forecast, by Application 2020 & 2033
- Table 54: Japan LEO Satellite Market Revenue (billion) Forecast, by Application 2020 & 2033
- Table 55: South Korea LEO Satellite Market Revenue (billion) Forecast, by Application 2020 & 2033
- Table 56: ASEAN LEO Satellite Market Revenue (billion) Forecast, by Application 2020 & 2033
- Table 57: Oceania LEO Satellite Market Revenue (billion) Forecast, by Application 2020 & 2033
- Table 58: Rest of Asia Pacific LEO Satellite Market Revenue (billion) Forecast, by Application 2020 & 2033
Frequently Asked Questions
1. What is the projected Compound Annual Growth Rate (CAGR) of the LEO Satellite Market?
The projected CAGR is approximately 11.9%.
2. Which companies are prominent players in the LEO Satellite Market?
Key companies in the market include Space Exploration Technologies Corp, German Orbital Systems, GomSpaceApS, SpaceQuest Ltd, Lockheed Martin Corporation, Airbus SE, Astrocast, Nano Avionics, China Aerospace Science and Technology Corporation (CASC), Surrey Satellite Technology Ltd, ROSCOSMOS, Planet Labs Inc.
3. What are the main segments of the LEO Satellite Market?
The market segments include Application, Satellite Mass, End User, Propulsion Tech.
4. Can you provide details about the market size?
The market size is estimated to be USD 11.81 billion as of 2022.
5. What are some drivers contributing to market growth?
N/A
6. What are the notable trends driving market growth?
North America is driving the market demand with a market share of 85.4% in 2029.
7. Are there any restraints impacting market growth?
N/A
8. Can you provide examples of recent developments in the market?
January 2022: Planet Labs launches 44 SuperDove satellites on SpaceX's Falcon 9 rocketNovember 2021: Planet Labs announced an agreement to acquire VanderSat, a Dutch company that provides data on Earth surface conditions, like soil moisture and land surface temperature, by combining public satellite data with proprietary algorithms, for about $28 million.January 2021: In January 2021, 5 Astrocast satellites were launched to collect and downlink data from weather buoys, wellhead sensors, pollution monitors, and other remote stations.
9. What pricing options are available for accessing the report?
Pricing options include single-user, multi-user, and enterprise licenses priced at USD 3800, USD 4500, and USD 5800 respectively.
10. Is the market size provided in terms of value or volume?
The market size is provided in terms of value, measured in billion.
11. Are there any specific market keywords associated with the report?
Yes, the market keyword associated with the report is "LEO Satellite Market," which aids in identifying and referencing the specific market segment covered.
12. How do I determine which pricing option suits my needs best?
The pricing options vary based on user requirements and access needs. Individual users may opt for single-user licenses, while businesses requiring broader access may choose multi-user or enterprise licenses for cost-effective access to the report.
13. Are there any additional resources or data provided in the LEO Satellite Market report?
While the report offers comprehensive insights, it's advisable to review the specific contents or supplementary materials provided to ascertain if additional resources or data are available.
14. How can I stay updated on further developments or reports in the LEO Satellite Market?
To stay informed about further developments, trends, and reports in the LEO Satellite Market, consider subscribing to industry newsletters, following relevant companies and organizations, or regularly checking reputable industry news sources and publications.
Methodology
Step 1 - Identification of Relevant Samples Size from Population Database


Step 2 - Approaches for Defining Global Market Size (Value, Volume* & Price*)

Note*: In applicable scenarios
Step 3 - Data Sources
Primary Research
- Web Analytics
- Survey Reports
- Research Institute
- Latest Research Reports
- Opinion Leaders
Secondary Research
- Annual Reports
- White Paper
- Latest Press Release
- Industry Association
- Paid Database
- Investor Presentations

Step 4 - Data Triangulation
Involves using different sources of information in order to increase the validity of a study
These sources are likely to be stakeholders in a program - participants, other researchers, program staff, other community members, and so on.
Then we put all data in single framework & apply various statistical tools to find out the dynamic on the market.
During the analysis stage, feedback from the stakeholder groups would be compared to determine areas of agreement as well as areas of divergence