Demand Patterns in Liquid Hydrogen Industry Market: Projections to 2033

Liquid Hydrogen Industry by Distribution (Cryogenic Tank, High-Pressure Tube Trailers), by End-user Industry (Automotive, Aerospace (including Outer Space), Marine, Other End-User Industries), by Asia Pacific (China, India, Japan, South Korea, Rest of Asia Pacific), by North America (United States, Canada, Mexico), by Europe (Germany, United Kingdom, Italy, France, Rest of Europe), by Rest of the World (South America, Middle East and Africa) Forecast 2025-2033

Jul 12 2025
Base Year: 2024

180 Pages
Main Logo

Demand Patterns in Liquid Hydrogen Industry Market: Projections to 2033


Home
Industries
Chemicals & Materials
sponsor image
sponsor image
sponsor image
sponsor image

Tailored for you

  • In-depth Analysis Tailored to Specified Regions or Segments
  • Company Profiles Customized to User Preferences
  • Comprehensive Insights Focused on Specific Segments or Regions
  • Customized Evaluation of Competitive Landscape to Meet Your Needs
  • Tailored Customization to Address Other Specific Requirements
Ask for customization


Key Insights

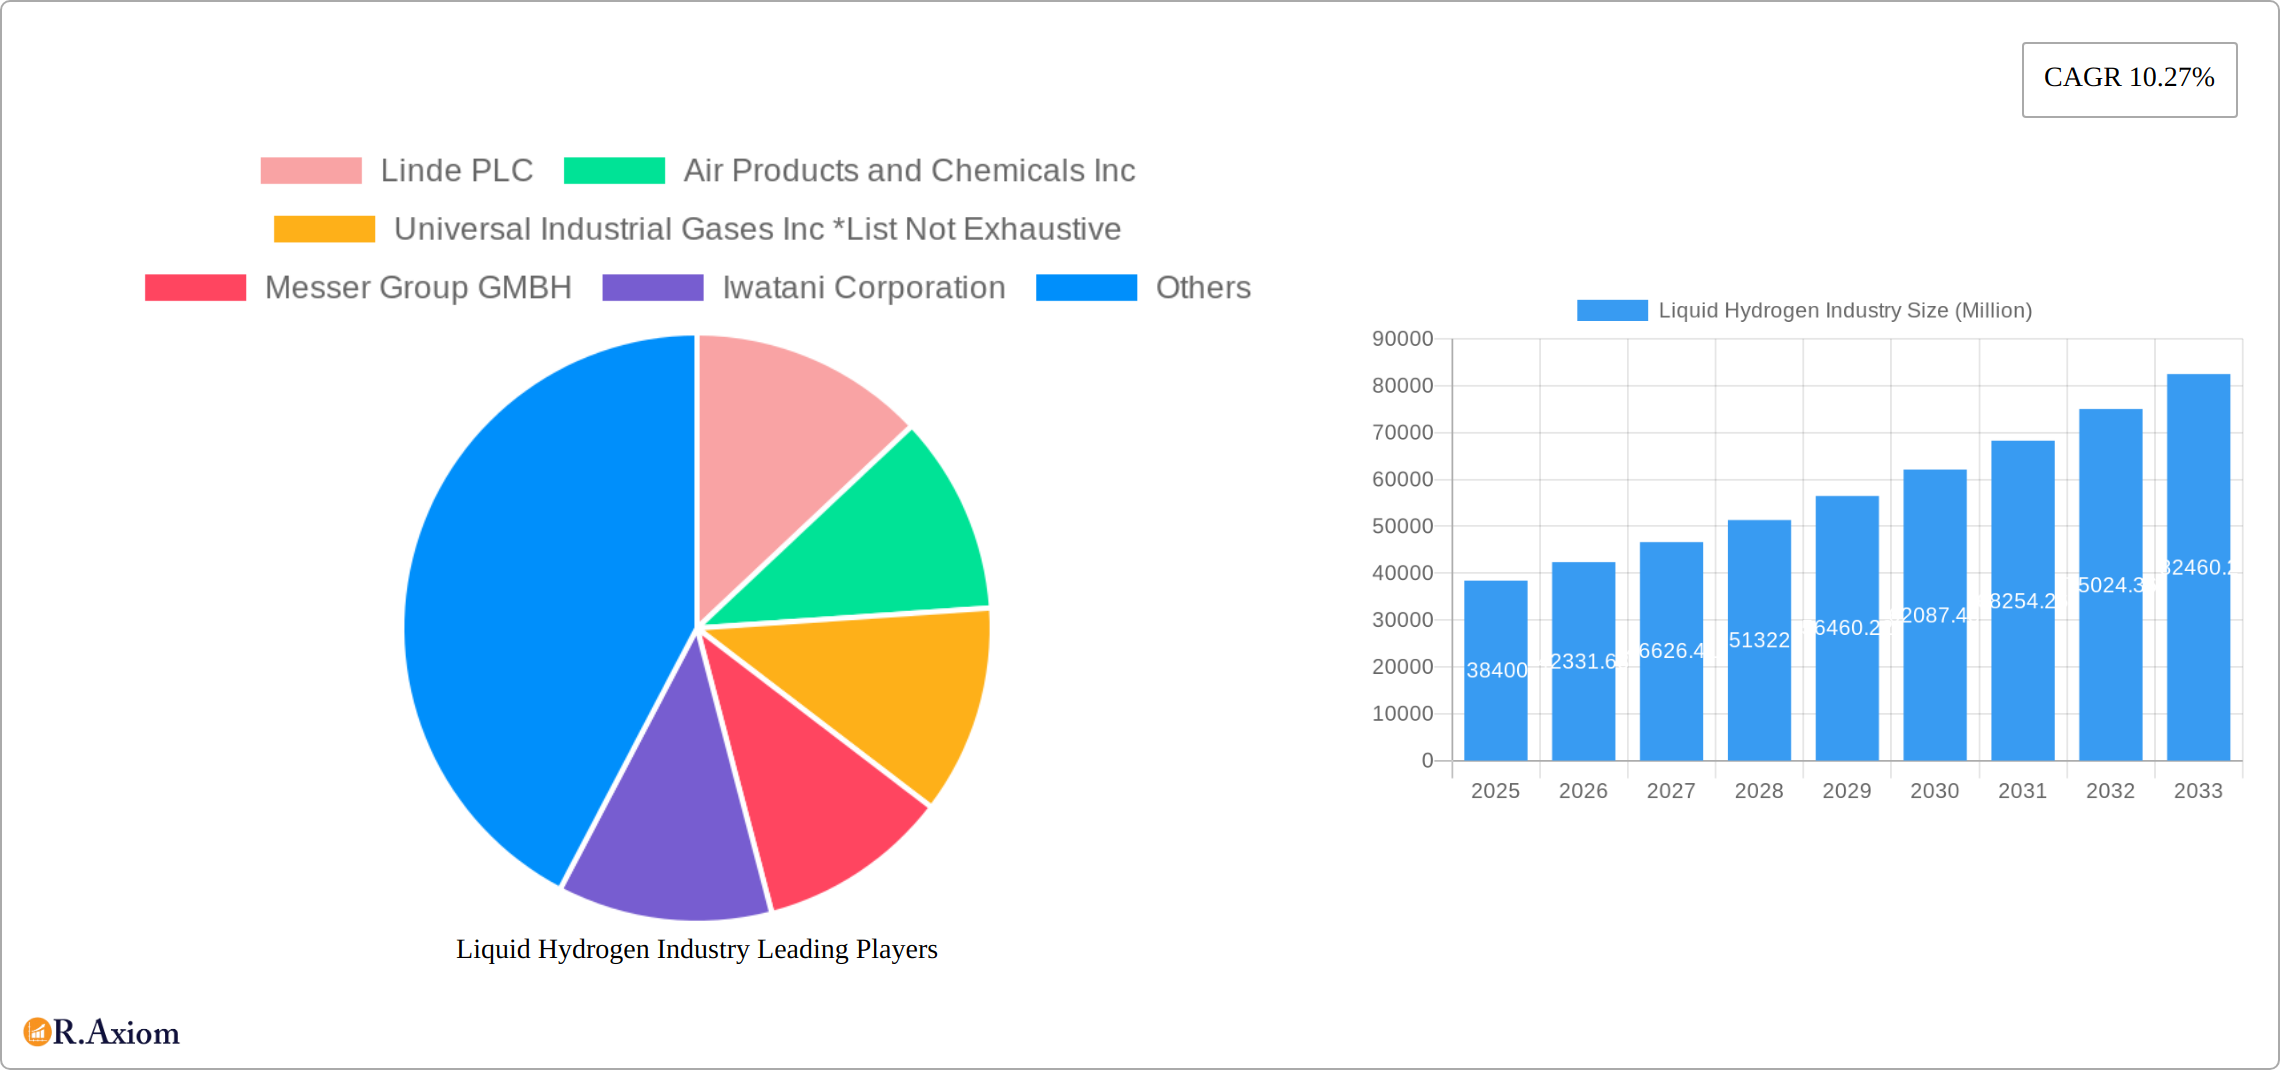
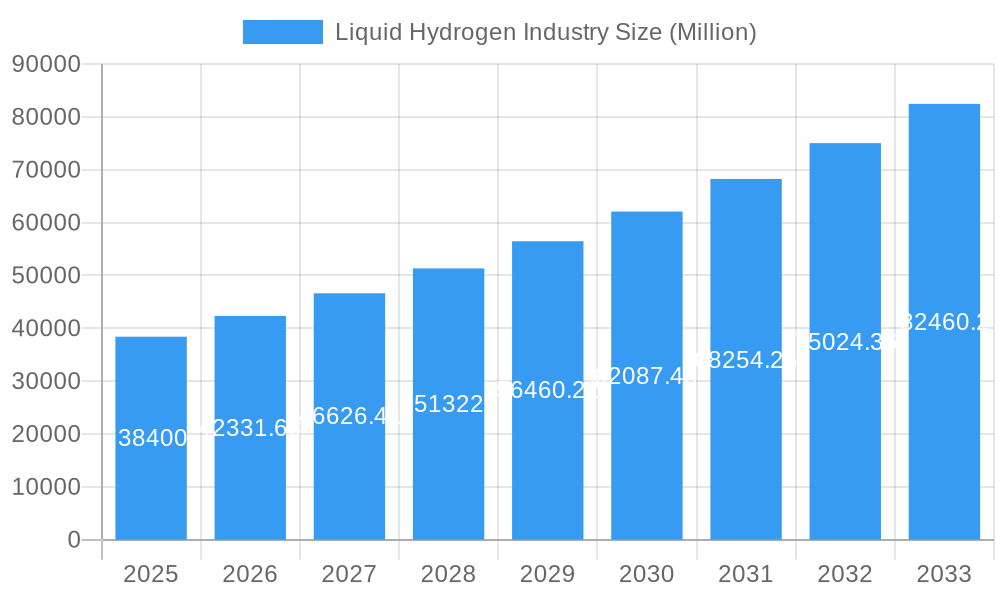
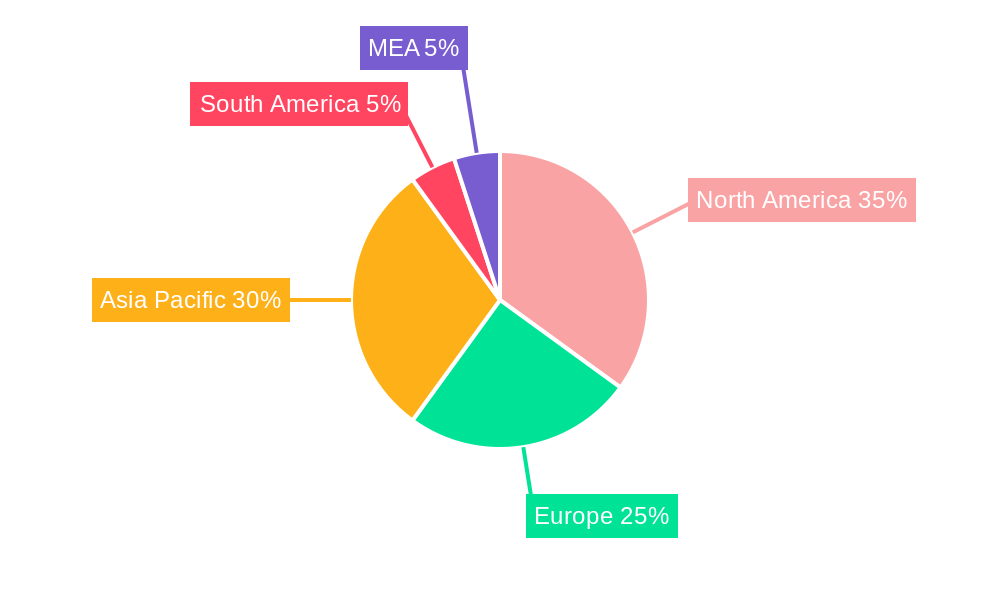
The liquid hydrogen market, valued at $38,400 million in 2025, is projected to experience robust growth, driven by the increasing adoption of hydrogen fuel cell technology across various sectors. A compound annual growth rate (CAGR) of 10.27% from 2025 to 2033 indicates a significant expansion of this market. Key drivers include the global push for decarbonization, stringent emission regulations, and the rising demand for clean energy solutions in transportation (automotive, aerospace, marine), industrial processes, and energy storage. The automotive sector, particularly in fuel cell electric vehicles (FCEVs), is expected to be a significant growth catalyst, alongside the burgeoning aerospace industry's exploration of hydrogen for propulsion and space exploration. Furthermore, advancements in cryogenic storage and transportation technologies, such as improved cryogenic tanks and high-pressure tube trailers, are streamlining the logistical challenges associated with handling liquid hydrogen, further stimulating market growth. However, the high cost of production and infrastructure development, coupled with safety concerns surrounding hydrogen handling, represent significant restraints. The market is segmented by distribution methods (cryogenic tanks, high-pressure tube trailers) and end-user industries. Geographically, North America and Asia-Pacific are likely to dominate the market due to robust government support for hydrogen initiatives and significant investments in renewable energy infrastructure. Competition amongst major players such as Linde PLC, Air Products and Chemicals Inc., and Air Liquide, fuels innovation and market expansion.

The forecast period of 2025-2033 anticipates a continuous upward trajectory for the liquid hydrogen market, fueled by ongoing technological advancements and supportive policies aimed at mitigating climate change. While challenges remain in terms of cost-effectiveness and safety, ongoing research and development efforts are addressing these issues. The diverse applications of liquid hydrogen across various sectors ensure continued demand, contributing to its anticipated rise as a crucial clean energy solution. The market's geographic distribution will likely reflect the pace of renewable energy adoption and the presence of supportive regulatory frameworks in different regions. Companies are actively investing in expanding production capacity, improving efficiency, and developing safer and more cost-effective hydrogen storage and transportation solutions. This competitive landscape and technological innovation should contribute to the market's substantial growth in the projected timeframe.

Liquid Hydrogen Industry: A Comprehensive Market Report (2019-2033)

This in-depth report provides a comprehensive analysis of the Liquid Hydrogen Industry, covering market size, growth drivers, key players, and future trends. The study period spans from 2019 to 2033, with 2025 as the base and estimated year. The forecast period is 2025-2033, and the historical period covers 2019-2024. The report is essential for industry stakeholders, investors, and anyone seeking to understand the dynamics of this rapidly evolving sector. Market values are expressed in Millions.

Liquid Hydrogen Industry Research Report - Market Size, Growth & Forecast

Liquid Hydrogen Industry Market Concentration & Innovation

The liquid hydrogen market exhibits a moderately concentrated structure, with several major players dominating the landscape. Linde PLC, Air Products and Chemicals Inc., Air Liquide, Messer Group GMBH, Iwatani Corporation, and Nippon Sanso Holdings Corporation control significant market share, estimated at xx% collectively in 2025. However, the emergence of smaller players like ITM Power and Universal Industrial Gases Inc., along with ongoing M&A activity, suggests a potential shift towards a more dynamic competitive environment. Innovation is driven by advancements in electrolysis technologies (PEM, Alkaline), cryogenic storage and transportation solutions, and the development of efficient liquefaction processes. Stringent environmental regulations globally, particularly concerning carbon emissions, are significant catalysts for innovation. Product substitutes, primarily natural gas and other fossil fuels, face increasing pressure due to sustainability concerns. End-user trends indicate a growing demand for green hydrogen across diverse sectors. M&A activity, while not exceedingly high in value terms (estimated at USD xx Million in 2024), plays a significant role in consolidating market share and accelerating technological development. Recent deals have focused on expanding production capacity, integrating the supply chain, and securing access to renewable energy sources.

  • Market Share (2025): Linde PLC (xx%), Air Products (xx%), Air Liquide (xx%), Others (xx%)
  • Estimated M&A Deal Value (2024): USD xx Million

Liquid Hydrogen Industry Industry Trends & Insights

The liquid hydrogen market is poised for robust growth, driven by the increasing global focus on decarbonization and the expanding adoption of hydrogen as a clean energy carrier. The compound annual growth rate (CAGR) is projected at xx% from 2025 to 2033, with market penetration increasing from xx% in 2025 to xx% by 2033, particularly within the automotive and aerospace sectors. Technological advancements in hydrogen production (e.g., improved electrolysis efficiency), storage (e.g., advanced cryogenic tanks), and transportation are key growth enablers. Consumer preferences are shifting towards cleaner energy solutions, fueling demand for liquid hydrogen-powered vehicles and industrial processes. Competitive dynamics are marked by intense rivalry among major players, focused on capacity expansion, strategic partnerships, and technological differentiation. Challenges such as hydrogen's high production and storage costs, along with infrastructural limitations, remain significant hurdles.

Liquid Hydrogen Industry Growth

Dominant Markets & Segments in Liquid Hydrogen Industry

The Asia-Pacific region is currently the dominant market for liquid hydrogen, driven by substantial investments from governments and rapid industrial growth in countries like Japan, South Korea, and China. Significant economic policies supporting hydrogen development, coupled with substantial infrastructure development, bolster this dominance. Within segments:

  • Distribution: Cryogenic tanks currently hold a larger market share than high-pressure tube trailers due to their established infrastructure and greater storage capacity. However, high-pressure tube trailers are expected to experience faster growth due to their better suitability for long-distance transportation.

  • End-User Industry: The automotive sector is projected to witness the most significant growth, driven by increasing adoption of fuel-cell electric vehicles (FCEVs). The aerospace sector, particularly for outer space applications, presents a significant, albeit smaller, market segment due to the high energy density of liquid hydrogen. The marine sector is emerging as a promising area, with initiatives like the Iwatani Corporation project aiming to reduce transportation costs.

  • Key Drivers in Asia-Pacific:

    • Government subsidies and incentives
    • Strong industrial demand
    • Investments in hydrogen infrastructure

Liquid Hydrogen Industry Product Developments

Recent innovations are significantly enhancing the efficiency and cost-effectiveness of the entire liquid hydrogen value chain, from production to transportation and storage. These advancements include breakthroughs in electrolysis technologies, resulting in higher yields and lower energy consumption; the development of more efficient and durable cryogenic tanks with increased storage capacity and reduced boil-off rates; and the design of lightweight, high-pressure tube trailers optimized for safe and cost-effective long-distance transport. These technological leaps are crucial for expanding liquid hydrogen's market reach and establishing it as a truly competitive and commercially viable alternative to fossil fuels. The overarching goal is to substantially reduce the overall cost of liquid hydrogen production while simultaneously increasing its energy density to streamline transportation and storage logistics. The industry's competitiveness hinges on sustained technological leadership, relentless cost optimization, and the establishment of robust and resilient supply chains. This includes addressing challenges related to materials sourcing, manufacturing processes, and logistics infrastructure.

Report Scope & Segmentation Analysis

This report provides a comprehensive segmentation of the liquid hydrogen market, analyzing it across key distribution methods – cryogenic tanks and high-pressure tube trailers – and major end-user industries, including automotive, aerospace (with a particular focus on space applications), marine, and others. Each segment undergoes detailed scrutiny, examining its current market size, projected growth trajectories, and the prevailing competitive landscape. While cryogenic tanks are anticipated to maintain a considerable market share, leveraging their existing infrastructure and suitability for large-volume handling, high-pressure tube trailers are projected to demonstrate faster growth due to their inherent advantages in transportation efficiency and flexibility. The automotive industry is predicted to be the fastest-growing end-user segment, reflecting the accelerating adoption of hydrogen fuel cell vehicles. Simultaneously, strong growth is also anticipated in the aerospace sector, especially in space exploration and propulsion systems, and within the marine industry for applications such as powering vessels and reducing emissions.

Key Drivers of Liquid Hydrogen Industry Growth

The burgeoning liquid hydrogen industry is propelled by a confluence of powerful factors. Stringent government regulations designed to curb greenhouse gas emissions are forcing industries to adopt cleaner, more sustainable energy alternatives. This regulatory pressure is complemented by remarkable technological advancements in hydrogen production, storage, and transportation, making liquid hydrogen a progressively more viable and attractive option. Significant investments from both the public and private sectors are further accelerating infrastructure development and commercialization efforts, fostering a supportive environment for market expansion. Finally, the steadily increasing demand from diverse end-user industries, particularly the automotive and aerospace sectors, is creating a strong market pull, driving the adoption of liquid hydrogen at an accelerated pace. This increasing demand is fueled by both environmental concerns and the desire for improved performance and efficiency in various applications.

Challenges in the Liquid Hydrogen Industry Sector

Significant challenges impede the widespread adoption of liquid hydrogen. The high cost of production and infrastructure development remains a major barrier. The energy-intensive nature of liquefaction processes and the need for specialized cryogenic infrastructure increase costs. Supply chain complexities, including hydrogen transportation and storage, pose logistical challenges. The competitive landscape, with established players and new entrants, introduces significant competitive pressures. Regulatory frameworks and safety standards also vary across regions, creating inconsistencies.

Emerging Opportunities in Liquid Hydrogen Industry

Emerging opportunities abound in the liquid hydrogen industry. The burgeoning green hydrogen sector, powered by renewable energy sources, presents substantial growth potential. The development of innovative storage solutions, such as solid-state hydrogen storage, offers prospects for improved efficiency and safety. Expansion into new end-user sectors, such as energy storage and power generation, holds significant promise. Finally, strategic partnerships and collaborations among industry players can accelerate innovation and commercialization.

Leading Players in the Liquid Hydrogen Industry Market

  • Linde PLC
  • Air Products and Chemicals Inc
  • Universal Industrial Gases Inc
  • Messer Group GMBH
  • Iwatani Corporation
  • Air Liquide
  • Nippon Sanso Holdings Corporation
  • Praxair Technology Inc.
  • ITM Power

Key Developments in Liquid Hydrogen Industry Industry

  • March 2023: Iwatani Corporation and ENEOS Corporation launched a "Liquefied Hydrogen Supply Chain Commercialization Demonstration Project," aiming to reduce hydrogen supply costs to 30 JPY/Nm3 by 2030 through marine transportation advancements. This signifies a crucial step towards cost-competitive hydrogen transport.

  • September 2022: Linde announced the construction of a 35-megawatt PEM electrolyzer in Niagara Falls, New York, significantly expanding its green liquid hydrogen production capacity in the US. This demonstrates significant investment in green hydrogen production capacity.

  • May 2022: Air Liquide invested USD 250 Million in a large liquid hydrogen production and logistics complex in Nevada, capable of producing 30 tons daily. This highlights the strategic investment in large-scale production capacity to meet growing demand in the hydrogen mobility sector.

Strategic Outlook for Liquid Hydrogen Industry Market

The liquid hydrogen market is poised for exceptional growth, driven by the global imperative to decarbonize economies and the continuous advancements in hydrogen technologies. Sustained investment in green hydrogen production methods, coupled with the parallel development of supporting infrastructure and ongoing cost reductions, will act as key catalysts for market expansion. The diversification of liquid hydrogen applications across transportation, industrial processes, and energy storage will further accelerate market growth. The strategic focus for industry leaders must be on building highly efficient and sustainable supply chains, improving storage technologies to minimize losses and maximize efficiency, and creating a supportive and well-defined regulatory environment to foster innovation and growth within the sector. Collaboration across industry stakeholders will be crucial to address technical challenges and ensure market readiness.

Liquid Hydrogen Industry Segmentation

  • 1. Distribution
    • 1.1. Cryogenic Tank
    • 1.2. High-Pressure Tube Trailers
  • 2. End-user Industry
    • 2.1. Automotive
    • 2.2. Aerospace (including Outer Space)
    • 2.3. Marine
    • 2.4. Other End-User Industries

Liquid Hydrogen Industry Segmentation By Geography

  • 1. Asia Pacific
    • 1.1. China
    • 1.2. India
    • 1.3. Japan
    • 1.4. South Korea
    • 1.5. Rest of Asia Pacific
  • 2. North America
    • 2.1. United States
    • 2.2. Canada
    • 2.3. Mexico
  • 3. Europe
    • 3.1. Germany
    • 3.2. United Kingdom
    • 3.3. Italy
    • 3.4. France
    • 3.5. Rest of Europe
  • 4. Rest of the World
    • 4.1. South America
    • 4.2. Middle East and Africa
Liquid Hydrogen Industry Regional Share


Liquid Hydrogen Industry REPORT HIGHLIGHTS

AspectsDetails
Study Period 2019-2033
Base Year 2024
Estimated Year 2025
Forecast Period2025-2033
Historical Period2019-2024
Growth RateCAGR of 10.27% from 2019-2033
Segmentation
    • By Distribution
      • Cryogenic Tank
      • High-Pressure Tube Trailers
    • By End-user Industry
      • Automotive
      • Aerospace (including Outer Space)
      • Marine
      • Other End-User Industries
  • By Geography
    • Asia Pacific
      • China
      • India
      • Japan
      • South Korea
      • Rest of Asia Pacific
    • North America
      • United States
      • Canada
      • Mexico
    • Europe
      • Germany
      • United Kingdom
      • Italy
      • France
      • Rest of Europe
    • Rest of the World
      • South America
      • Middle East and Africa


Table of Contents

  1. 1. Introduction
    • 1.1. Research Scope
    • 1.2. Market Segmentation
    • 1.3. Research Methodology
    • 1.4. Definitions and Assumptions
  2. 2. Executive Summary
    • 2.1. Introduction
  3. 3. Market Dynamics
    • 3.1. Introduction
      • 3.2. Market Drivers
        • 3.2.1. Growing Demand for Liquid Hydrogen for Space Exploration; Increasing Adoption of Hydrogen Fuel Cell in Commercial Vehicle
      • 3.3. Market Restrains
        • 3.3.1. High Cost Associated with Handling and Storage; Other Restraints
      • 3.4. Market Trends
        • 3.4.1. Aerospace Industry to Dominate the Market
  4. 4. Market Factor Analysis
    • 4.1. Porters Five Forces
    • 4.2. Supply/Value Chain
    • 4.3. PESTEL analysis
    • 4.4. Market Entropy
    • 4.5. Patent/Trademark Analysis
  5. 5. Global Liquid Hydrogen Industry Analysis, Insights and Forecast, 2019-2031
    • 5.1. Market Analysis, Insights and Forecast - by Distribution
      • 5.1.1. Cryogenic Tank
      • 5.1.2. High-Pressure Tube Trailers
    • 5.2. Market Analysis, Insights and Forecast - by End-user Industry
      • 5.2.1. Automotive
      • 5.2.2. Aerospace (including Outer Space)
      • 5.2.3. Marine
      • 5.2.4. Other End-User Industries
    • 5.3. Market Analysis, Insights and Forecast - by Region
      • 5.3.1. Asia Pacific
      • 5.3.2. North America
      • 5.3.3. Europe
      • 5.3.4. Rest of the World
  6. 6. Asia Pacific Liquid Hydrogen Industry Analysis, Insights and Forecast, 2019-2031
    • 6.1. Market Analysis, Insights and Forecast - by Distribution
      • 6.1.1. Cryogenic Tank
      • 6.1.2. High-Pressure Tube Trailers
    • 6.2. Market Analysis, Insights and Forecast - by End-user Industry
      • 6.2.1. Automotive
      • 6.2.2. Aerospace (including Outer Space)
      • 6.2.3. Marine
      • 6.2.4. Other End-User Industries
  7. 7. North America Liquid Hydrogen Industry Analysis, Insights and Forecast, 2019-2031
    • 7.1. Market Analysis, Insights and Forecast - by Distribution
      • 7.1.1. Cryogenic Tank
      • 7.1.2. High-Pressure Tube Trailers
    • 7.2. Market Analysis, Insights and Forecast - by End-user Industry
      • 7.2.1. Automotive
      • 7.2.2. Aerospace (including Outer Space)
      • 7.2.3. Marine
      • 7.2.4. Other End-User Industries
  8. 8. Europe Liquid Hydrogen Industry Analysis, Insights and Forecast, 2019-2031
    • 8.1. Market Analysis, Insights and Forecast - by Distribution
      • 8.1.1. Cryogenic Tank
      • 8.1.2. High-Pressure Tube Trailers
    • 8.2. Market Analysis, Insights and Forecast - by End-user Industry
      • 8.2.1. Automotive
      • 8.2.2. Aerospace (including Outer Space)
      • 8.2.3. Marine
      • 8.2.4. Other End-User Industries
  9. 9. Rest of the World Liquid Hydrogen Industry Analysis, Insights and Forecast, 2019-2031
    • 9.1. Market Analysis, Insights and Forecast - by Distribution
      • 9.1.1. Cryogenic Tank
      • 9.1.2. High-Pressure Tube Trailers
    • 9.2. Market Analysis, Insights and Forecast - by End-user Industry
      • 9.2.1. Automotive
      • 9.2.2. Aerospace (including Outer Space)
      • 9.2.3. Marine
      • 9.2.4. Other End-User Industries
  10. 10. North America Liquid Hydrogen Industry Analysis, Insights and Forecast, 2019-2031
      • 10.1. Market Analysis, Insights and Forecast - By Country/Sub-region
        • 10.1.1 United States
        • 10.1.2 Canada
        • 10.1.3 Mexico
  11. 11. Europe Liquid Hydrogen Industry Analysis, Insights and Forecast, 2019-2031
      • 11.1. Market Analysis, Insights and Forecast - By Country/Sub-region
        • 11.1.1 Germany
        • 11.1.2 United Kingdom
        • 11.1.3 France
        • 11.1.4 Spain
        • 11.1.5 Italy
        • 11.1.6 Spain
        • 11.1.7 Belgium
        • 11.1.8 Netherland
        • 11.1.9 Nordics
        • 11.1.10 Rest of Europe
  12. 12. Asia Pacific Liquid Hydrogen Industry Analysis, Insights and Forecast, 2019-2031
      • 12.1. Market Analysis, Insights and Forecast - By Country/Sub-region
        • 12.1.1 China
        • 12.1.2 Japan
        • 12.1.3 India
        • 12.1.4 South Korea
        • 12.1.5 Southeast Asia
        • 12.1.6 Australia
        • 12.1.7 Indonesia
        • 12.1.8 Phillipes
        • 12.1.9 Singapore
        • 12.1.10 Thailandc
        • 12.1.11 Rest of Asia Pacific
  13. 13. South America Liquid Hydrogen Industry Analysis, Insights and Forecast, 2019-2031
      • 13.1. Market Analysis, Insights and Forecast - By Country/Sub-region
        • 13.1.1 Brazil
        • 13.1.2 Argentina
        • 13.1.3 Peru
        • 13.1.4 Chile
        • 13.1.5 Colombia
        • 13.1.6 Ecuador
        • 13.1.7 Venezuela
        • 13.1.8 Rest of South America
  14. 14. North America Liquid Hydrogen Industry Analysis, Insights and Forecast, 2019-2031
      • 14.1. Market Analysis, Insights and Forecast - By Country/Sub-region
        • 14.1.1 United States
        • 14.1.2 Canada
        • 14.1.3 Mexico
  15. 15. MEA Liquid Hydrogen Industry Analysis, Insights and Forecast, 2019-2031
      • 15.1. Market Analysis, Insights and Forecast - By Country/Sub-region
        • 15.1.1 United Arab Emirates
        • 15.1.2 Saudi Arabia
        • 15.1.3 South Africa
        • 15.1.4 Rest of Middle East and Africa
  16. 16. Competitive Analysis
    • 16.1. Global Market Share Analysis 2024
      • 16.2. Company Profiles
        • 16.2.1 Linde PLC
          • 16.2.1.1. Overview
          • 16.2.1.2. Products
          • 16.2.1.3. SWOT Analysis
          • 16.2.1.4. Recent Developments
          • 16.2.1.5. Financials (Based on Availability)
        • 16.2.2 Air Products and Chemicals Inc
          • 16.2.2.1. Overview
          • 16.2.2.2. Products
          • 16.2.2.3. SWOT Analysis
          • 16.2.2.4. Recent Developments
          • 16.2.2.5. Financials (Based on Availability)
        • 16.2.3 Universal Industrial Gases Inc *List Not Exhaustive
          • 16.2.3.1. Overview
          • 16.2.3.2. Products
          • 16.2.3.3. SWOT Analysis
          • 16.2.3.4. Recent Developments
          • 16.2.3.5. Financials (Based on Availability)
        • 16.2.4 Messer Group GMBH
          • 16.2.4.1. Overview
          • 16.2.4.2. Products
          • 16.2.4.3. SWOT Analysis
          • 16.2.4.4. Recent Developments
          • 16.2.4.5. Financials (Based on Availability)
        • 16.2.5 Iwatani Corporation
          • 16.2.5.1. Overview
          • 16.2.5.2. Products
          • 16.2.5.3. SWOT Analysis
          • 16.2.5.4. Recent Developments
          • 16.2.5.5. Financials (Based on Availability)
        • 16.2.6 Air Liquide
          • 16.2.6.1. Overview
          • 16.2.6.2. Products
          • 16.2.6.3. SWOT Analysis
          • 16.2.6.4. Recent Developments
          • 16.2.6.5. Financials (Based on Availability)
        • 16.2.7 Nippon Sanso Holdings Corporation
          • 16.2.7.1. Overview
          • 16.2.7.2. Products
          • 16.2.7.3. SWOT Analysis
          • 16.2.7.4. Recent Developments
          • 16.2.7.5. Financials (Based on Availability)
        • 16.2.8 Nippon Sanso Holdings Corporation
          • 16.2.8.1. Overview
          • 16.2.8.2. Products
          • 16.2.8.3. SWOT Analysis
          • 16.2.8.4. Recent Developments
          • 16.2.8.5. Financials (Based on Availability)
        • 16.2.9 Praxair Technology Inc.
          • 16.2.9.1. Overview
          • 16.2.9.2. Products
          • 16.2.9.3. SWOT Analysis
          • 16.2.9.4. Recent Developments
          • 16.2.9.5. Financials (Based on Availability)
        • 16.2.10 ITM Power
          • 16.2.10.1. Overview
          • 16.2.10.2. Products
          • 16.2.10.3. SWOT Analysis
          • 16.2.10.4. Recent Developments
          • 16.2.10.5. Financials (Based on Availability)

List of Figures

  1. Figure 1: Global Liquid Hydrogen Industry Revenue Breakdown (Million, %) by Region 2024 & 2032
  2. Figure 2: Global Liquid Hydrogen Industry Volume Breakdown (kilotons, %) by Region 2024 & 2032
  3. Figure 3: North America Liquid Hydrogen Industry Revenue (Million), by Country 2024 & 2032
  4. Figure 4: North America Liquid Hydrogen Industry Volume (kilotons), by Country 2024 & 2032
  5. Figure 5: North America Liquid Hydrogen Industry Revenue Share (%), by Country 2024 & 2032
  6. Figure 6: North America Liquid Hydrogen Industry Volume Share (%), by Country 2024 & 2032
  7. Figure 7: Europe Liquid Hydrogen Industry Revenue (Million), by Country 2024 & 2032
  8. Figure 8: Europe Liquid Hydrogen Industry Volume (kilotons), by Country 2024 & 2032
  9. Figure 9: Europe Liquid Hydrogen Industry Revenue Share (%), by Country 2024 & 2032
  10. Figure 10: Europe Liquid Hydrogen Industry Volume Share (%), by Country 2024 & 2032
  11. Figure 11: Asia Pacific Liquid Hydrogen Industry Revenue (Million), by Country 2024 & 2032
  12. Figure 12: Asia Pacific Liquid Hydrogen Industry Volume (kilotons), by Country 2024 & 2032
  13. Figure 13: Asia Pacific Liquid Hydrogen Industry Revenue Share (%), by Country 2024 & 2032
  14. Figure 14: Asia Pacific Liquid Hydrogen Industry Volume Share (%), by Country 2024 & 2032
  15. Figure 15: South America Liquid Hydrogen Industry Revenue (Million), by Country 2024 & 2032
  16. Figure 16: South America Liquid Hydrogen Industry Volume (kilotons), by Country 2024 & 2032
  17. Figure 17: South America Liquid Hydrogen Industry Revenue Share (%), by Country 2024 & 2032
  18. Figure 18: South America Liquid Hydrogen Industry Volume Share (%), by Country 2024 & 2032
  19. Figure 19: North America Liquid Hydrogen Industry Revenue (Million), by Country 2024 & 2032
  20. Figure 20: North America Liquid Hydrogen Industry Volume (kilotons), by Country 2024 & 2032
  21. Figure 21: North America Liquid Hydrogen Industry Revenue Share (%), by Country 2024 & 2032
  22. Figure 22: North America Liquid Hydrogen Industry Volume Share (%), by Country 2024 & 2032
  23. Figure 23: MEA Liquid Hydrogen Industry Revenue (Million), by Country 2024 & 2032
  24. Figure 24: MEA Liquid Hydrogen Industry Volume (kilotons), by Country 2024 & 2032
  25. Figure 25: MEA Liquid Hydrogen Industry Revenue Share (%), by Country 2024 & 2032
  26. Figure 26: MEA Liquid Hydrogen Industry Volume Share (%), by Country 2024 & 2032
  27. Figure 27: Asia Pacific Liquid Hydrogen Industry Revenue (Million), by Distribution 2024 & 2032
  28. Figure 28: Asia Pacific Liquid Hydrogen Industry Volume (kilotons), by Distribution 2024 & 2032
  29. Figure 29: Asia Pacific Liquid Hydrogen Industry Revenue Share (%), by Distribution 2024 & 2032
  30. Figure 30: Asia Pacific Liquid Hydrogen Industry Volume Share (%), by Distribution 2024 & 2032
  31. Figure 31: Asia Pacific Liquid Hydrogen Industry Revenue (Million), by End-user Industry 2024 & 2032
  32. Figure 32: Asia Pacific Liquid Hydrogen Industry Volume (kilotons), by End-user Industry 2024 & 2032
  33. Figure 33: Asia Pacific Liquid Hydrogen Industry Revenue Share (%), by End-user Industry 2024 & 2032
  34. Figure 34: Asia Pacific Liquid Hydrogen Industry Volume Share (%), by End-user Industry 2024 & 2032
  35. Figure 35: Asia Pacific Liquid Hydrogen Industry Revenue (Million), by Country 2024 & 2032
  36. Figure 36: Asia Pacific Liquid Hydrogen Industry Volume (kilotons), by Country 2024 & 2032
  37. Figure 37: Asia Pacific Liquid Hydrogen Industry Revenue Share (%), by Country 2024 & 2032
  38. Figure 38: Asia Pacific Liquid Hydrogen Industry Volume Share (%), by Country 2024 & 2032
  39. Figure 39: North America Liquid Hydrogen Industry Revenue (Million), by Distribution 2024 & 2032
  40. Figure 40: North America Liquid Hydrogen Industry Volume (kilotons), by Distribution 2024 & 2032
  41. Figure 41: North America Liquid Hydrogen Industry Revenue Share (%), by Distribution 2024 & 2032
  42. Figure 42: North America Liquid Hydrogen Industry Volume Share (%), by Distribution 2024 & 2032
  43. Figure 43: North America Liquid Hydrogen Industry Revenue (Million), by End-user Industry 2024 & 2032
  44. Figure 44: North America Liquid Hydrogen Industry Volume (kilotons), by End-user Industry 2024 & 2032
  45. Figure 45: North America Liquid Hydrogen Industry Revenue Share (%), by End-user Industry 2024 & 2032
  46. Figure 46: North America Liquid Hydrogen Industry Volume Share (%), by End-user Industry 2024 & 2032
  47. Figure 47: North America Liquid Hydrogen Industry Revenue (Million), by Country 2024 & 2032
  48. Figure 48: North America Liquid Hydrogen Industry Volume (kilotons), by Country 2024 & 2032
  49. Figure 49: North America Liquid Hydrogen Industry Revenue Share (%), by Country 2024 & 2032
  50. Figure 50: North America Liquid Hydrogen Industry Volume Share (%), by Country 2024 & 2032
  51. Figure 51: Europe Liquid Hydrogen Industry Revenue (Million), by Distribution 2024 & 2032
  52. Figure 52: Europe Liquid Hydrogen Industry Volume (kilotons), by Distribution 2024 & 2032
  53. Figure 53: Europe Liquid Hydrogen Industry Revenue Share (%), by Distribution 2024 & 2032
  54. Figure 54: Europe Liquid Hydrogen Industry Volume Share (%), by Distribution 2024 & 2032
  55. Figure 55: Europe Liquid Hydrogen Industry Revenue (Million), by End-user Industry 2024 & 2032
  56. Figure 56: Europe Liquid Hydrogen Industry Volume (kilotons), by End-user Industry 2024 & 2032
  57. Figure 57: Europe Liquid Hydrogen Industry Revenue Share (%), by End-user Industry 2024 & 2032
  58. Figure 58: Europe Liquid Hydrogen Industry Volume Share (%), by End-user Industry 2024 & 2032
  59. Figure 59: Europe Liquid Hydrogen Industry Revenue (Million), by Country 2024 & 2032
  60. Figure 60: Europe Liquid Hydrogen Industry Volume (kilotons), by Country 2024 & 2032
  61. Figure 61: Europe Liquid Hydrogen Industry Revenue Share (%), by Country 2024 & 2032
  62. Figure 62: Europe Liquid Hydrogen Industry Volume Share (%), by Country 2024 & 2032
  63. Figure 63: Rest of the World Liquid Hydrogen Industry Revenue (Million), by Distribution 2024 & 2032
  64. Figure 64: Rest of the World Liquid Hydrogen Industry Volume (kilotons), by Distribution 2024 & 2032
  65. Figure 65: Rest of the World Liquid Hydrogen Industry Revenue Share (%), by Distribution 2024 & 2032
  66. Figure 66: Rest of the World Liquid Hydrogen Industry Volume Share (%), by Distribution 2024 & 2032
  67. Figure 67: Rest of the World Liquid Hydrogen Industry Revenue (Million), by End-user Industry 2024 & 2032
  68. Figure 68: Rest of the World Liquid Hydrogen Industry Volume (kilotons), by End-user Industry 2024 & 2032
  69. Figure 69: Rest of the World Liquid Hydrogen Industry Revenue Share (%), by End-user Industry 2024 & 2032
  70. Figure 70: Rest of the World Liquid Hydrogen Industry Volume Share (%), by End-user Industry 2024 & 2032
  71. Figure 71: Rest of the World Liquid Hydrogen Industry Revenue (Million), by Country 2024 & 2032
  72. Figure 72: Rest of the World Liquid Hydrogen Industry Volume (kilotons), by Country 2024 & 2032
  73. Figure 73: Rest of the World Liquid Hydrogen Industry Revenue Share (%), by Country 2024 & 2032
  74. Figure 74: Rest of the World Liquid Hydrogen Industry Volume Share (%), by Country 2024 & 2032

List of Tables

  1. Table 1: Global Liquid Hydrogen Industry Revenue Million Forecast, by Region 2019 & 2032
  2. Table 2: Global Liquid Hydrogen Industry Volume kilotons Forecast, by Region 2019 & 2032
  3. Table 3: Global Liquid Hydrogen Industry Revenue Million Forecast, by Distribution 2019 & 2032
  4. Table 4: Global Liquid Hydrogen Industry Volume kilotons Forecast, by Distribution 2019 & 2032
  5. Table 5: Global Liquid Hydrogen Industry Revenue Million Forecast, by End-user Industry 2019 & 2032
  6. Table 6: Global Liquid Hydrogen Industry Volume kilotons Forecast, by End-user Industry 2019 & 2032
  7. Table 7: Global Liquid Hydrogen Industry Revenue Million Forecast, by Region 2019 & 2032
  8. Table 8: Global Liquid Hydrogen Industry Volume kilotons Forecast, by Region 2019 & 2032
  9. Table 9: Global Liquid Hydrogen Industry Revenue Million Forecast, by Country 2019 & 2032
  10. Table 10: Global Liquid Hydrogen Industry Volume kilotons Forecast, by Country 2019 & 2032
  11. Table 11: United States Liquid Hydrogen Industry Revenue (Million) Forecast, by Application 2019 & 2032
  12. Table 12: United States Liquid Hydrogen Industry Volume (kilotons) Forecast, by Application 2019 & 2032
  13. Table 13: Canada Liquid Hydrogen Industry Revenue (Million) Forecast, by Application 2019 & 2032
  14. Table 14: Canada Liquid Hydrogen Industry Volume (kilotons) Forecast, by Application 2019 & 2032
  15. Table 15: Mexico Liquid Hydrogen Industry Revenue (Million) Forecast, by Application 2019 & 2032
  16. Table 16: Mexico Liquid Hydrogen Industry Volume (kilotons) Forecast, by Application 2019 & 2032
  17. Table 17: Global Liquid Hydrogen Industry Revenue Million Forecast, by Country 2019 & 2032
  18. Table 18: Global Liquid Hydrogen Industry Volume kilotons Forecast, by Country 2019 & 2032
  19. Table 19: Germany Liquid Hydrogen Industry Revenue (Million) Forecast, by Application 2019 & 2032
  20. Table 20: Germany Liquid Hydrogen Industry Volume (kilotons) Forecast, by Application 2019 & 2032
  21. Table 21: United Kingdom Liquid Hydrogen Industry Revenue (Million) Forecast, by Application 2019 & 2032
  22. Table 22: United Kingdom Liquid Hydrogen Industry Volume (kilotons) Forecast, by Application 2019 & 2032
  23. Table 23: France Liquid Hydrogen Industry Revenue (Million) Forecast, by Application 2019 & 2032
  24. Table 24: France Liquid Hydrogen Industry Volume (kilotons) Forecast, by Application 2019 & 2032
  25. Table 25: Spain Liquid Hydrogen Industry Revenue (Million) Forecast, by Application 2019 & 2032
  26. Table 26: Spain Liquid Hydrogen Industry Volume (kilotons) Forecast, by Application 2019 & 2032
  27. Table 27: Italy Liquid Hydrogen Industry Revenue (Million) Forecast, by Application 2019 & 2032
  28. Table 28: Italy Liquid Hydrogen Industry Volume (kilotons) Forecast, by Application 2019 & 2032
  29. Table 29: Spain Liquid Hydrogen Industry Revenue (Million) Forecast, by Application 2019 & 2032
  30. Table 30: Spain Liquid Hydrogen Industry Volume (kilotons) Forecast, by Application 2019 & 2032
  31. Table 31: Belgium Liquid Hydrogen Industry Revenue (Million) Forecast, by Application 2019 & 2032
  32. Table 32: Belgium Liquid Hydrogen Industry Volume (kilotons) Forecast, by Application 2019 & 2032
  33. Table 33: Netherland Liquid Hydrogen Industry Revenue (Million) Forecast, by Application 2019 & 2032
  34. Table 34: Netherland Liquid Hydrogen Industry Volume (kilotons) Forecast, by Application 2019 & 2032
  35. Table 35: Nordics Liquid Hydrogen Industry Revenue (Million) Forecast, by Application 2019 & 2032
  36. Table 36: Nordics Liquid Hydrogen Industry Volume (kilotons) Forecast, by Application 2019 & 2032
  37. Table 37: Rest of Europe Liquid Hydrogen Industry Revenue (Million) Forecast, by Application 2019 & 2032
  38. Table 38: Rest of Europe Liquid Hydrogen Industry Volume (kilotons) Forecast, by Application 2019 & 2032
  39. Table 39: Global Liquid Hydrogen Industry Revenue Million Forecast, by Country 2019 & 2032
  40. Table 40: Global Liquid Hydrogen Industry Volume kilotons Forecast, by Country 2019 & 2032
  41. Table 41: China Liquid Hydrogen Industry Revenue (Million) Forecast, by Application 2019 & 2032
  42. Table 42: China Liquid Hydrogen Industry Volume (kilotons) Forecast, by Application 2019 & 2032
  43. Table 43: Japan Liquid Hydrogen Industry Revenue (Million) Forecast, by Application 2019 & 2032
  44. Table 44: Japan Liquid Hydrogen Industry Volume (kilotons) Forecast, by Application 2019 & 2032
  45. Table 45: India Liquid Hydrogen Industry Revenue (Million) Forecast, by Application 2019 & 2032
  46. Table 46: India Liquid Hydrogen Industry Volume (kilotons) Forecast, by Application 2019 & 2032
  47. Table 47: South Korea Liquid Hydrogen Industry Revenue (Million) Forecast, by Application 2019 & 2032
  48. Table 48: South Korea Liquid Hydrogen Industry Volume (kilotons) Forecast, by Application 2019 & 2032
  49. Table 49: Southeast Asia Liquid Hydrogen Industry Revenue (Million) Forecast, by Application 2019 & 2032
  50. Table 50: Southeast Asia Liquid Hydrogen Industry Volume (kilotons) Forecast, by Application 2019 & 2032
  51. Table 51: Australia Liquid Hydrogen Industry Revenue (Million) Forecast, by Application 2019 & 2032
  52. Table 52: Australia Liquid Hydrogen Industry Volume (kilotons) Forecast, by Application 2019 & 2032
  53. Table 53: Indonesia Liquid Hydrogen Industry Revenue (Million) Forecast, by Application 2019 & 2032
  54. Table 54: Indonesia Liquid Hydrogen Industry Volume (kilotons) Forecast, by Application 2019 & 2032
  55. Table 55: Phillipes Liquid Hydrogen Industry Revenue (Million) Forecast, by Application 2019 & 2032
  56. Table 56: Phillipes Liquid Hydrogen Industry Volume (kilotons) Forecast, by Application 2019 & 2032
  57. Table 57: Singapore Liquid Hydrogen Industry Revenue (Million) Forecast, by Application 2019 & 2032
  58. Table 58: Singapore Liquid Hydrogen Industry Volume (kilotons) Forecast, by Application 2019 & 2032
  59. Table 59: Thailandc Liquid Hydrogen Industry Revenue (Million) Forecast, by Application 2019 & 2032
  60. Table 60: Thailandc Liquid Hydrogen Industry Volume (kilotons) Forecast, by Application 2019 & 2032
  61. Table 61: Rest of Asia Pacific Liquid Hydrogen Industry Revenue (Million) Forecast, by Application 2019 & 2032
  62. Table 62: Rest of Asia Pacific Liquid Hydrogen Industry Volume (kilotons) Forecast, by Application 2019 & 2032
  63. Table 63: Global Liquid Hydrogen Industry Revenue Million Forecast, by Country 2019 & 2032
  64. Table 64: Global Liquid Hydrogen Industry Volume kilotons Forecast, by Country 2019 & 2032
  65. Table 65: Brazil Liquid Hydrogen Industry Revenue (Million) Forecast, by Application 2019 & 2032
  66. Table 66: Brazil Liquid Hydrogen Industry Volume (kilotons) Forecast, by Application 2019 & 2032
  67. Table 67: Argentina Liquid Hydrogen Industry Revenue (Million) Forecast, by Application 2019 & 2032
  68. Table 68: Argentina Liquid Hydrogen Industry Volume (kilotons) Forecast, by Application 2019 & 2032
  69. Table 69: Peru Liquid Hydrogen Industry Revenue (Million) Forecast, by Application 2019 & 2032
  70. Table 70: Peru Liquid Hydrogen Industry Volume (kilotons) Forecast, by Application 2019 & 2032
  71. Table 71: Chile Liquid Hydrogen Industry Revenue (Million) Forecast, by Application 2019 & 2032
  72. Table 72: Chile Liquid Hydrogen Industry Volume (kilotons) Forecast, by Application 2019 & 2032
  73. Table 73: Colombia Liquid Hydrogen Industry Revenue (Million) Forecast, by Application 2019 & 2032
  74. Table 74: Colombia Liquid Hydrogen Industry Volume (kilotons) Forecast, by Application 2019 & 2032
  75. Table 75: Ecuador Liquid Hydrogen Industry Revenue (Million) Forecast, by Application 2019 & 2032
  76. Table 76: Ecuador Liquid Hydrogen Industry Volume (kilotons) Forecast, by Application 2019 & 2032
  77. Table 77: Venezuela Liquid Hydrogen Industry Revenue (Million) Forecast, by Application 2019 & 2032
  78. Table 78: Venezuela Liquid Hydrogen Industry Volume (kilotons) Forecast, by Application 2019 & 2032
  79. Table 79: Rest of South America Liquid Hydrogen Industry Revenue (Million) Forecast, by Application 2019 & 2032
  80. Table 80: Rest of South America Liquid Hydrogen Industry Volume (kilotons) Forecast, by Application 2019 & 2032
  81. Table 81: Global Liquid Hydrogen Industry Revenue Million Forecast, by Country 2019 & 2032
  82. Table 82: Global Liquid Hydrogen Industry Volume kilotons Forecast, by Country 2019 & 2032
  83. Table 83: United States Liquid Hydrogen Industry Revenue (Million) Forecast, by Application 2019 & 2032
  84. Table 84: United States Liquid Hydrogen Industry Volume (kilotons) Forecast, by Application 2019 & 2032
  85. Table 85: Canada Liquid Hydrogen Industry Revenue (Million) Forecast, by Application 2019 & 2032
  86. Table 86: Canada Liquid Hydrogen Industry Volume (kilotons) Forecast, by Application 2019 & 2032
  87. Table 87: Mexico Liquid Hydrogen Industry Revenue (Million) Forecast, by Application 2019 & 2032
  88. Table 88: Mexico Liquid Hydrogen Industry Volume (kilotons) Forecast, by Application 2019 & 2032
  89. Table 89: Global Liquid Hydrogen Industry Revenue Million Forecast, by Country 2019 & 2032
  90. Table 90: Global Liquid Hydrogen Industry Volume kilotons Forecast, by Country 2019 & 2032
  91. Table 91: United Arab Emirates Liquid Hydrogen Industry Revenue (Million) Forecast, by Application 2019 & 2032
  92. Table 92: United Arab Emirates Liquid Hydrogen Industry Volume (kilotons) Forecast, by Application 2019 & 2032
  93. Table 93: Saudi Arabia Liquid Hydrogen Industry Revenue (Million) Forecast, by Application 2019 & 2032
  94. Table 94: Saudi Arabia Liquid Hydrogen Industry Volume (kilotons) Forecast, by Application 2019 & 2032
  95. Table 95: South Africa Liquid Hydrogen Industry Revenue (Million) Forecast, by Application 2019 & 2032
  96. Table 96: South Africa Liquid Hydrogen Industry Volume (kilotons) Forecast, by Application 2019 & 2032
  97. Table 97: Rest of Middle East and Africa Liquid Hydrogen Industry Revenue (Million) Forecast, by Application 2019 & 2032
  98. Table 98: Rest of Middle East and Africa Liquid Hydrogen Industry Volume (kilotons) Forecast, by Application 2019 & 2032
  99. Table 99: Global Liquid Hydrogen Industry Revenue Million Forecast, by Distribution 2019 & 2032
  100. Table 100: Global Liquid Hydrogen Industry Volume kilotons Forecast, by Distribution 2019 & 2032
  101. Table 101: Global Liquid Hydrogen Industry Revenue Million Forecast, by End-user Industry 2019 & 2032
  102. Table 102: Global Liquid Hydrogen Industry Volume kilotons Forecast, by End-user Industry 2019 & 2032
  103. Table 103: Global Liquid Hydrogen Industry Revenue Million Forecast, by Country 2019 & 2032
  104. Table 104: Global Liquid Hydrogen Industry Volume kilotons Forecast, by Country 2019 & 2032
  105. Table 105: China Liquid Hydrogen Industry Revenue (Million) Forecast, by Application 2019 & 2032
  106. Table 106: China Liquid Hydrogen Industry Volume (kilotons) Forecast, by Application 2019 & 2032
  107. Table 107: India Liquid Hydrogen Industry Revenue (Million) Forecast, by Application 2019 & 2032
  108. Table 108: India Liquid Hydrogen Industry Volume (kilotons) Forecast, by Application 2019 & 2032
  109. Table 109: Japan Liquid Hydrogen Industry Revenue (Million) Forecast, by Application 2019 & 2032
  110. Table 110: Japan Liquid Hydrogen Industry Volume (kilotons) Forecast, by Application 2019 & 2032
  111. Table 111: South Korea Liquid Hydrogen Industry Revenue (Million) Forecast, by Application 2019 & 2032
  112. Table 112: South Korea Liquid Hydrogen Industry Volume (kilotons) Forecast, by Application 2019 & 2032
  113. Table 113: Rest of Asia Pacific Liquid Hydrogen Industry Revenue (Million) Forecast, by Application 2019 & 2032
  114. Table 114: Rest of Asia Pacific Liquid Hydrogen Industry Volume (kilotons) Forecast, by Application 2019 & 2032
  115. Table 115: Global Liquid Hydrogen Industry Revenue Million Forecast, by Distribution 2019 & 2032
  116. Table 116: Global Liquid Hydrogen Industry Volume kilotons Forecast, by Distribution 2019 & 2032
  117. Table 117: Global Liquid Hydrogen Industry Revenue Million Forecast, by End-user Industry 2019 & 2032
  118. Table 118: Global Liquid Hydrogen Industry Volume kilotons Forecast, by End-user Industry 2019 & 2032
  119. Table 119: Global Liquid Hydrogen Industry Revenue Million Forecast, by Country 2019 & 2032
  120. Table 120: Global Liquid Hydrogen Industry Volume kilotons Forecast, by Country 2019 & 2032
  121. Table 121: United States Liquid Hydrogen Industry Revenue (Million) Forecast, by Application 2019 & 2032
  122. Table 122: United States Liquid Hydrogen Industry Volume (kilotons) Forecast, by Application 2019 & 2032
  123. Table 123: Canada Liquid Hydrogen Industry Revenue (Million) Forecast, by Application 2019 & 2032
  124. Table 124: Canada Liquid Hydrogen Industry Volume (kilotons) Forecast, by Application 2019 & 2032
  125. Table 125: Mexico Liquid Hydrogen Industry Revenue (Million) Forecast, by Application 2019 & 2032
  126. Table 126: Mexico Liquid Hydrogen Industry Volume (kilotons) Forecast, by Application 2019 & 2032
  127. Table 127: Global Liquid Hydrogen Industry Revenue Million Forecast, by Distribution 2019 & 2032
  128. Table 128: Global Liquid Hydrogen Industry Volume kilotons Forecast, by Distribution 2019 & 2032
  129. Table 129: Global Liquid Hydrogen Industry Revenue Million Forecast, by End-user Industry 2019 & 2032
  130. Table 130: Global Liquid Hydrogen Industry Volume kilotons Forecast, by End-user Industry 2019 & 2032
  131. Table 131: Global Liquid Hydrogen Industry Revenue Million Forecast, by Country 2019 & 2032
  132. Table 132: Global Liquid Hydrogen Industry Volume kilotons Forecast, by Country 2019 & 2032
  133. Table 133: Germany Liquid Hydrogen Industry Revenue (Million) Forecast, by Application 2019 & 2032
  134. Table 134: Germany Liquid Hydrogen Industry Volume (kilotons) Forecast, by Application 2019 & 2032
  135. Table 135: United Kingdom Liquid Hydrogen Industry Revenue (Million) Forecast, by Application 2019 & 2032
  136. Table 136: United Kingdom Liquid Hydrogen Industry Volume (kilotons) Forecast, by Application 2019 & 2032
  137. Table 137: Italy Liquid Hydrogen Industry Revenue (Million) Forecast, by Application 2019 & 2032
  138. Table 138: Italy Liquid Hydrogen Industry Volume (kilotons) Forecast, by Application 2019 & 2032
  139. Table 139: France Liquid Hydrogen Industry Revenue (Million) Forecast, by Application 2019 & 2032
  140. Table 140: France Liquid Hydrogen Industry Volume (kilotons) Forecast, by Application 2019 & 2032
  141. Table 141: Rest of Europe Liquid Hydrogen Industry Revenue (Million) Forecast, by Application 2019 & 2032
  142. Table 142: Rest of Europe Liquid Hydrogen Industry Volume (kilotons) Forecast, by Application 2019 & 2032
  143. Table 143: Global Liquid Hydrogen Industry Revenue Million Forecast, by Distribution 2019 & 2032
  144. Table 144: Global Liquid Hydrogen Industry Volume kilotons Forecast, by Distribution 2019 & 2032
  145. Table 145: Global Liquid Hydrogen Industry Revenue Million Forecast, by End-user Industry 2019 & 2032
  146. Table 146: Global Liquid Hydrogen Industry Volume kilotons Forecast, by End-user Industry 2019 & 2032
  147. Table 147: Global Liquid Hydrogen Industry Revenue Million Forecast, by Country 2019 & 2032
  148. Table 148: Global Liquid Hydrogen Industry Volume kilotons Forecast, by Country 2019 & 2032
  149. Table 149: South America Liquid Hydrogen Industry Revenue (Million) Forecast, by Application 2019 & 2032
  150. Table 150: South America Liquid Hydrogen Industry Volume (kilotons) Forecast, by Application 2019 & 2032
  151. Table 151: Middle East and Africa Liquid Hydrogen Industry Revenue (Million) Forecast, by Application 2019 & 2032
  152. Table 152: Middle East and Africa Liquid Hydrogen Industry Volume (kilotons) Forecast, by Application 2019 & 2032


Frequently Asked Questions

1. What is the projected Compound Annual Growth Rate (CAGR) of the Liquid Hydrogen Industry?

The projected CAGR is approximately 10.27%.

2. Which companies are prominent players in the Liquid Hydrogen Industry?

Key companies in the market include Linde PLC, Air Products and Chemicals Inc, Universal Industrial Gases Inc *List Not Exhaustive, Messer Group GMBH, Iwatani Corporation, Air Liquide, Nippon Sanso Holdings Corporation, Nippon Sanso Holdings Corporation , Praxair Technology Inc. , ITM Power.

3. What are the main segments of the Liquid Hydrogen Industry?

The market segments include Distribution, End-user Industry.

4. Can you provide details about the market size?

The market size is estimated to be USD 38400 Million as of 2022.

5. What are some drivers contributing to market growth?

Growing Demand for Liquid Hydrogen for Space Exploration; Increasing Adoption of Hydrogen Fuel Cell in Commercial Vehicle.

6. What are the notable trends driving market growth?

Aerospace Industry to Dominate the Market.

7. Are there any restraints impacting market growth?

High Cost Associated with Handling and Storage; Other Restraints.

8. Can you provide examples of recent developments in the market?

Mar 2023: Iwatani Corporation and ENEOS Corporation were working to deliver a "Liquefied Hydrogen Supply Chain Commercialization Demonstration Project. The project aims to develop marine transportation technologies of liquefied clean hydrogen, which will help to achieve a hydrogen supply cost of 30 JPY/Nm3 by 2030.

9. What pricing options are available for accessing the report?

Pricing options include single-user, multi-user, and enterprise licenses priced at USD 4750, USD 5250, and USD 8750 respectively.

10. Is the market size provided in terms of value or volume?

The market size is provided in terms of value, measured in Million and volume, measured in kilotons.

11. Are there any specific market keywords associated with the report?

Yes, the market keyword associated with the report is "Liquid Hydrogen Industry," which aids in identifying and referencing the specific market segment covered.

12. How do I determine which pricing option suits my needs best?

The pricing options vary based on user requirements and access needs. Individual users may opt for single-user licenses, while businesses requiring broader access may choose multi-user or enterprise licenses for cost-effective access to the report.

13. Are there any additional resources or data provided in the Liquid Hydrogen Industry report?

While the report offers comprehensive insights, it's advisable to review the specific contents or supplementary materials provided to ascertain if additional resources or data are available.

14. How can I stay updated on further developments or reports in the Liquid Hydrogen Industry?

To stay informed about further developments, trends, and reports in the Liquid Hydrogen Industry, consider subscribing to industry newsletters, following relevant companies and organizations, or regularly checking reputable industry news sources and publications.


Methodology

Step 1 - Identification of Relevant Samples Size from Population Database

Step Chart
Bar Chart
Method Chart

Step 2 - Approaches for Defining Global Market Size (Value, Volume* & Price*)

Approach Chart
Top-down and bottom-up approaches are used to validate the global market size and estimate the market size for manufactures, regional segments, product, and application.

Note*: In applicable scenarios

Step 3 - Data Sources

Primary Research

  • Web Analytics
  • Survey Reports
  • Research Institute
  • Latest Research Reports
  • Opinion Leaders

Secondary Research

  • Annual Reports
  • White Paper
  • Latest Press Release
  • Industry Association
  • Paid Database
  • Investor Presentations
Analyst Chart

Step 4 - Data Triangulation

Involves using different sources of information in order to increase the validity of a study

These sources are likely to be stakeholders in a program - participants, other researchers, program staff, other community members, and so on.

Then we put all data in single framework & apply various statistical tools to find out the dynamic on the market.

During the analysis stage, feedback from the stakeholder groups would be compared to determine areas of agreement as well as areas of divergence

Additionally, after gathering mixed and scattered data from a wide range of sources, data is triangulated and correlated to come up with estimated figures which are further validated through primary mediums or industry experts, opinion leaders.

About Research Axiom

Research Axiom delivers in-depth market research, industry analysis, and consulting for pharmaceuticals, automotive, IT, and consumer goods. Our reports provide the clarity you need to make informed decisions and drive innovation.

Our team combines primary research, advanced analytics, and sector expertise to deliver actionable intelligence. We offer syndicated reports, custom research, and consulting services tailored to your business needs.

At Research Axiom, we are committed to quality, transparency, and client satisfaction. Every report is rigorously validated to ensure accuracy and relevance. Our global perspective and local expertise help you understand both the big picture and the finer details of your market.

Stay informed with Research Axiom. Subscribe to our newsletter for the latest updates and research highlights, and follow us on social media for real-time insights. Research Axiom – Turning Data into Business Advantage.

artwork spiralartwork spiralRelated Reports
artwork underline

Analyzing Consumer Behavior in Hydroquinone Market Market

Explore the booming Hydroquinone market, projected to exceed $1.15 billion by 2033 with a steady 4.51% CAGR. Discover key drivers, applications in polymers, cosmetics, and more, and leading industry players.

December 2025
Base Year: 2024
No Of Pages: 234
Price: $4750

Technological Advances in South America Automotive Engine Oils Market Market: Trends and Opportunities 2025-2033

The size of the South America Automotive Engine Oils Market market was valued at USD XX Million in 2024 and is projected to reach USD XXX Million by 2033, with an expected CAGR of 3.15% during the forecast period.

December 2025
Base Year: 2024
No Of Pages: 210
Price: $4750

Navigating Singapore Automotive Engine Oils Market Market Growth 2025-2033

Explore the robust Singapore Automotive Engine Oils Market analysis, detailing market size, CAGR of 4.14%, key drivers, trends, and forecasts (2019-2033). Discover insights into passenger vehicles, commercial vehicles, and motorcycle segments.

December 2025
Base Year: 2024
No Of Pages: 180
Price: $3800

Ceramic Fiber Paper Market Future Pathways: Strategic Insights to 2033

Explore the robust growth of the Ceramic Fiber Paper Market, driven by energy efficiency demands and industrial applications. Get insights into market size, CAGR, key drivers, trends, restraints, and regional insights for the period 2019-2033.

December 2025
Base Year: 2024
No Of Pages: 150
Price: $4750

Europe Activated Carbon Industry Navigating Dynamics Comprehensive Analysis and Forecasts 2025-2033

Explore the dynamic European Activated Carbon market, forecast to grow significantly due to stringent environmental regulations and rising demand in water and gas purification. Discover key drivers, trends, and leading companies shaping this essential industry.

December 2025
Base Year: 2024
No Of Pages: 140
Price: $3,950

Recovered Carbon Black Market Market Overview: Growth and Insights

The size of the Recovered Carbon Black Market market was valued at USD XX Million in 2024 and is projected to reach USD XXX Million by 2033, with an expected CAGR of 2.00% during the forecast period.

December 2025
Base Year: 2024
No Of Pages: 234
Price: $4750

Consumer-Centric Trends in Latin America Surfactant Industry Industry

Explore the dynamic Latin America Surfactant Market forecast, driven by household, personal care, and industrial cleaning demand. Discover key growth drivers, emerging bio-based trends, and market size projections up to 2033.

December 2025
Base Year: 2024
No Of Pages: 234
Price: $4750

Metallic Stearate Market 2025-2033 Market Analysis: Trends, Dynamics, and Growth Opportunities

The size of the Metallic Stearate Market market was valued at USD 3.7 Billion in 2024 and is projected to reach USD 5.35 Billion by 2033, with an expected CAGR of 5.4% during the forecast period.

December 2025
Base Year: 2024
No Of Pages: 180
Price: $4750

Active Calcium Silicate Market Projected to Grow at XX CAGR: Insights and Forecasts 2025-2033

The size of the Active Calcium Silicate Market market was valued at USD 222.25 Million in 2024 and is projected to reach USD 322.23 Million by 2033, with an expected CAGR of 5.45% during the forecast period.

December 2025
Base Year: 2024
No Of Pages: 180
Price: $4750

Activated Carbon Fiber Industry Insights: Market Size Analysis to 2033

Explore the growing Activated Carbon Fiber market, projected to reach USD 414.13M by 2025 with a 3.71% CAGR. Discover drivers like purification demand, trends in advanced materials, and key players shaping the future of ACF applications in filtration, medical, and energy storage.

December 2025
Base Year: 2024
No Of Pages: 234
Price: $4750

Growth Strategies in LATAM Oilfield Chemicals Industry Market: 2025-2033 Outlook

Explore the Latin American oilfield chemicals market analysis, key drivers, trends, and growth forecasts. Discover market size, CAGR, segmentation, and leading companies shaping the future of oilfield operations in the region.

December 2025
Base Year: 2024
No Of Pages: 140
Price: $4750

Future Prospects for North America Boiler Water Treatment Chemicals Market Growth

Explore the North America Boiler Water Treatment Chemicals Market trends, drivers, and forecast (2025-2033). Discover key insights on growth drivers, restraints, and emerging opportunities in this vital industrial sector.

December 2025
Base Year: 2024
No Of Pages: 234
Price: $4750

Key Drivers for Silicone Gel Market Market Growth: Projections 2025-2033

The size of the Silicone Gel Market market was valued at USD XX Million in 2024 and is projected to reach USD XXX Million by 2033, with an expected CAGR of 5.00">> 5.00% during the forecast period.

December 2025
Base Year: 2024
No Of Pages: 150
Price: $4750

United Kingdom Protective Coatings Market in Developing Economies: Trends and Growth Analysis 2025-2033

Explore the United Kingdom protective coatings market forecast (2025-2033), driven by oil & gas, infrastructure, and sustainability trends. Discover market size, CAGR, key drivers, and leading companies shaping the future of industrial protection.

December 2025
Base Year: 2024
No Of Pages: 120
Price: $3,950

Polytetrafluoroethylene Industry Market Overview: Trends and Strategic Forecasts 2025-2033

The size of the Polytetrafluoroethylene Industry market was valued at USD XX Million in 2024 and is projected to reach USD XXX Million by 2033, with an expected CAGR of 4.00">> 4.00% during the forecast period.

November 2025
Base Year: 2024
No Of Pages: 150
Price: $3800

Abrasion Resistant Coating Market Analysis 2025 and Forecasts 2033: Unveiling Growth Opportunities

Explore the dynamic Abrasion Resistant Coating Market, driven by industrial durability needs, technological innovation, and a 5.00% CAGR. Discover key trends, market drivers, and growth opportunities in oil & gas, marine, and beyond.

November 2025
Base Year: 2024
No Of Pages: 180
Price: $4750

Pure Gas Industry Decoded: Comprehensive Analysis and Forecasts 2025-2033

Explore the dynamic Pure Gas industry market size, growth drivers, and key trends up to 2033. Discover insights into insulation, lighting, coolant, and critical applications in electronics, healthcare, and energy.

November 2025
Base Year: 2024
No Of Pages: 234
Price: $4750

Understanding Growth Trends in Cellulosic Polymers Market Market

Explore the dynamic Cellulosic Polymers Market, driven by sustainability trends and innovation. Discover market size, CAGR > 5.50%, key drivers, and growth opportunities in packaging, textiles, and pharmaceuticals from 2025-2033.

November 2025
Base Year: 2024
No Of Pages: 180
Price: $4750

APAC Scale Inhibitors Market: Disruptive Technologies Driving Market Growth 2025-2033

Explore the dynamic APAC Scale Inhibitors Market, featuring growth drivers, key trends, and market size projections exceeding $1.6 billion by 2025. Discover insights into industry segments, chemistry, and leading companies in this crucial water treatment sector.

November 2025
Base Year: 2024
No Of Pages: 234
Price: $4750

Strategic Vision for Cooling Fabrics Industry Market Expansion

Explore the dynamic Cooling Fabrics market, driven by innovation in sportswear, protective wear, and apparel. Discover growth drivers, key trends, and regional insights for this rapidly expanding textile sector.

November 2025
Base Year: 2024
No Of Pages: 180
Price: $4750

Exploring Rutile Market Market Disruption and Innovation

Explore the dynamic rutile market, projected for substantial growth driven by pigment, titanium metal, and ceramic applications. Discover key drivers, restraints, and regional trends shaping the future of rutile demand through 2033.

November 2025
Base Year: 2024
No Of Pages: 234
Price: $4750

Australia And New Zealand Aerosol Market Market’s Consumer Landscape: Insights and Trends 2025-2033

Explore the dynamic Australia and New Zealand aerosol market, driven by strong CAGR and diverse applications like automotive, personal care, and household products. Discover key trends, growth drivers, and leading companies shaping the future of aerosol packaging.

November 2025
Base Year: 2024
No Of Pages: 234
Price: $4750

Liquid Crystal Polymer (LCP) Films And Laminates Market Growth Opportunities and Market Forecast 2025-2033: A Strategic Analysis

Explore the dynamic Liquid Crystal Polymer (LCP) Films and Laminates Market, driven by electronics and automotive innovation. Discover market size, CAGR, key drivers, trends, restraints, and regional insights.

November 2025
Base Year: 2024
No Of Pages: 234
Price: $4750

Analyzing the Future of Viscose Industry: Key Trends to 2033

The size of the Viscose Industry market was valued at USD XX Million in 2024 and is projected to reach USD XXX Million by 2033, with an expected CAGR of 4.00">> 4.00% during the forecast period.

November 2025
Base Year: 2024
No Of Pages: 140
Price: $4750

Exploring Australia Architectural Coatings Market Market Disruption and Innovation

The size of the Australia Architectural Coatings Market market was valued at USD XX Million in 2024 and is projected to reach USD XXX Million by 2033, with an expected CAGR of 3.50">> 3.50% during the forecast period.

November 2025
Base Year: 2024
No Of Pages: 197
Price: $3800

Bio-based Platform Chemicals Market Innovations Shaping Market Growth 2025-2033

Explore the booming Bio-based Platform Chemicals Market, projected to reach $15.41 billion by 2025 with a 6.61% CAGR. Discover key drivers, emerging trends, restraints, and regional insights shaping the future of sustainable chemistry.

November 2025
Base Year: 2024
No Of Pages: 180
Price: $4750

Strategic Drivers and Barriers in China Commercial Vehicles Lubricants Industry Market 2025-2033

Explore the booming China Commercial Vehicles Lubricants Industry with insights on market size, CAGR 4.88%, key drivers like e-commerce and infrastructure, and trends in premium synthetic lubricants. Understand market segments and leading companies.

November 2025
Base Year: 2024
No Of Pages: 197
Price: $3800

High Performance Alloys Industry Market Overview: Growth and Insights

Explore the booming High Performance Alloys market, projected to exceed $65 billion by 2025. Discover key growth drivers in aerospace, automotive, and energy, and understand future trends with a 7.5% CAGR forecast.

November 2025
Base Year: 2024
No Of Pages: 234
Price: $4750

Exploring Strategic Mineral Materials Industry Growth Trajectories: CAGR Insights 2025-2033

Explore the burgeoning Strategic Mineral Materials market, driven by electric vehicles, renewable energy, and advanced technology. Discover key drivers, trends, restraints, and regional insights for this vital global industry.

November 2025
Base Year: 2024
No Of Pages: 180
Price: $4750

Bio-based Resins Industry Unlocking Growth Potential: 2025-2033 Analysis and Forecasts

Explore the booming Bio-based Resins market, driven by sustainability and eco-friendly alternatives. Discover market size, CAGR > 16.00%, key drivers, trends, and growth in packaging, textiles, and more.

November 2025
Base Year: 2024
No Of Pages: 180
Price: $4750

Regional Trends and Opportunities for Performance Additives Market Market

The size of the Performance Additives Market market was valued at USD XX Million in 2024 and is projected to reach USD XXX Million by 2033, with an expected CAGR of 8.00">> 8.00% during the forecast period.

November 2025
Base Year: 2024
No Of Pages: 234
Price: $4750

Angola Lubricants Market Market Expansion: Growth Outlook 2025-2033

Explore the Angola Lubricants Market forecast 2025-2033. Discover key drivers like automotive and heavy equipment growth, market size, CAGR, and leading companies.

November 2025
Base Year: 2024
No Of Pages: 120
Price: $3800

Analyzing Consumer Behavior in Flock Adhesives Market Market

The size of the Flock Adhesives Market market was valued at USD 2.79 Million in 2024 and is projected to reach USD XXX Million by 2033, with an expected CAGR of 5.50">> 5.50% during the forecast period.

November 2025
Base Year: 2024
No Of Pages: 180
Price: $4750

Decoding Market Trends in Silicone Surfactants Market: 2025-2033 Analysis

The size of the Silicone Surfactants Market market was valued at USD XX Million in 2024 and is projected to reach USD XXX Million by 2033, with an expected CAGR of 3.00">> 3.00% during the forecast period.

November 2025
Base Year: 2024
No Of Pages: 234
Price: $4750

Flexible Glass Market Market’s Consumer Insights and Trends

Explore the dynamic Flexible Glass market, projected to reach $1.80 billion with a 6.62% CAGR. Discover key drivers, innovative trends in displays, solar, automotive, medical, and wearable devices, and regional growth opportunities.

November 2025
Base Year: 2024
No Of Pages: 234
Price: $4750

Exploring Opportunities in Low Temperature Coatings Market Sector

Explore the dynamic Low Temperature Coatings Market, projected for substantial growth with a market size of $111.92 million and CAGR over 5%. Discover key drivers, emerging trends, and dominant resins like Polyester, Epoxy, and Polyurethane across industries from Automotive to Architectural. Understand regional insights for Asia Pacific, North America, and Europe, and the competitive landscape featuring Sherwin-Williams, PPG, and Akzo Nobel.

November 2025
Base Year: 2024
No Of Pages: 180
Price: $4750

North America Polyamide Market Unlocking Growth Potential: 2025-2033 Analysis and Forecasts

Explore the robust North America Polyamide Market forecast, driven by automotive, aerospace, and construction demand. Discover market size, CAGR, key drivers, trends, and competitive landscape.

November 2025
Base Year: 2024
No Of Pages: 197
Price: $3800

Strategic Vision for United States Construction Adhesives & Sealants Market Industry Trends

The size of the United States Construction Adhesives & Sealants Market market was valued at USD XX Million in 2024 and is projected to reach USD XXX Million by 2033, with an expected CAGR of 5.30">> 5.30% during the forecast period.

October 2025
Base Year: 2024
No Of Pages: 197
Price: $3800

Elastomeric Membrane Market Comprehensive Market Study: Trends and Predictions 2025-2033

Explore the dynamic Elastomeric Membrane Market, driven by demand for sustainable waterproofing. Discover key drivers, trends, restraints, and growth projections for polyurethane, acrylic, and silicone membranes across industries and regions.

October 2025
Base Year: 2024
No Of Pages: 234
Price: $4750

Natural Fatty Acids Market Projected to Grow at XX CAGR: Insights and Forecasts 2025-2033

Explore the dynamic Natural Fatty Acids market outlook from 2025-2033. Discover growth drivers, key trends, and market segmentation for industries like cosmetics, detergents, and lubricants.

October 2025
Base Year: 2024
No Of Pages: 180
Price: $4750

Phase Transfer Catalyst Market Strategic Insights for 2025 and Forecasts to 2033: Market Trends

Explore the booming Phase Transfer Catalyst market, driven by pharmaceutical, chemical, and agrochemical demand. Discover key drivers, restraints, and regional growth for this USD 1.07 billion industry with a 5.79% CAGR.

October 2025
Base Year: 2024
No Of Pages: 180
Price: $4750

Analyzing the Future of Poland Automotive Engine Oils Market: Key Trends to 2033

Explore the robust growth and key drivers of the Poland Automotive Engine Oils Market. Discover trends in synthetic oils, product segments, and leading companies shaping the future of lubrication through 2033.

October 2025
Base Year: 2024
No Of Pages: 197
Price: $3800

Analyzing Functional Additives for Plastic Packaging Market: Opportunities and Growth Patterns 2025-2033

The size of the Functional Additives for Plastic Packaging Market market was valued at USD XX Million in 2024 and is projected to reach USD XXX Million by 2033, with an expected CAGR of % during the forecast period.

October 2025
Base Year: 2024
No Of Pages: 234
Price: $4750

Emerging Trends in Thermoset Composites Market: A Technology Perspective 2025-2033

Explore the dynamic Thermoset Composites Market forecast, driven by aerospace, automotive, and wind energy sectors. Discover key growth drivers, resin and fiber trends, and regional market share.

October 2025
Base Year: 2024
No Of Pages: 234
Price: $4750

Strategic Growth Drivers for Hydrogen Peroxide Market Market

Explore the dynamic global Hydrogen Peroxide market forecast from 2025-2033. Discover key insights, growth drivers, market size, and regional trends for this essential industrial chemical.

October 2025
Base Year: 2024
No Of Pages: 180
Price: $4750

Innovation Trends in n-Hexane Market: Market Outlook 2025-2033

Explore the expanding n-Hexane market, driven by industrial solvents and edible oil extraction. Analyze growth drivers, trends, restraints, and regional dynamics for informed business strategies.

October 2025
Base Year: 2024
No Of Pages: 234
Price: $4750

Demand Patterns in Cooling Water Treatment Chemicals Market Market: Projections to 2033

Explore the booming Cooling Water Treatment Chemicals Market, valued at $11.8 billion and projected for 5.8% CAGR by 2033. Discover key drivers, trends, and industry insights for power, oil & gas, and more.

October 2025
Base Year: 2024
No Of Pages: 180
Price: $3,950

Regional Insights into Mexico Adhesives Market Market Growth

Explore the dynamic Mexico Adhesives Market with key insights into drivers, trends, and segments. Discover growth opportunities in Automotive, Construction, and Packaging. Forecasted to exceed USD 2,500 million by 2025 with a CAGR > 6.00%.

October 2025
Base Year: 2024
No Of Pages: 197
Price: $3800

Asia-Pacific Metallurgical Grade Fluorspar Industry 2025 Market Trends and 2033 Forecasts: Exploring Growth Potential

The size of the Asia-Pacific Metallurgical Grade Fluorspar Industry market was valued at USD XX Million in 2024 and is projected to reach USD XXX Million by 2033, with an expected CAGR of 2.00">> 2.00% during the forecast period.

October 2025
Base Year: 2024
No Of Pages: 234
Price: $4750

Overcoming Challenges in Primer Market Market: Strategic Insights 2025-2033

The size of the Primer Market market was valued at USD 21.34 Million in 2024 and is projected to reach USD 31.90 Million by 2033, with an expected CAGR of 5.91% during the forecast period.

October 2025
Base Year: 2024
No Of Pages: 234
Price: $3,950
  • Home
  • About Us
  • Industries
    • Packaging
    • Retail
    • Hospitality and Tourism
    • Agriculture
    • Manufacturing Products and Services
    • Healthcare
    • Logistics
    • Aerospace & Defense
    • Chemicals & Materials
    • Professional and Commercial Services
    • Financial Services and Investment Intelligence
    • Food & Beverage
    • Consumer Goods and Services
    • Animal Nutrition & Wellness
    • Technology, Media and Telecom
    • Real Estate and Construction
    • Automotive
    • Home and Property Improvement
    • Energy & Power
  • Services
  • Contact
Main Logo
  • Home
  • About Us
  • Industries
    • Packaging
    • Retail
    • Hospitality and Tourism
    • Agriculture
    • Manufacturing Products and Services
    • Healthcare
    • Logistics
    • Aerospace & Defense
    • Chemicals & Materials
    • Professional and Commercial Services
    • Financial Services and Investment Intelligence
    • Food & Beverage
    • Consumer Goods and Services
    • Animal Nutrition & Wellness
    • Technology, Media and Telecom
    • Real Estate and Construction
    • Automotive
    • Home and Property Improvement
    • Energy & Power
  • Services
  • Contact
+17162654855
[email protected]

+17162654855

[email protected]

Business Address

Head Office

Ansec House 3 rd floor Tank Road, Yerwada, Pune, Maharashtra 411014

Contact Information

Craig Francis

Business Development Head

+17162654855

[email protected]

Secure Payment Partners

payment image
RetailPackagingLogisticsHealthcareAutomotiveAgricultureEnergy & PowerFood & BeverageAerospace & DefenseChemicals & MaterialsHospitality and TourismConsumer Goods and ServicesAnimal Nutrition & WellnessReal Estate and ConstructionTechnology, Media and TelecomHome and Property ImprovementManufacturing Products and ServicesFinancial Services and Investment Intelligence

© 2025 PRDUA Research & Media Private Limited, All rights reserved

Privacy Policy
Terms and Conditions
FAQ