Key Insights
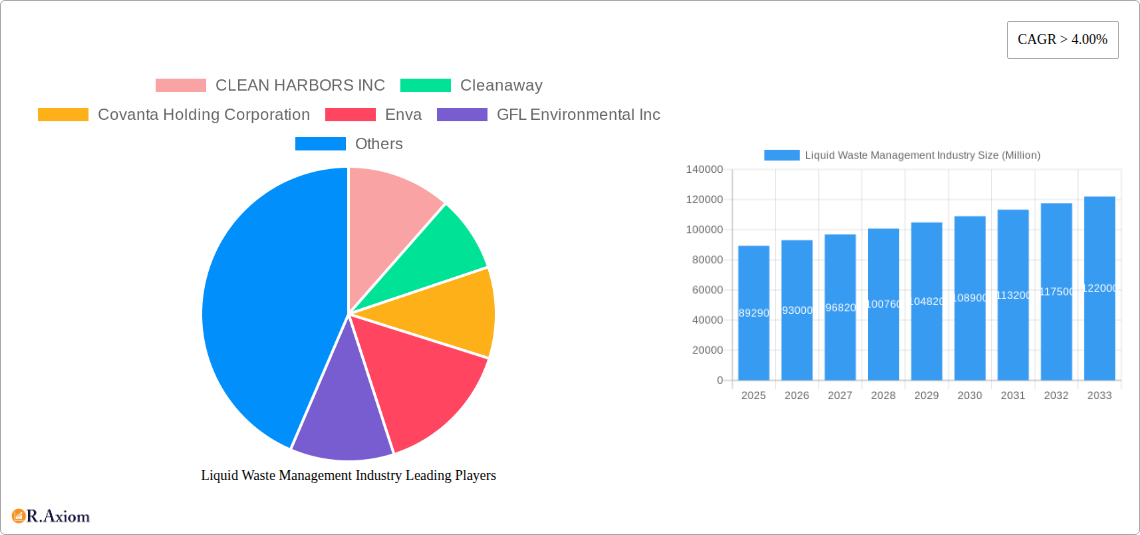
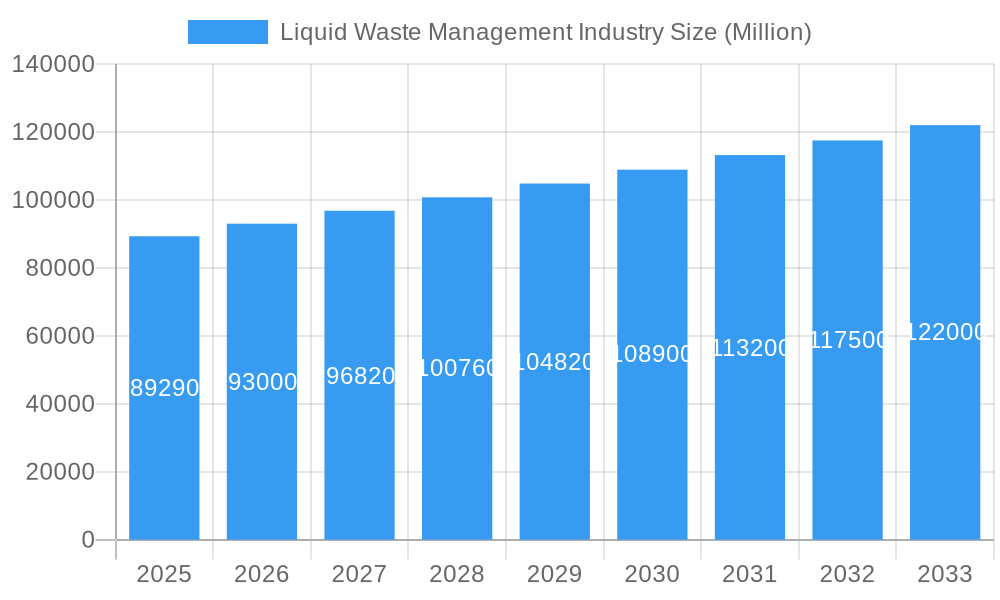
The global liquid waste management market, valued at $89.29 billion in 2025, is projected to experience robust growth, exhibiting a Compound Annual Growth Rate (CAGR) exceeding 4.00% from 2025 to 2033. This expansion is driven by several key factors. Stringent government regulations aimed at protecting water bodies and preventing environmental pollution are compelling businesses and municipalities to invest heavily in advanced liquid waste treatment technologies. The increasing urbanization and industrialization globally contribute significantly to the rising volume of liquid waste generated, fueling demand for efficient and sustainable management solutions. Furthermore, the growing awareness of environmental sustainability and the adoption of circular economy principles are promoting the development and adoption of resource recovery techniques from liquid waste, creating new revenue streams for waste management companies. Technological advancements in areas such as membrane filtration, advanced oxidation processes, and anaerobic digestion are also playing a crucial role in enhancing efficiency and reducing the environmental footprint of liquid waste management.
Liquid Waste Management Industry Market Size (In Billion)
The competitive landscape is characterized by a mix of large multinational corporations and regional players. Companies like Clean Harbors, Cleanaway, Covanta, and Veolia are leading the market, leveraging their extensive experience and technological capabilities to secure significant market shares. However, smaller, specialized firms are also emerging, focusing on niche applications or innovative technologies. Regional variations in regulatory frameworks, infrastructure development, and economic growth are likely to influence market dynamics in the coming years. North America and Europe are expected to remain dominant regions, benefiting from mature infrastructure and stringent environmental regulations. However, emerging economies in Asia-Pacific and Latin America are anticipated to witness accelerated growth due to rapid urbanization and industrial expansion. While challenges such as high capital investment for infrastructure upgrades and the need for skilled labor persist, the long-term outlook for the liquid waste management industry remains positive, driven by the growing need for sustainable and environmentally responsible waste management solutions.
Liquid Waste Management Industry Company Market Share
Liquid Waste Management Industry: A Comprehensive Market Report (2019-2033)
This detailed report provides a comprehensive analysis of the global liquid waste management industry, offering valuable insights for stakeholders, investors, and industry professionals. The study period covers 2019-2033, with 2025 as the base and estimated year. The report forecasts market trends until 2033, leveraging data from the historical period (2019-2024). The market is valued at $xx Million in 2025 and is projected to reach $xx Million by 2033, exhibiting a CAGR of xx%.
Liquid Waste Management Industry Market Concentration & Innovation
The global liquid waste management market exhibits a moderately concentrated structure, with several large multinational players and a significant number of smaller, regional operators. Key players like CLEAN HARBORS INC, Cleanaway, Covanta Holding Corporation, Enva, GFL Environmental Inc, Hulsey (a Blue Flow Company), Ovivo, REMONDIS SE & Co KG, SUEZ, Veolia, and WM Intellectual Property Holdings L L C hold significant market share, although the exact figures vary by region and segment. Market share data for 2025 suggests CLEAN HARBORS INC holds approximately xx% market share, followed by SUEZ at xx%, and Veolia at xx%. These percentages are estimations based on available information and may vary slightly.
Innovation in the sector is driven by stringent environmental regulations, increasing demand for sustainable waste management solutions, and technological advancements in treatment and disposal technologies. Key drivers include the development of advanced treatment technologies like membrane bioreactors and anaerobic digestion, as well as the adoption of digital solutions for monitoring and optimizing operations.
- Market Concentration: Moderately concentrated, with a few dominant players and many smaller firms.
- Innovation Drivers: Stringent environmental regulations, sustainable solutions demand, and technological advancements.
- Regulatory Frameworks: Vary widely by region, influencing investment and technology adoption.
- Product Substitutes: Limited effective substitutes exist for comprehensive liquid waste management services.
- End-User Trends: Growing awareness of environmental impact leads to higher demand for eco-friendly solutions.
- M&A Activities: Significant M&A activity in recent years, driven by consolidation and expansion strategies (e.g., the SUEZ acquisition of Devon Contract Waste). Total M&A deal value in the past five years is estimated at $xx Million.
Liquid Waste Management Industry Industry Trends & Insights
The liquid waste management market is experiencing a period of significant and sustained growth, propelled by a powerful combination of regulatory, economic, and technological forces. Globally, an increasingly stringent regulatory framework is compelling industries and municipalities to prioritize and adopt more sustainable and responsible waste management practices. This environmental imperative is directly contributing to the robust expansion of the market.
Furthermore, the relentless pace of urbanization and industrialization worldwide is a major catalyst, leading to a substantial increase in the volume and complexity of liquid waste generated. This escalating generation fuels a continuous and growing demand for sophisticated and effective treatment and disposal solutions. Simultaneously, rapid technological advancements are revolutionizing the sector. Innovations in advanced treatment technologies, such as membrane filtration, advanced oxidation processes, and biological nutrient removal, are significantly enhancing treatment efficiency and efficacy. Digitalization, including the implementation of IoT-enabled monitoring systems, predictive analytics, and automated operational controls, is further optimizing operational workflows, reducing downtime, and lowering overall operational costs.
Consumer and public consciousness is also playing a pivotal role. There's a discernible and growing shift in consumer preferences towards environmentally conscious businesses and services, which in turn is pushing the industry to prioritize and invest in sustainable practices and circular economy principles. The competitive landscape is dynamic, characterized by a blend of intense rivalry and strategic collaborations. Key industry players are actively pursuing mergers and acquisitions (M&A) to consolidate market share and expand service offerings, while simultaneously investing heavily in technological innovation and strategic geographical expansion to solidify their market positions and tap into new growth avenues. The market is projected to witness considerable and continued growth, with many industry leaders making substantial investments in expanding their operational capacities and enhancing their technological capabilities to effectively capitalize on the escalating global demand for advanced liquid waste management solutions.
The compound annual growth rate (CAGR) for the period 2025-2033 is estimated to be robust, with specific market penetration rates exhibiting considerable variation across different geographic regions and distinct market segments. Mature markets such as North America and Europe are currently demonstrating higher penetration rates, largely attributed to their well-established advanced infrastructure and consistently stringent environmental regulations that mandate sophisticated waste management practices.
Dominant Markets & Segments in Liquid Waste Management Industry
The North American region currently dominates the global liquid waste management market, driven by factors such as robust economic growth, stringent environmental regulations, and well-developed infrastructure. The United States and Canada are particularly prominent within this region, accounting for a significant share of the total market value.
Key Drivers in North America:
- Stringent environmental regulations.
- High levels of industrial activity.
- Advanced infrastructure supporting waste management operations.
- Significant investment in technological advancements.
Dominance Analysis: The dominance of North America is attributed to a combination of factors, including the higher concentration of large industrial companies, robust economic growth, and proactive environmental policies promoting sustainable waste management practices. However, other regions, such as Europe and Asia-Pacific, are witnessing significant growth and are expected to increase their market share in the coming years.
Liquid Waste Management Industry Product Developments
Recent product innovations within the liquid waste management sector have focused on enhancing treatment efficiency, reducing environmental impact, and optimizing operational costs. New technologies like advanced membrane filtration systems and bioremediation techniques are improving the quality of treated wastewater, while advanced digital monitoring systems are providing real-time data to optimize operational efficiency and reduce energy consumption. These advancements are aligned with growing regulatory pressures and consumer demand for environmentally friendly and cost-effective solutions, leading to a competitive market with continuous innovation.
Report Scope & Segmentation Analysis
This comprehensive report offers a granular analysis of the liquid waste management market, meticulously segmenting it based on several critical parameters to provide a holistic understanding of its dynamics:
- Waste Type: The market is segmented into Industrial Liquid Waste, Municipal Liquid Waste, and Agricultural Liquid Waste. Each of these categories presents unique challenges, growth trajectories, and distinct competitive landscapes. The industrial segment, in particular, is projected to experience a significant CAGR of approximately xx%, driven by evolving industrial processes and stricter discharge limits.
- Treatment Technology: An in-depth analysis is provided for key treatment technologies, including Biological Treatment (e.g., activated sludge, anaerobic digestion), Chemical Treatment (e.g., coagulation, flocculation, disinfection), and Physical Treatment (e.g., filtration, sedimentation, evaporation). Biological treatment is anticipated to witness higher adoption rates due to its inherent sustainability, cost-effectiveness, and lower environmental footprint.
- Geography: The report provides detailed regional insights for North America, Europe, Asia-Pacific, Latin America, and the Middle East & Africa. Each region possesses unique market characteristics, regulatory environments, economic development levels, and infrastructure, influencing market trends and opportunities.
- Service Type: A comprehensive overview of the entire liquid waste management value chain is presented, segmented by Service Type: Collection, Transportation, Treatment, and Disposal. This segmentation highlights the interconnectedness of these services and their respective market dynamics.
Key Drivers of Liquid Waste Management Industry Growth
The sustained and accelerated growth of the liquid waste management industry is fundamentally driven by a powerful and interconnected confluence of factors:
- Stringent Environmental Regulations: Governments and international bodies worldwide are continually implementing and enforcing stricter environmental regulations aimed at mitigating water pollution, protecting aquatic ecosystems, and ensuring public health. These regulations, including discharge limits, water quality standards, and waste disposal mandates, directly stimulate and necessitate the adoption of advanced and compliant liquid waste treatment technologies and services.
- Economic Growth and Industrialization: As economies expand and industrial sectors develop, particularly in emerging nations, there is a proportional increase in the generation of liquid waste from various industrial processes and urban populations. This rise in waste volume and complexity inherently drives the demand for effective and scalable liquid waste management solutions.
- Technological Advancements and Innovation: Ongoing innovation in treatment technologies is a critical growth enabler. Breakthroughs in areas such as anaerobic digestion for biogas production, advanced membrane technologies for water reuse, and smart sensor networks for real-time monitoring are significantly improving treatment efficiency, reducing operational costs, enhancing the environmental sustainability of waste management processes, and enabling resource recovery.
Challenges in the Liquid Waste Management Industry Sector
Despite the positive growth outlook, the liquid waste management sector faces several challenges:
- High Capital Expenditures: Investing in new treatment facilities and technologies can be expensive, particularly for smaller firms.
- Strict Regulatory Compliance: Meeting stringent environmental regulations can be challenging and requires significant investment in compliance measures.
- Fluctuating Raw Material Prices: The price volatility of chemicals and other materials used in treatment processes can impact profitability.
Emerging Opportunities in Liquid Waste Management Industry
The liquid waste management industry is not only responding to existing demands but is also strategically positioned to capitalize on several promising emerging opportunities:
- Growing Demand for Renewable Energy and Circular Economy Principles: The increasing global emphasis on renewable energy sources and circular economy models presents significant opportunities. Technologies like anaerobic digestion offer a dual benefit: treating liquid waste while simultaneously generating valuable biogas, a renewable energy source. This transforms waste from a liability into an asset.
- Resource Recovery and Value Addition: Advancements in treatment and separation technologies are increasingly enabling the recovery of valuable resources from liquid waste streams. This includes the extraction of nutrients (like phosphorus and nitrogen), metals, and even water for reuse in industrial processes or irrigation, thereby creating new revenue streams and promoting a more sustainable approach to waste management.
- Expansion into Emerging Markets and Developing Economies: Developing countries undergoing rapid urbanization and industrialization often face significant challenges in managing their escalating liquid waste. These regions represent substantial untapped growth potential for liquid waste management service providers and technology developers, offering opportunities for infrastructure development and the implementation of modern waste management systems.
Leading Players in the Liquid Waste Management Industry Market
- CLEAN HARBORS INC
- Cleanaway
- Covanta Holding Corporation
- Enva
- GFL Environmental Inc
- Hulsey (a Blue Flow Company)
- Ovivo
- REMONDIS SE & Co KG
- SUEZ
- Veolia
- WM Intellectual Property Holdings L L C
- *List Not Exhaustive
Key Developments in Liquid Waste Management Industry Industry
- October 2023: SUEZ Recycling and Recovery UK strategically enhanced its market presence and service capabilities through the acquisition of Devon Contract Waste (DCW), a move aimed at expanding its regional footprint and service offerings.
- September 2023: SUEZ secured significant contracts for vital water and waste management projects in China, demonstrating its commitment to supporting the country's ambitious carbon neutrality goals and its growing need for advanced environmental solutions.
- January 2022: The completion of Veolia's acquisition of the new SUEZ marked a significant consolidation in the global water and waste management landscape, leading to shifts in market dynamics and competitive strategies within the industry.
Strategic Outlook for Liquid Waste Management Industry Market
The future of the liquid waste management market looks promising, driven by increasing environmental awareness, stringent regulations, and technological advancements. Growing urbanization and industrial activity will continue to fuel demand, while innovation in treatment technologies will enhance efficiency and reduce environmental impact. Companies focusing on sustainable solutions and technological innovation are well-positioned to capitalize on the expanding market opportunities.
Liquid Waste Management Industry Segmentation
-
1. Source
- 1.1. Residential
- 1.2. Commercial
- 1.3. Industrial
-
2. Service
- 2.1. Collection
- 2.2. Transportation/Hauling
- 2.3. Disposal/Recycling
-
3. End-user Industry
- 3.1. Automotive
- 3.2. Iron and Steel
- 3.3. Oil and Gas
- 3.4. Pharmaceutical
- 3.5. Textile
- 3.6. Other En
Liquid Waste Management Industry Segmentation By Geography
-
1. Asia Pacific
- 1.1. China
- 1.2. India
- 1.3. Japan
- 1.4. South Korea
- 1.5. Rest of Asia Pacific
-
2. North America
- 2.1. United States
- 2.2. Canada
- 2.3. Mexico
-
3. Europe
- 3.1. Germany
- 3.2. United Kingdom
- 3.3. France
- 3.4. Italy
- 3.5. Rest of Europe
-
4. South America
- 4.1. Brazil
- 4.2. Argentina
- 4.3. Rest of South America
-
5. Middle East and Africa
- 5.1. Saudi Arabia
- 5.2. South Africa
- 5.3. Rest of Middle East and Africa

Liquid Waste Management Industry Regional Market Share
Geographic Coverage of Liquid Waste Management Industry
Liquid Waste Management Industry REPORT HIGHLIGHTS
| Aspects | Details |
|---|---|
| Study Period | 2020-2034 |
| Base Year | 2025 |
| Estimated Year | 2026 |
| Forecast Period | 2026-2034 |
| Historical Period | 2020-2025 |
| Growth Rate | CAGR of > 4.00% from 2020-2034 |
| Segmentation |
|
Table of Contents
- 1. Introduction
- 1.1. Research Scope
- 1.2. Market Segmentation
- 1.3. Research Objective
- 1.4. Definitions and Assumptions
- 2. Executive Summary
- 2.1. Market Snapshot
- 3. Market Dynamics
- 3.1. Market Drivers
- 3.2. Market Restrains
- 3.3. Market Trends
- 3.4. Market Opportunities
- 4. Market Factor Analysis
- 4.1. Porters Five Forces
- 4.1.1. Bargaining Power of Suppliers
- 4.1.2. Bargaining Power of Buyers
- 4.1.3. Threat of New Entrants
- 4.1.4. Threat of Substitutes
- 4.1.5. Competitive Rivalry
- 4.2. PESTEL analysis
- 4.3. BCG Analysis
- 4.3.1. Stars (High Growth, High Market Share)
- 4.3.2. Cash Cows (Low Growth, High Market Share)
- 4.3.3. Question Mark (High Growth, Low Market Share)
- 4.3.4. Dogs (Low Growth, Low Market Share)
- 4.4. Ansoff Matrix Analysis
- 4.5. Supply Chain Analysis
- 4.6. Regulatory Landscape
- 4.7. Current Market Potential and Opportunity Assessment (TAM–SAM–SOM Framework)
- 4.8. RAX Analyst Note
- 4.1. Porters Five Forces
- 5. Market Analysis, Insights and Forecast 2021-2033
- 5.1. Market Analysis, Insights and Forecast - by Source
- 5.1.1. Residential
- 5.1.2. Commercial
- 5.1.3. Industrial
- 5.2. Market Analysis, Insights and Forecast - by Service
- 5.2.1. Collection
- 5.2.2. Transportation/Hauling
- 5.2.3. Disposal/Recycling
- 5.3. Market Analysis, Insights and Forecast - by End-user Industry
- 5.3.1. Automotive
- 5.3.2. Iron and Steel
- 5.3.3. Oil and Gas
- 5.3.4. Pharmaceutical
- 5.3.5. Textile
- 5.3.6. Other En
- 5.4. Market Analysis, Insights and Forecast - by Region
- 5.4.1. Asia Pacific
- 5.4.2. North America
- 5.4.3. Europe
- 5.4.4. South America
- 5.4.5. Middle East and Africa
- 5.1. Market Analysis, Insights and Forecast - by Source
- 6. Global Liquid Waste Management Industry Analysis, Insights and Forecast, 2021-2033
- 6.1. Market Analysis, Insights and Forecast - by Source
- 6.1.1. Residential
- 6.1.2. Commercial
- 6.1.3. Industrial
- 6.2. Market Analysis, Insights and Forecast - by Service
- 6.2.1. Collection
- 6.2.2. Transportation/Hauling
- 6.2.3. Disposal/Recycling
- 6.3. Market Analysis, Insights and Forecast - by End-user Industry
- 6.3.1. Automotive
- 6.3.2. Iron and Steel
- 6.3.3. Oil and Gas
- 6.3.4. Pharmaceutical
- 6.3.5. Textile
- 6.3.6. Other En
- 6.1. Market Analysis, Insights and Forecast - by Source
- 7. Asia Pacific Liquid Waste Management Industry Analysis, Insights and Forecast, 2020-2032
- 7.1. Market Analysis, Insights and Forecast - by Source
- 7.1.1. Residential
- 7.1.2. Commercial
- 7.1.3. Industrial
- 7.2. Market Analysis, Insights and Forecast - by Service
- 7.2.1. Collection
- 7.2.2. Transportation/Hauling
- 7.2.3. Disposal/Recycling
- 7.3. Market Analysis, Insights and Forecast - by End-user Industry
- 7.3.1. Automotive
- 7.3.2. Iron and Steel
- 7.3.3. Oil and Gas
- 7.3.4. Pharmaceutical
- 7.3.5. Textile
- 7.3.6. Other En
- 7.1. Market Analysis, Insights and Forecast - by Source
- 8. North America Liquid Waste Management Industry Analysis, Insights and Forecast, 2020-2032
- 8.1. Market Analysis, Insights and Forecast - by Source
- 8.1.1. Residential
- 8.1.2. Commercial
- 8.1.3. Industrial
- 8.2. Market Analysis, Insights and Forecast - by Service
- 8.2.1. Collection
- 8.2.2. Transportation/Hauling
- 8.2.3. Disposal/Recycling
- 8.3. Market Analysis, Insights and Forecast - by End-user Industry
- 8.3.1. Automotive
- 8.3.2. Iron and Steel
- 8.3.3. Oil and Gas
- 8.3.4. Pharmaceutical
- 8.3.5. Textile
- 8.3.6. Other En
- 8.1. Market Analysis, Insights and Forecast - by Source
- 9. Europe Liquid Waste Management Industry Analysis, Insights and Forecast, 2020-2032
- 9.1. Market Analysis, Insights and Forecast - by Source
- 9.1.1. Residential
- 9.1.2. Commercial
- 9.1.3. Industrial
- 9.2. Market Analysis, Insights and Forecast - by Service
- 9.2.1. Collection
- 9.2.2. Transportation/Hauling
- 9.2.3. Disposal/Recycling
- 9.3. Market Analysis, Insights and Forecast - by End-user Industry
- 9.3.1. Automotive
- 9.3.2. Iron and Steel
- 9.3.3. Oil and Gas
- 9.3.4. Pharmaceutical
- 9.3.5. Textile
- 9.3.6. Other En
- 9.1. Market Analysis, Insights and Forecast - by Source
- 10. South America Liquid Waste Management Industry Analysis, Insights and Forecast, 2020-2032
- 10.1. Market Analysis, Insights and Forecast - by Source
- 10.1.1. Residential
- 10.1.2. Commercial
- 10.1.3. Industrial
- 10.2. Market Analysis, Insights and Forecast - by Service
- 10.2.1. Collection
- 10.2.2. Transportation/Hauling
- 10.2.3. Disposal/Recycling
- 10.3. Market Analysis, Insights and Forecast - by End-user Industry
- 10.3.1. Automotive
- 10.3.2. Iron and Steel
- 10.3.3. Oil and Gas
- 10.3.4. Pharmaceutical
- 10.3.5. Textile
- 10.3.6. Other En
- 10.1. Market Analysis, Insights and Forecast - by Source
- 11. Middle East and Africa Liquid Waste Management Industry Analysis, Insights and Forecast, 2020-2032
- 11.1. Market Analysis, Insights and Forecast - by Source
- 11.1.1. Residential
- 11.1.2. Commercial
- 11.1.3. Industrial
- 11.2. Market Analysis, Insights and Forecast - by Service
- 11.2.1. Collection
- 11.2.2. Transportation/Hauling
- 11.2.3. Disposal/Recycling
- 11.3. Market Analysis, Insights and Forecast - by End-user Industry
- 11.3.1. Automotive
- 11.3.2. Iron and Steel
- 11.3.3. Oil and Gas
- 11.3.4. Pharmaceutical
- 11.3.5. Textile
- 11.3.6. Other En
- 11.1. Market Analysis, Insights and Forecast - by Source
- 12. Competitive Analysis
- 12.1. Company Profiles
- 12.1.1 CLEAN HARBORS INC
- 12.1.1.1. Company Overview
- 12.1.1.2. Products
- 12.1.1.3. Company Financials
- 12.1.1.4. SWOT Analysis
- 12.1.2 Cleanaway
- 12.1.2.1. Company Overview
- 12.1.2.2. Products
- 12.1.2.3. Company Financials
- 12.1.2.4. SWOT Analysis
- 12.1.3 Covanta Holding Corporation
- 12.1.3.1. Company Overview
- 12.1.3.2. Products
- 12.1.3.3. Company Financials
- 12.1.3.4. SWOT Analysis
- 12.1.4 Enva
- 12.1.4.1. Company Overview
- 12.1.4.2. Products
- 12.1.4.3. Company Financials
- 12.1.4.4. SWOT Analysis
- 12.1.5 GFL Environmental Inc
- 12.1.5.1. Company Overview
- 12.1.5.2. Products
- 12.1.5.3. Company Financials
- 12.1.5.4. SWOT Analysis
- 12.1.6 Hulsey (a Blue Flow Company)
- 12.1.6.1. Company Overview
- 12.1.6.2. Products
- 12.1.6.3. Company Financials
- 12.1.6.4. SWOT Analysis
- 12.1.7 Ovivo
- 12.1.7.1. Company Overview
- 12.1.7.2. Products
- 12.1.7.3. Company Financials
- 12.1.7.4. SWOT Analysis
- 12.1.8 REMONDIS SE & Co KG
- 12.1.8.1. Company Overview
- 12.1.8.2. Products
- 12.1.8.3. Company Financials
- 12.1.8.4. SWOT Analysis
- 12.1.9 SUEZ
- 12.1.9.1. Company Overview
- 12.1.9.2. Products
- 12.1.9.3. Company Financials
- 12.1.9.4. SWOT Analysis
- 12.1.10 Veolia
- 12.1.10.1. Company Overview
- 12.1.10.2. Products
- 12.1.10.3. Company Financials
- 12.1.10.4. SWOT Analysis
- 12.1.11 WM Intellectual Property Holdings L L C *List Not Exhaustive
- 12.1.11.1. Company Overview
- 12.1.11.2. Products
- 12.1.11.3. Company Financials
- 12.1.11.4. SWOT Analysis
- 12.1.1 CLEAN HARBORS INC
- 12.2. Market Entropy
- 12.2.1 Company's Key Areas Served
- 12.2.2 Recent Developments
- 12.3. Company Market Share Analysis 2025
- 12.3.1 Top 5 Companies Market Share Analysis
- 12.3.2 Top 3 Companies Market Share Analysis
- 12.4. List of Potential Customers
- 13. Research Methodology
List of Figures
- Figure 1: Global Liquid Waste Management Industry Revenue Breakdown (Million, %) by Region 2025 & 2033
- Figure 2: Global Liquid Waste Management Industry Volume Breakdown (Billion, %) by Region 2025 & 2033
- Figure 3: Asia Pacific Liquid Waste Management Industry Revenue (Million), by Source 2025 & 2033
- Figure 4: Asia Pacific Liquid Waste Management Industry Volume (Billion), by Source 2025 & 2033
- Figure 5: Asia Pacific Liquid Waste Management Industry Revenue Share (%), by Source 2025 & 2033
- Figure 6: Asia Pacific Liquid Waste Management Industry Volume Share (%), by Source 2025 & 2033
- Figure 7: Asia Pacific Liquid Waste Management Industry Revenue (Million), by Service 2025 & 2033
- Figure 8: Asia Pacific Liquid Waste Management Industry Volume (Billion), by Service 2025 & 2033
- Figure 9: Asia Pacific Liquid Waste Management Industry Revenue Share (%), by Service 2025 & 2033
- Figure 10: Asia Pacific Liquid Waste Management Industry Volume Share (%), by Service 2025 & 2033
- Figure 11: Asia Pacific Liquid Waste Management Industry Revenue (Million), by End-user Industry 2025 & 2033
- Figure 12: Asia Pacific Liquid Waste Management Industry Volume (Billion), by End-user Industry 2025 & 2033
- Figure 13: Asia Pacific Liquid Waste Management Industry Revenue Share (%), by End-user Industry 2025 & 2033
- Figure 14: Asia Pacific Liquid Waste Management Industry Volume Share (%), by End-user Industry 2025 & 2033
- Figure 15: Asia Pacific Liquid Waste Management Industry Revenue (Million), by Country 2025 & 2033
- Figure 16: Asia Pacific Liquid Waste Management Industry Volume (Billion), by Country 2025 & 2033
- Figure 17: Asia Pacific Liquid Waste Management Industry Revenue Share (%), by Country 2025 & 2033
- Figure 18: Asia Pacific Liquid Waste Management Industry Volume Share (%), by Country 2025 & 2033
- Figure 19: North America Liquid Waste Management Industry Revenue (Million), by Source 2025 & 2033
- Figure 20: North America Liquid Waste Management Industry Volume (Billion), by Source 2025 & 2033
- Figure 21: North America Liquid Waste Management Industry Revenue Share (%), by Source 2025 & 2033
- Figure 22: North America Liquid Waste Management Industry Volume Share (%), by Source 2025 & 2033
- Figure 23: North America Liquid Waste Management Industry Revenue (Million), by Service 2025 & 2033
- Figure 24: North America Liquid Waste Management Industry Volume (Billion), by Service 2025 & 2033
- Figure 25: North America Liquid Waste Management Industry Revenue Share (%), by Service 2025 & 2033
- Figure 26: North America Liquid Waste Management Industry Volume Share (%), by Service 2025 & 2033
- Figure 27: North America Liquid Waste Management Industry Revenue (Million), by End-user Industry 2025 & 2033
- Figure 28: North America Liquid Waste Management Industry Volume (Billion), by End-user Industry 2025 & 2033
- Figure 29: North America Liquid Waste Management Industry Revenue Share (%), by End-user Industry 2025 & 2033
- Figure 30: North America Liquid Waste Management Industry Volume Share (%), by End-user Industry 2025 & 2033
- Figure 31: North America Liquid Waste Management Industry Revenue (Million), by Country 2025 & 2033
- Figure 32: North America Liquid Waste Management Industry Volume (Billion), by Country 2025 & 2033
- Figure 33: North America Liquid Waste Management Industry Revenue Share (%), by Country 2025 & 2033
- Figure 34: North America Liquid Waste Management Industry Volume Share (%), by Country 2025 & 2033
- Figure 35: Europe Liquid Waste Management Industry Revenue (Million), by Source 2025 & 2033
- Figure 36: Europe Liquid Waste Management Industry Volume (Billion), by Source 2025 & 2033
- Figure 37: Europe Liquid Waste Management Industry Revenue Share (%), by Source 2025 & 2033
- Figure 38: Europe Liquid Waste Management Industry Volume Share (%), by Source 2025 & 2033
- Figure 39: Europe Liquid Waste Management Industry Revenue (Million), by Service 2025 & 2033
- Figure 40: Europe Liquid Waste Management Industry Volume (Billion), by Service 2025 & 2033
- Figure 41: Europe Liquid Waste Management Industry Revenue Share (%), by Service 2025 & 2033
- Figure 42: Europe Liquid Waste Management Industry Volume Share (%), by Service 2025 & 2033
- Figure 43: Europe Liquid Waste Management Industry Revenue (Million), by End-user Industry 2025 & 2033
- Figure 44: Europe Liquid Waste Management Industry Volume (Billion), by End-user Industry 2025 & 2033
- Figure 45: Europe Liquid Waste Management Industry Revenue Share (%), by End-user Industry 2025 & 2033
- Figure 46: Europe Liquid Waste Management Industry Volume Share (%), by End-user Industry 2025 & 2033
- Figure 47: Europe Liquid Waste Management Industry Revenue (Million), by Country 2025 & 2033
- Figure 48: Europe Liquid Waste Management Industry Volume (Billion), by Country 2025 & 2033
- Figure 49: Europe Liquid Waste Management Industry Revenue Share (%), by Country 2025 & 2033
- Figure 50: Europe Liquid Waste Management Industry Volume Share (%), by Country 2025 & 2033
- Figure 51: South America Liquid Waste Management Industry Revenue (Million), by Source 2025 & 2033
- Figure 52: South America Liquid Waste Management Industry Volume (Billion), by Source 2025 & 2033
- Figure 53: South America Liquid Waste Management Industry Revenue Share (%), by Source 2025 & 2033
- Figure 54: South America Liquid Waste Management Industry Volume Share (%), by Source 2025 & 2033
- Figure 55: South America Liquid Waste Management Industry Revenue (Million), by Service 2025 & 2033
- Figure 56: South America Liquid Waste Management Industry Volume (Billion), by Service 2025 & 2033
- Figure 57: South America Liquid Waste Management Industry Revenue Share (%), by Service 2025 & 2033
- Figure 58: South America Liquid Waste Management Industry Volume Share (%), by Service 2025 & 2033
- Figure 59: South America Liquid Waste Management Industry Revenue (Million), by End-user Industry 2025 & 2033
- Figure 60: South America Liquid Waste Management Industry Volume (Billion), by End-user Industry 2025 & 2033
- Figure 61: South America Liquid Waste Management Industry Revenue Share (%), by End-user Industry 2025 & 2033
- Figure 62: South America Liquid Waste Management Industry Volume Share (%), by End-user Industry 2025 & 2033
- Figure 63: South America Liquid Waste Management Industry Revenue (Million), by Country 2025 & 2033
- Figure 64: South America Liquid Waste Management Industry Volume (Billion), by Country 2025 & 2033
- Figure 65: South America Liquid Waste Management Industry Revenue Share (%), by Country 2025 & 2033
- Figure 66: South America Liquid Waste Management Industry Volume Share (%), by Country 2025 & 2033
- Figure 67: Middle East and Africa Liquid Waste Management Industry Revenue (Million), by Source 2025 & 2033
- Figure 68: Middle East and Africa Liquid Waste Management Industry Volume (Billion), by Source 2025 & 2033
- Figure 69: Middle East and Africa Liquid Waste Management Industry Revenue Share (%), by Source 2025 & 2033
- Figure 70: Middle East and Africa Liquid Waste Management Industry Volume Share (%), by Source 2025 & 2033
- Figure 71: Middle East and Africa Liquid Waste Management Industry Revenue (Million), by Service 2025 & 2033
- Figure 72: Middle East and Africa Liquid Waste Management Industry Volume (Billion), by Service 2025 & 2033
- Figure 73: Middle East and Africa Liquid Waste Management Industry Revenue Share (%), by Service 2025 & 2033
- Figure 74: Middle East and Africa Liquid Waste Management Industry Volume Share (%), by Service 2025 & 2033
- Figure 75: Middle East and Africa Liquid Waste Management Industry Revenue (Million), by End-user Industry 2025 & 2033
- Figure 76: Middle East and Africa Liquid Waste Management Industry Volume (Billion), by End-user Industry 2025 & 2033
- Figure 77: Middle East and Africa Liquid Waste Management Industry Revenue Share (%), by End-user Industry 2025 & 2033
- Figure 78: Middle East and Africa Liquid Waste Management Industry Volume Share (%), by End-user Industry 2025 & 2033
- Figure 79: Middle East and Africa Liquid Waste Management Industry Revenue (Million), by Country 2025 & 2033
- Figure 80: Middle East and Africa Liquid Waste Management Industry Volume (Billion), by Country 2025 & 2033
- Figure 81: Middle East and Africa Liquid Waste Management Industry Revenue Share (%), by Country 2025 & 2033
- Figure 82: Middle East and Africa Liquid Waste Management Industry Volume Share (%), by Country 2025 & 2033
List of Tables
- Table 1: Global Liquid Waste Management Industry Revenue Million Forecast, by Source 2020 & 2033
- Table 2: Global Liquid Waste Management Industry Volume Billion Forecast, by Source 2020 & 2033
- Table 3: Global Liquid Waste Management Industry Revenue Million Forecast, by Service 2020 & 2033
- Table 4: Global Liquid Waste Management Industry Volume Billion Forecast, by Service 2020 & 2033
- Table 5: Global Liquid Waste Management Industry Revenue Million Forecast, by End-user Industry 2020 & 2033
- Table 6: Global Liquid Waste Management Industry Volume Billion Forecast, by End-user Industry 2020 & 2033
- Table 7: Global Liquid Waste Management Industry Revenue Million Forecast, by Region 2020 & 2033
- Table 8: Global Liquid Waste Management Industry Volume Billion Forecast, by Region 2020 & 2033
- Table 9: Global Liquid Waste Management Industry Revenue Million Forecast, by Source 2020 & 2033
- Table 10: Global Liquid Waste Management Industry Volume Billion Forecast, by Source 2020 & 2033
- Table 11: Global Liquid Waste Management Industry Revenue Million Forecast, by Service 2020 & 2033
- Table 12: Global Liquid Waste Management Industry Volume Billion Forecast, by Service 2020 & 2033
- Table 13: Global Liquid Waste Management Industry Revenue Million Forecast, by End-user Industry 2020 & 2033
- Table 14: Global Liquid Waste Management Industry Volume Billion Forecast, by End-user Industry 2020 & 2033
- Table 15: Global Liquid Waste Management Industry Revenue Million Forecast, by Country 2020 & 2033
- Table 16: Global Liquid Waste Management Industry Volume Billion Forecast, by Country 2020 & 2033
- Table 17: China Liquid Waste Management Industry Revenue (Million) Forecast, by Application 2020 & 2033
- Table 18: China Liquid Waste Management Industry Volume (Billion) Forecast, by Application 2020 & 2033
- Table 19: India Liquid Waste Management Industry Revenue (Million) Forecast, by Application 2020 & 2033
- Table 20: India Liquid Waste Management Industry Volume (Billion) Forecast, by Application 2020 & 2033
- Table 21: Japan Liquid Waste Management Industry Revenue (Million) Forecast, by Application 2020 & 2033
- Table 22: Japan Liquid Waste Management Industry Volume (Billion) Forecast, by Application 2020 & 2033
- Table 23: South Korea Liquid Waste Management Industry Revenue (Million) Forecast, by Application 2020 & 2033
- Table 24: South Korea Liquid Waste Management Industry Volume (Billion) Forecast, by Application 2020 & 2033
- Table 25: Rest of Asia Pacific Liquid Waste Management Industry Revenue (Million) Forecast, by Application 2020 & 2033
- Table 26: Rest of Asia Pacific Liquid Waste Management Industry Volume (Billion) Forecast, by Application 2020 & 2033
- Table 27: Global Liquid Waste Management Industry Revenue Million Forecast, by Source 2020 & 2033
- Table 28: Global Liquid Waste Management Industry Volume Billion Forecast, by Source 2020 & 2033
- Table 29: Global Liquid Waste Management Industry Revenue Million Forecast, by Service 2020 & 2033
- Table 30: Global Liquid Waste Management Industry Volume Billion Forecast, by Service 2020 & 2033
- Table 31: Global Liquid Waste Management Industry Revenue Million Forecast, by End-user Industry 2020 & 2033
- Table 32: Global Liquid Waste Management Industry Volume Billion Forecast, by End-user Industry 2020 & 2033
- Table 33: Global Liquid Waste Management Industry Revenue Million Forecast, by Country 2020 & 2033
- Table 34: Global Liquid Waste Management Industry Volume Billion Forecast, by Country 2020 & 2033
- Table 35: United States Liquid Waste Management Industry Revenue (Million) Forecast, by Application 2020 & 2033
- Table 36: United States Liquid Waste Management Industry Volume (Billion) Forecast, by Application 2020 & 2033
- Table 37: Canada Liquid Waste Management Industry Revenue (Million) Forecast, by Application 2020 & 2033
- Table 38: Canada Liquid Waste Management Industry Volume (Billion) Forecast, by Application 2020 & 2033
- Table 39: Mexico Liquid Waste Management Industry Revenue (Million) Forecast, by Application 2020 & 2033
- Table 40: Mexico Liquid Waste Management Industry Volume (Billion) Forecast, by Application 2020 & 2033
- Table 41: Global Liquid Waste Management Industry Revenue Million Forecast, by Source 2020 & 2033
- Table 42: Global Liquid Waste Management Industry Volume Billion Forecast, by Source 2020 & 2033
- Table 43: Global Liquid Waste Management Industry Revenue Million Forecast, by Service 2020 & 2033
- Table 44: Global Liquid Waste Management Industry Volume Billion Forecast, by Service 2020 & 2033
- Table 45: Global Liquid Waste Management Industry Revenue Million Forecast, by End-user Industry 2020 & 2033
- Table 46: Global Liquid Waste Management Industry Volume Billion Forecast, by End-user Industry 2020 & 2033
- Table 47: Global Liquid Waste Management Industry Revenue Million Forecast, by Country 2020 & 2033
- Table 48: Global Liquid Waste Management Industry Volume Billion Forecast, by Country 2020 & 2033
- Table 49: Germany Liquid Waste Management Industry Revenue (Million) Forecast, by Application 2020 & 2033
- Table 50: Germany Liquid Waste Management Industry Volume (Billion) Forecast, by Application 2020 & 2033
- Table 51: United Kingdom Liquid Waste Management Industry Revenue (Million) Forecast, by Application 2020 & 2033
- Table 52: United Kingdom Liquid Waste Management Industry Volume (Billion) Forecast, by Application 2020 & 2033
- Table 53: France Liquid Waste Management Industry Revenue (Million) Forecast, by Application 2020 & 2033
- Table 54: France Liquid Waste Management Industry Volume (Billion) Forecast, by Application 2020 & 2033
- Table 55: Italy Liquid Waste Management Industry Revenue (Million) Forecast, by Application 2020 & 2033
- Table 56: Italy Liquid Waste Management Industry Volume (Billion) Forecast, by Application 2020 & 2033
- Table 57: Rest of Europe Liquid Waste Management Industry Revenue (Million) Forecast, by Application 2020 & 2033
- Table 58: Rest of Europe Liquid Waste Management Industry Volume (Billion) Forecast, by Application 2020 & 2033
- Table 59: Global Liquid Waste Management Industry Revenue Million Forecast, by Source 2020 & 2033
- Table 60: Global Liquid Waste Management Industry Volume Billion Forecast, by Source 2020 & 2033
- Table 61: Global Liquid Waste Management Industry Revenue Million Forecast, by Service 2020 & 2033
- Table 62: Global Liquid Waste Management Industry Volume Billion Forecast, by Service 2020 & 2033
- Table 63: Global Liquid Waste Management Industry Revenue Million Forecast, by End-user Industry 2020 & 2033
- Table 64: Global Liquid Waste Management Industry Volume Billion Forecast, by End-user Industry 2020 & 2033
- Table 65: Global Liquid Waste Management Industry Revenue Million Forecast, by Country 2020 & 2033
- Table 66: Global Liquid Waste Management Industry Volume Billion Forecast, by Country 2020 & 2033
- Table 67: Brazil Liquid Waste Management Industry Revenue (Million) Forecast, by Application 2020 & 2033
- Table 68: Brazil Liquid Waste Management Industry Volume (Billion) Forecast, by Application 2020 & 2033
- Table 69: Argentina Liquid Waste Management Industry Revenue (Million) Forecast, by Application 2020 & 2033
- Table 70: Argentina Liquid Waste Management Industry Volume (Billion) Forecast, by Application 2020 & 2033
- Table 71: Rest of South America Liquid Waste Management Industry Revenue (Million) Forecast, by Application 2020 & 2033
- Table 72: Rest of South America Liquid Waste Management Industry Volume (Billion) Forecast, by Application 2020 & 2033
- Table 73: Global Liquid Waste Management Industry Revenue Million Forecast, by Source 2020 & 2033
- Table 74: Global Liquid Waste Management Industry Volume Billion Forecast, by Source 2020 & 2033
- Table 75: Global Liquid Waste Management Industry Revenue Million Forecast, by Service 2020 & 2033
- Table 76: Global Liquid Waste Management Industry Volume Billion Forecast, by Service 2020 & 2033
- Table 77: Global Liquid Waste Management Industry Revenue Million Forecast, by End-user Industry 2020 & 2033
- Table 78: Global Liquid Waste Management Industry Volume Billion Forecast, by End-user Industry 2020 & 2033
- Table 79: Global Liquid Waste Management Industry Revenue Million Forecast, by Country 2020 & 2033
- Table 80: Global Liquid Waste Management Industry Volume Billion Forecast, by Country 2020 & 2033
- Table 81: Saudi Arabia Liquid Waste Management Industry Revenue (Million) Forecast, by Application 2020 & 2033
- Table 82: Saudi Arabia Liquid Waste Management Industry Volume (Billion) Forecast, by Application 2020 & 2033
- Table 83: South Africa Liquid Waste Management Industry Revenue (Million) Forecast, by Application 2020 & 2033
- Table 84: South Africa Liquid Waste Management Industry Volume (Billion) Forecast, by Application 2020 & 2033
- Table 85: Rest of Middle East and Africa Liquid Waste Management Industry Revenue (Million) Forecast, by Application 2020 & 2033
- Table 86: Rest of Middle East and Africa Liquid Waste Management Industry Volume (Billion) Forecast, by Application 2020 & 2033
Frequently Asked Questions
1. What is the projected Compound Annual Growth Rate (CAGR) of the Liquid Waste Management Industry?
The projected CAGR is approximately > 4.00%.
2. Which companies are prominent players in the Liquid Waste Management Industry?
Key companies in the market include CLEAN HARBORS INC, Cleanaway, Covanta Holding Corporation, Enva, GFL Environmental Inc, Hulsey (a Blue Flow Company), Ovivo, REMONDIS SE & Co KG, SUEZ, Veolia, WM Intellectual Property Holdings L L C *List Not Exhaustive.
3. What are the main segments of the Liquid Waste Management Industry?
The market segments include Source, Service, End-user Industry.
4. Can you provide details about the market size?
The market size is estimated to be USD 89.29 Million as of 2022.
5. What are some drivers contributing to market growth?
Growth in the Pharmaceutical and Healthcare Industry; Increased Manufacturing Activities Containing Toxic Chemicals Leading to Growing Liquid Effluent Management; Other Drivers.
6. What are the notable trends driving market growth?
Oil and Gas Segment to Dominate the Market.
7. Are there any restraints impacting market growth?
Growth in the Pharmaceutical and Healthcare Industry; Increased Manufacturing Activities Containing Toxic Chemicals Leading to Growing Liquid Effluent Management; Other Drivers.
8. Can you provide examples of recent developments in the market?
October 2023: SUEZ Recycling and Recovery UK completed the acquisition of Devon Contract Waste (DCW), a prominent recycling and waste management company. This strategic move is aimed at enhancing SUEZ's global position within the waste sector.
9. What pricing options are available for accessing the report?
Pricing options include single-user, multi-user, and enterprise licenses priced at USD 4750, USD 5250, and USD 8750 respectively.
10. Is the market size provided in terms of value or volume?
The market size is provided in terms of value, measured in Million and volume, measured in Billion.
11. Are there any specific market keywords associated with the report?
Yes, the market keyword associated with the report is "Liquid Waste Management Industry," which aids in identifying and referencing the specific market segment covered.
12. How do I determine which pricing option suits my needs best?
The pricing options vary based on user requirements and access needs. Individual users may opt for single-user licenses, while businesses requiring broader access may choose multi-user or enterprise licenses for cost-effective access to the report.
13. Are there any additional resources or data provided in the Liquid Waste Management Industry report?
While the report offers comprehensive insights, it's advisable to review the specific contents or supplementary materials provided to ascertain if additional resources or data are available.
14. How can I stay updated on further developments or reports in the Liquid Waste Management Industry?
To stay informed about further developments, trends, and reports in the Liquid Waste Management Industry, consider subscribing to industry newsletters, following relevant companies and organizations, or regularly checking reputable industry news sources and publications.
Methodology
Step 1 - Identification of Relevant Samples Size from Population Database


Step 2 - Approaches for Defining Global Market Size (Value, Volume* & Price*)

Note*: In applicable scenarios
Step 3 - Data Sources
Primary Research
- Web Analytics
- Survey Reports
- Research Institute
- Latest Research Reports
- Opinion Leaders
Secondary Research
- Annual Reports
- White Paper
- Latest Press Release
- Industry Association
- Paid Database
- Investor Presentations

Step 4 - Data Triangulation
Involves using different sources of information in order to increase the validity of a study
These sources are likely to be stakeholders in a program - participants, other researchers, program staff, other community members, and so on.
Then we put all data in single framework & apply various statistical tools to find out the dynamic on the market.
During the analysis stage, feedback from the stakeholder groups would be compared to determine areas of agreement as well as areas of divergence

