

Key Insights
The global Logic Burn-In Board market is projected for significant expansion, expected to reach $180.29 million by 2025, with a Compound Annual Growth Rate (CAGR) of 8.18% through 2033. This growth is driven by the increasing demand for high-reliability semiconductor components across industries. The complexity of integrated circuits and stringent quality demands necessitate advanced burn-in testing for defect detection and long-term performance assurance. Key growth factors include the expanding automotive sector, consumer electronics, 5G infrastructure, and the Internet of Things (IoT), all requiring dependable semiconductor performance. Manufacturers' focus on product longevity and reduced failure rates further fuels the adoption of burn-in testing solutions.
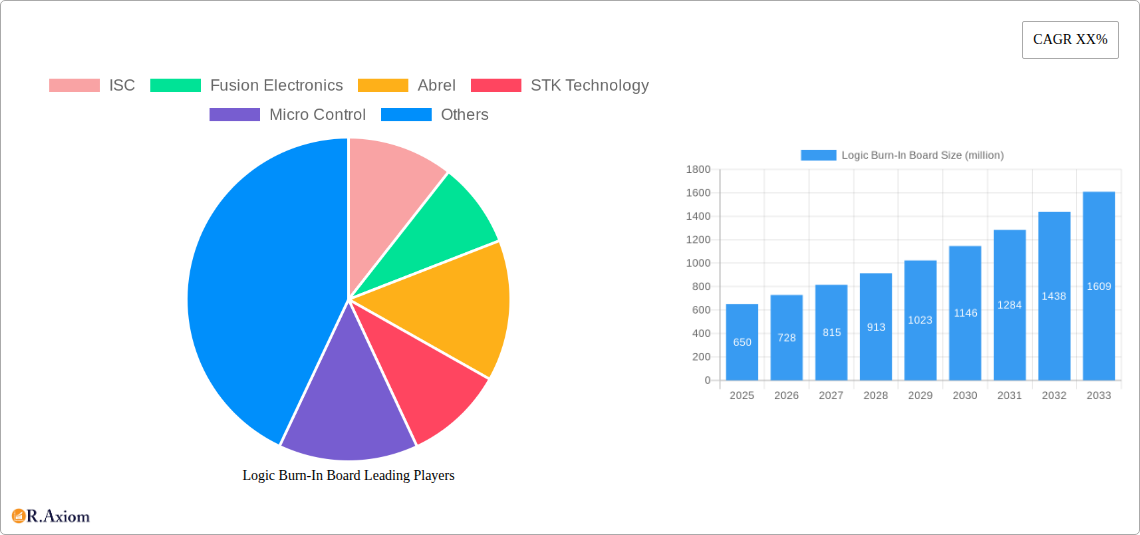
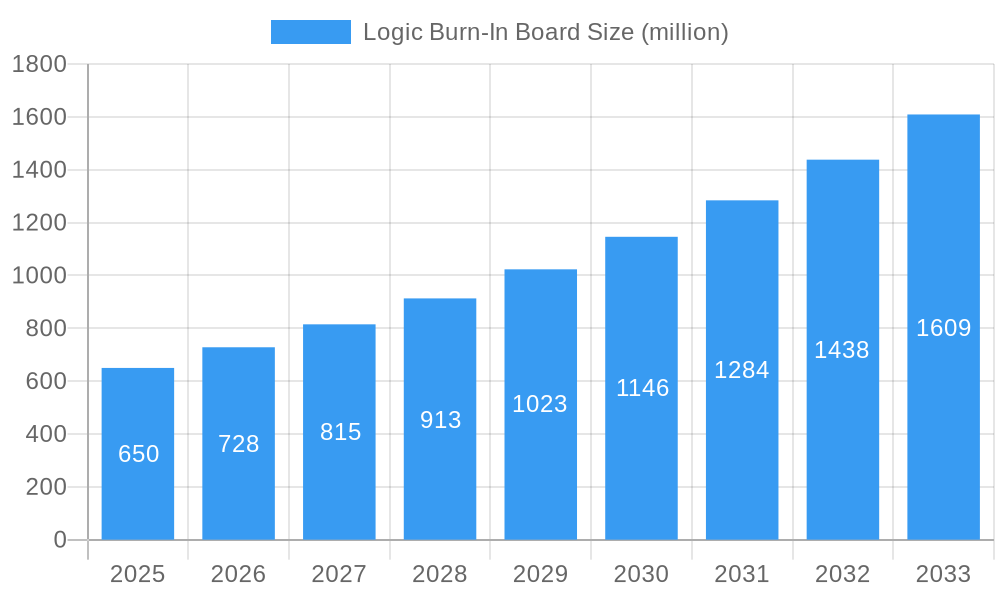
Logic Burn-In Board Market Size (In Million)
The market is segmented by application, with Integrated Circuits leading, followed by Discrete Devices, Optoelectronic Devices, and Others. Both Universal and Dedicated Burn-In Boards are vital, addressing varied production volumes and specialized testing requirements. Geographically, the Asia Pacific region, particularly China, is anticipated to be the largest and fastest-growing market due to its substantial semiconductor manufacturing base and investments in advanced electronics. North America and Europe are established markets supported by their automotive and technology sectors. Leading companies such as ISC, Fusion Electronics, and STK Technology are innovating to provide efficient, scalable, and cost-effective burn-in solutions for evolving semiconductor testing needs.
Logic Burn-In Board Company Market Share
Logic Burn-In Board Market Concentration & Innovation
The global logic burn-in board market is characterized by a moderate level of concentration, with a few key players holding significant market share. The innovation landscape is driven by the increasing complexity and miniaturization of semiconductor devices, demanding more sophisticated burn-in solutions. Companies like ISC, Fusion Electronics, and Abrel are at the forefront of developing advanced burn-in boards capable of handling higher power densities and more intricate testing protocols. Regulatory frameworks, primarily driven by stringent quality control standards in the automotive and aerospace industries, are pushing manufacturers to adopt more rigorous testing methods, thereby fueling demand for high-performance burn-in boards. Product substitutes, such as in-system testing and advanced simulation techniques, pose a growing challenge, though they are yet to fully replicate the comprehensive stress-testing capabilities of burn-in. End-user trends highlight a growing preference for customized and highly integrated burn-in solutions tailored to specific device types and failure analysis needs. Mergers and acquisitions (M&A) activity is expected to increase as larger players seek to consolidate their market position and acquire specialized technological capabilities. Deal values are projected to range from a few million to several hundred million dollars as companies strategically expand their portfolios and geographical reach.
Key Innovation Drivers:
- Semiconductor Miniaturization and Complexity: Advanced packaging techniques and smaller transistor sizes require precise and reliable burn-in processes.
- Stringent Quality & Reliability Standards: Industries like automotive, aerospace, and medical demand the highest levels of semiconductor reliability, necessitating thorough burn-in.
- High-Volume Manufacturing Demands: The need for efficient and high-throughput burn-in solutions for mass production drives innovation in board design and automation.
- Data Analytics and AI in Testing: Integration of data analytics and AI for predictive failure analysis and optimization of burn-in cycles.
M&A Activity Projections:
- Strategic Acquisitions: Focus on acquiring niche technology providers and companies with strong customer relationships.
- Consolidation: Larger players aiming to increase market share and achieve economies of scale.
- Deal Valuations: Anticipated deal values to range from approximately 10 million to 500 million dollars, depending on strategic fit and market impact.
Logic Burn-In Board Industry Trends & Insights
The logic burn-in board industry is experiencing robust growth, projected to expand at a compound annual growth rate (CAGR) of approximately 7.2% from 2019 to 2033. This sustained expansion is primarily attributed to the relentless demand for high-reliability semiconductors across a multitude of burgeoning industries. The increasing adoption of logic integrated circuits (ICs) in automotive electronics, driven by the proliferation of advanced driver-assistance systems (ADAS), electric vehicles (EVs), and in-car infotainment, is a significant market penetration driver. Similarly, the surge in IoT devices, smart wearables, and 5G infrastructure deployment necessitates the rigorous testing of discrete and optoelectronic devices, further boosting the market. Technological advancements in semiconductor manufacturing, including wafer-level burn-in and the development of high-density interconnect (HDI) boards, are enabling more efficient and cost-effective burn-in processes. Consumer preferences are leaning towards smaller, more powerful, and energy-efficient electronic devices, which in turn, places a premium on the reliability of the underlying semiconductor components, directly translating to increased demand for advanced burn-in solutions. Competitive dynamics are intensifying, with established players continuously investing in research and development to offer innovative solutions that cater to evolving technological requirements. The market penetration for logic burn-in boards is currently estimated at around 70% across key semiconductor manufacturing hubs, with significant room for growth in emerging economies. The integration of AI and machine learning in burn-in testing, for optimizing test parameters and predicting potential failures, represents a significant disruptive trend that promises to enhance efficiency and reduce testing costs. The ongoing shift towards specialized burn-in boards, designed for specific device types and applications, is another key trend shaping the industry, allowing for more targeted and effective reliability testing. The overall market size is projected to reach over 200 million dollars by 2025, with a steady upward trajectory expected throughout the forecast period.
Dominant Markets & Segments in Logic Burn-In Board
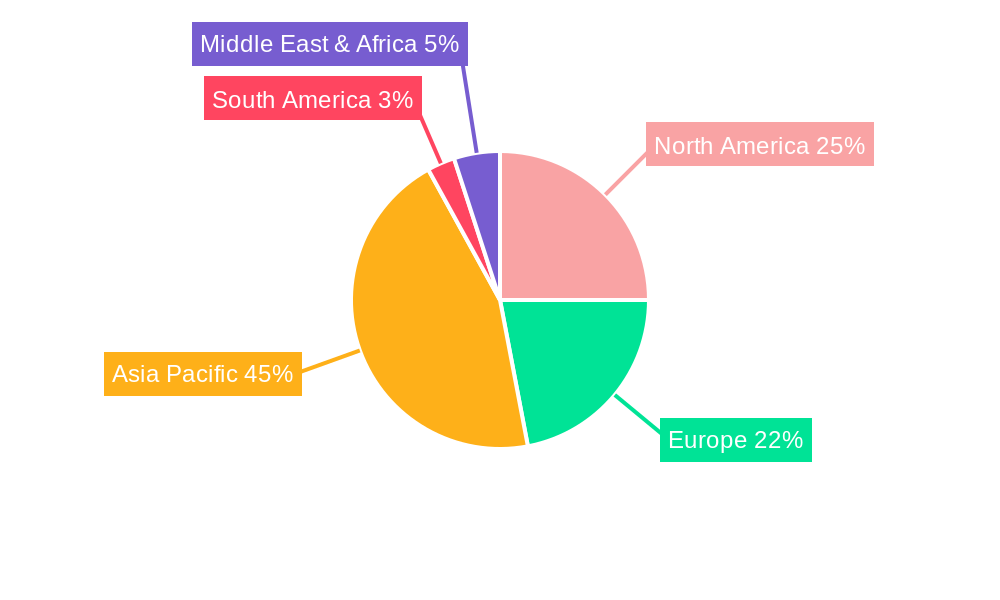
The logic burn-in board market exhibits distinct regional dominance and segmentation patterns, driven by robust semiconductor manufacturing ecosystems and specific application demands. North America and Asia Pacific are identified as the leading regions, primarily due to the concentrated presence of major semiconductor manufacturers and advanced electronics industries in countries like the United States, South Korea, Taiwan, and China. The economic policies in these regions, often favoring technological innovation and manufacturing, coupled with substantial investments in R&D infrastructure, create a fertile ground for the widespread adoption of logic burn-in boards.
Dominance Analysis by Application:
- Integrated Circuits (ICs): This segment holds the largest market share, estimated to be over 60% of the total logic burn-in board market. The ever-increasing complexity and volume of ICs used in consumer electronics, automotive, telecommunications, and computing applications necessitate comprehensive burn-in testing to ensure their reliability and longevity. Economic growth in developing nations is significantly boosting the demand for consumer electronics, which in turn drives IC production and the need for burn-in boards.
- Discrete Devices: While smaller than the IC segment, discrete devices constitute a significant portion, approximately 20%, of the market. Their use in power management, signal amplification, and other fundamental electronic functions across various industries, from industrial automation to renewable energy, underscores their importance and the need for reliable burn-in. Infrastructure development in emerging economies is a key driver for this segment.
- Optoelectronic Devices: This segment, estimated at around 15% of the market, includes devices like LEDs, laser diodes, and photodetectors. The rapid growth in display technologies, solid-state lighting, optical communication, and advanced sensors fuels the demand for high-quality optoelectronic components, making their burn-in a critical step. Technological advancements in these areas are continually pushing the boundaries of required testing.
- Others: The remaining 5% encompasses specialized devices and emerging technologies where logic burn-in is applied. This segment, though smaller, represents a dynamic area of growth, driven by novel applications in areas like quantum computing and advanced medical devices.
Dominance Analysis by Type:
- Dedicated Burn-In Boards: These boards are highly specialized, designed for a specific device or a narrow range of devices. They offer optimal performance, higher test densities, and faster test times. Their dominance is rooted in the high-volume production of specific semiconductor types where customization leads to significant efficiency gains and cost reductions. This segment is estimated to hold approximately 75% of the market.
- Universal Burn-In Boards: These boards are more versatile, designed to accommodate a wider variety of devices with interchangeable sockets and configurations. They are ideal for R&D, low-volume production, and testing diverse product portfolios. While less efficient for mass production of a single device type, their flexibility makes them crucial for adaptability in dynamic market environments. This segment accounts for around 25% of the market.
Logic Burn-In Board Product Developments
Recent product developments in the logic burn-in board market are focused on enhancing test efficiency, supporting higher power densities, and enabling advanced failure analysis. Manufacturers are introducing modular designs for increased flexibility and reduced downtime, alongside advancements in thermal management to handle increasingly power-hungry devices. The integration of high-speed data acquisition capabilities and intelligent diagnostic features are key technological trends, allowing for more precise identification of potential defects. These innovations offer competitive advantages by providing semiconductor manufacturers with more reliable, cost-effective, and quicker validation of their components, thereby improving time-to-market and overall product quality.
Report Scope & Segmentation Analysis
This report provides a comprehensive analysis of the global logic burn-in board market, segmented by Application and Type.
- Application Segmentation: The market is divided into Integrated Circuit (IC), Discrete Device, Optoelectronic Device, and Others. The IC segment is projected to exhibit the highest growth due to the pervasive use of logic ICs across industries. Discrete devices and optoelectronic devices also represent substantial markets, driven by their specific application demands. The "Others" segment, though smaller, signifies emerging technological frontiers.
- Type Segmentation: The market is further segmented into Universal Burn-In Boards and Dedicated Burn-In Boards. Dedicated burn-in boards are expected to dominate in terms of market share due to their optimized performance in high-volume manufacturing scenarios. Universal burn-in boards will continue to hold a significant position, catering to R&D and diverse testing needs.
Key Drivers of Logic Burn-In Board Growth
The growth of the logic burn-in board market is propelled by several key factors. Primarily, the escalating demand for high-reliability semiconductors across sectors like automotive, consumer electronics, and telecommunications is paramount. The increasing complexity and miniaturization of semiconductor devices necessitate rigorous burn-in testing to ensure their long-term performance and prevent costly field failures. Furthermore, stringent quality control regulations and standards imposed by governing bodies and industry consortia worldwide are compelling manufacturers to invest in advanced burn-in solutions. Technological advancements in semiconductor fabrication, leading to higher power densities and new device architectures, also drive the need for more sophisticated burn-in boards. Economic growth and increasing disposable incomes in emerging economies are fueling the demand for consumer electronics, thereby indirectly boosting the need for semiconductor testing.
Challenges in the Logic Burn-In Board Sector
Despite the positive growth trajectory, the logic burn-in board sector faces several challenges. The ever-increasing pace of technological innovation in semiconductor design often leads to a demand for burn-in solutions that outpace current manufacturing capabilities, creating a constant need for R&D investment. Regulatory hurdles, while driving quality, can also impose complex compliance requirements that add to development and testing costs. Supply chain disruptions, particularly for specialized components and materials, can impact production timelines and costs. Intense competition among market players also puts pressure on pricing and profit margins. Furthermore, the development of advanced simulation and in-system testing techniques presents a potential threat, though they are yet to fully replace the comprehensive stress testing provided by burn-in boards.
Emerging Opportunities in Logic Burn-In Board
Emerging opportunities in the logic burn-in board market lie in several key areas. The rapid expansion of the Internet of Things (IoT) ecosystem, with its vast array of connected devices, presents a significant growth avenue, requiring specialized burn-in solutions for diverse sensor and processing components. The increasing adoption of AI and machine learning in semiconductor testing offers opportunities for developing intelligent burn-in systems that optimize test parameters and predict potential failures proactively. The growing demand for automotive electronics, especially in the realm of autonomous driving and electric vehicles, is a major catalyst for advanced and high-reliability burn-in boards. Furthermore, the development of new semiconductor materials and advanced packaging technologies will create demand for bespoke burn-in solutions. Geographic expansion into emerging semiconductor manufacturing hubs also presents considerable untapped potential.
Leading Players in the Logic Burn-In Board Market
- ISC
- Fusion Electronics
- Abrel
- STK Technology
- Micro Control
- Trio-Tech International
- EDA Industries
- Loranger International
- KES Systems
- Sunright Limited
- Guangzhou FastPrint Circuit Tech
- Keystone Microtech Corporation
Key Developments in Logic Burn-In Board Industry
- 2023/07: Launch of next-generation universal burn-in boards with enhanced socket density and improved thermal management capabilities by Fusion Electronics.
- 2023/05: Abrel announces strategic partnership with a leading automotive semiconductor manufacturer to develop customized dedicated burn-in boards for ADAS applications.
- 2023/03: STK Technology introduces AI-powered burn-in optimization software, leading to reduced test times and improved failure detection for logic ICs.
- 2023/01: Micro Control expands its manufacturing facility to meet the growing demand for high-volume burn-in board production.
- 2022/11: Trio-Tech International showcases advanced burn-in solutions for high-power optoelectronic devices at a major industry exhibition.
- 2022/09: EDA Industries acquires a smaller competitor to strengthen its market position in the discrete device burn-in segment.
- 2022/07: Loranger International releases a new series of burn-in boards designed for the emerging quantum computing market.
- 2022/05: KES Systems announces significant investment in R&D for next-generation burn-in technologies.
- 2022/03: Sunright Limited establishes a new sales and support office in Southeast Asia to cater to the growing regional demand.
- 2022/01: Guangzhou FastPrint Circuit Tech expands its product portfolio with the introduction of specialized burn-in boards for advanced sensor applications.
- 2021/11: Keystone Microtech Corporation highlights its expertise in complex PCB manufacturing for high-density logic burn-in boards.
Strategic Outlook for Logic Burn-In Board Market
The strategic outlook for the logic burn-in board market remains highly positive, driven by continuous innovation and expanding application areas. The market's growth will be further catalyzed by the increasing demand for semiconductors in nascent technologies like 6G, advanced AI hardware, and next-generation computing platforms. Strategic collaborations between burn-in board manufacturers and semiconductor foundries will be crucial for co-developing optimized testing solutions. Investments in automation and smart manufacturing processes for burn-in boards will enhance efficiency and reduce lead times. Furthermore, the growing emphasis on sustainability in the electronics industry will likely drive demand for eco-friendly manufacturing practices in burn-in board production. Companies that can adapt to rapidly evolving semiconductor technologies and offer tailored, high-performance solutions will be well-positioned for sustained success.
Logic Burn-In Board Segmentation
-
1. Application
- 1.1. Integrated Circuit
- 1.2. Discrete Device
- 1.3. Optoelectronic Device
- 1.4. Others
-
2. Types
- 2.1. Universal Burn-In Boards
- 2.2. Dedicated Burn-In Boards
Logic Burn-In Board Segmentation By Geography
-
1. North America
- 1.1. United States
- 1.2. Canada
- 1.3. Mexico
-
2. South America
- 2.1. Brazil
- 2.2. Argentina
- 2.3. Rest of South America
-
3. Europe
- 3.1. United Kingdom
- 3.2. Germany
- 3.3. France
- 3.4. Italy
- 3.5. Spain
- 3.6. Russia
- 3.7. Benelux
- 3.8. Nordics
- 3.9. Rest of Europe
-
4. Middle East & Africa
- 4.1. Turkey
- 4.2. Israel
- 4.3. GCC
- 4.4. North Africa
- 4.5. South Africa
- 4.6. Rest of Middle East & Africa
-
5. Asia Pacific
- 5.1. China
- 5.2. India
- 5.3. Japan
- 5.4. South Korea
- 5.5. ASEAN
- 5.6. Oceania
- 5.7. Rest of Asia Pacific
Logic Burn-In Board Regional Market Share
Geographic Coverage of Logic Burn-In Board
Logic Burn-In Board REPORT HIGHLIGHTS
| Aspects | Details |
|---|---|
| Study Period | 2020-2034 |
| Base Year | 2025 |
| Estimated Year | 2026 |
| Forecast Period | 2026-2034 |
| Historical Period | 2020-2025 |
| Growth Rate | CAGR of 8.18% from 2020-2034 |
| Segmentation |
|
Table of Contents
- 1. Introduction
- 1.1. Research Scope
- 1.2. Market Segmentation
- 1.3. Research Objective
- 1.4. Definitions and Assumptions
- 2. Executive Summary
- 2.1. Market Snapshot
- 3. Market Dynamics
- 3.1. Market Drivers
- 3.2. Market Restrains
- 3.3. Market Trends
- 3.4. Market Opportunities
- 4. Market Factor Analysis
- 4.1. Porters Five Forces
- 4.1.1. Bargaining Power of Suppliers
- 4.1.2. Bargaining Power of Buyers
- 4.1.3. Threat of New Entrants
- 4.1.4. Threat of Substitutes
- 4.1.5. Competitive Rivalry
- 4.2. PESTEL analysis
- 4.3. BCG Analysis
- 4.3.1. Stars (High Growth, High Market Share)
- 4.3.2. Cash Cows (Low Growth, High Market Share)
- 4.3.3. Question Mark (High Growth, Low Market Share)
- 4.3.4. Dogs (Low Growth, Low Market Share)
- 4.4. Ansoff Matrix Analysis
- 4.5. Supply Chain Analysis
- 4.6. Regulatory Landscape
- 4.7. Current Market Potential and Opportunity Assessment (TAM–SAM–SOM Framework)
- 4.8. RAX Analyst Note
- 4.1. Porters Five Forces
- 5. Market Analysis, Insights and Forecast 2021-2033
- 5.1. Market Analysis, Insights and Forecast - by Application
- 5.1.1. Integrated Circuit
- 5.1.2. Discrete Device
- 5.1.3. Optoelectronic Device
- 5.1.4. Others
- 5.2. Market Analysis, Insights and Forecast - by Types
- 5.2.1. Universal Burn-In Boards
- 5.2.2. Dedicated Burn-In Boards
- 5.3. Market Analysis, Insights and Forecast - by Region
- 5.3.1. North America
- 5.3.2. South America
- 5.3.3. Europe
- 5.3.4. Middle East & Africa
- 5.3.5. Asia Pacific
- 5.1. Market Analysis, Insights and Forecast - by Application
- 6. Global Logic Burn-In Board Analysis, Insights and Forecast, 2021-2033
- 6.1. Market Analysis, Insights and Forecast - by Application
- 6.1.1. Integrated Circuit
- 6.1.2. Discrete Device
- 6.1.3. Optoelectronic Device
- 6.1.4. Others
- 6.2. Market Analysis, Insights and Forecast - by Types
- 6.2.1. Universal Burn-In Boards
- 6.2.2. Dedicated Burn-In Boards
- 6.1. Market Analysis, Insights and Forecast - by Application
- 7. North America Logic Burn-In Board Analysis, Insights and Forecast, 2020-2032
- 7.1. Market Analysis, Insights and Forecast - by Application
- 7.1.1. Integrated Circuit
- 7.1.2. Discrete Device
- 7.1.3. Optoelectronic Device
- 7.1.4. Others
- 7.2. Market Analysis, Insights and Forecast - by Types
- 7.2.1. Universal Burn-In Boards
- 7.2.2. Dedicated Burn-In Boards
- 7.1. Market Analysis, Insights and Forecast - by Application
- 8. South America Logic Burn-In Board Analysis, Insights and Forecast, 2020-2032
- 8.1. Market Analysis, Insights and Forecast - by Application
- 8.1.1. Integrated Circuit
- 8.1.2. Discrete Device
- 8.1.3. Optoelectronic Device
- 8.1.4. Others
- 8.2. Market Analysis, Insights and Forecast - by Types
- 8.2.1. Universal Burn-In Boards
- 8.2.2. Dedicated Burn-In Boards
- 8.1. Market Analysis, Insights and Forecast - by Application
- 9. Europe Logic Burn-In Board Analysis, Insights and Forecast, 2020-2032
- 9.1. Market Analysis, Insights and Forecast - by Application
- 9.1.1. Integrated Circuit
- 9.1.2. Discrete Device
- 9.1.3. Optoelectronic Device
- 9.1.4. Others
- 9.2. Market Analysis, Insights and Forecast - by Types
- 9.2.1. Universal Burn-In Boards
- 9.2.2. Dedicated Burn-In Boards
- 9.1. Market Analysis, Insights and Forecast - by Application
- 10. Middle East & Africa Logic Burn-In Board Analysis, Insights and Forecast, 2020-2032
- 10.1. Market Analysis, Insights and Forecast - by Application
- 10.1.1. Integrated Circuit
- 10.1.2. Discrete Device
- 10.1.3. Optoelectronic Device
- 10.1.4. Others
- 10.2. Market Analysis, Insights and Forecast - by Types
- 10.2.1. Universal Burn-In Boards
- 10.2.2. Dedicated Burn-In Boards
- 10.1. Market Analysis, Insights and Forecast - by Application
- 11. Asia Pacific Logic Burn-In Board Analysis, Insights and Forecast, 2020-2032
- 11.1. Market Analysis, Insights and Forecast - by Application
- 11.1.1. Integrated Circuit
- 11.1.2. Discrete Device
- 11.1.3. Optoelectronic Device
- 11.1.4. Others
- 11.2. Market Analysis, Insights and Forecast - by Types
- 11.2.1. Universal Burn-In Boards
- 11.2.2. Dedicated Burn-In Boards
- 11.1. Market Analysis, Insights and Forecast - by Application
- 12. Competitive Analysis
- 12.1. Company Profiles
- 12.1.1 ISC
- 12.1.1.1. Company Overview
- 12.1.1.2. Products
- 12.1.1.3. Company Financials
- 12.1.1.4. SWOT Analysis
- 12.1.2 Fusion Electronics
- 12.1.2.1. Company Overview
- 12.1.2.2. Products
- 12.1.2.3. Company Financials
- 12.1.2.4. SWOT Analysis
- 12.1.3 Abrel
- 12.1.3.1. Company Overview
- 12.1.3.2. Products
- 12.1.3.3. Company Financials
- 12.1.3.4. SWOT Analysis
- 12.1.4 STK Technology
- 12.1.4.1. Company Overview
- 12.1.4.2. Products
- 12.1.4.3. Company Financials
- 12.1.4.4. SWOT Analysis
- 12.1.5 Micro Control
- 12.1.5.1. Company Overview
- 12.1.5.2. Products
- 12.1.5.3. Company Financials
- 12.1.5.4. SWOT Analysis
- 12.1.6 Trio-Tech International
- 12.1.6.1. Company Overview
- 12.1.6.2. Products
- 12.1.6.3. Company Financials
- 12.1.6.4. SWOT Analysis
- 12.1.7 EDA Industries
- 12.1.7.1. Company Overview
- 12.1.7.2. Products
- 12.1.7.3. Company Financials
- 12.1.7.4. SWOT Analysis
- 12.1.8 Loranger International
- 12.1.8.1. Company Overview
- 12.1.8.2. Products
- 12.1.8.3. Company Financials
- 12.1.8.4. SWOT Analysis
- 12.1.9 KES Systems
- 12.1.9.1. Company Overview
- 12.1.9.2. Products
- 12.1.9.3. Company Financials
- 12.1.9.4. SWOT Analysis
- 12.1.10 Sunright Limited
- 12.1.10.1. Company Overview
- 12.1.10.2. Products
- 12.1.10.3. Company Financials
- 12.1.10.4. SWOT Analysis
- 12.1.11 Guangzhou FastPrint Circuit Tech
- 12.1.11.1. Company Overview
- 12.1.11.2. Products
- 12.1.11.3. Company Financials
- 12.1.11.4. SWOT Analysis
- 12.1.12 Keystone Microtech Corporation
- 12.1.12.1. Company Overview
- 12.1.12.2. Products
- 12.1.12.3. Company Financials
- 12.1.12.4. SWOT Analysis
- 12.1.1 ISC
- 12.2. Market Entropy
- 12.2.1 Company's Key Areas Served
- 12.2.2 Recent Developments
- 12.3. Company Market Share Analysis 2025
- 12.3.1 Top 5 Companies Market Share Analysis
- 12.3.2 Top 3 Companies Market Share Analysis
- 12.4. List of Potential Customers
- 13. Research Methodology
List of Figures
- Figure 1: Global Logic Burn-In Board Revenue Breakdown (million, %) by Region 2025 & 2033
- Figure 2: North America Logic Burn-In Board Revenue (million), by Application 2025 & 2033
- Figure 3: North America Logic Burn-In Board Revenue Share (%), by Application 2025 & 2033
- Figure 4: North America Logic Burn-In Board Revenue (million), by Types 2025 & 2033
- Figure 5: North America Logic Burn-In Board Revenue Share (%), by Types 2025 & 2033
- Figure 6: North America Logic Burn-In Board Revenue (million), by Country 2025 & 2033
- Figure 7: North America Logic Burn-In Board Revenue Share (%), by Country 2025 & 2033
- Figure 8: South America Logic Burn-In Board Revenue (million), by Application 2025 & 2033
- Figure 9: South America Logic Burn-In Board Revenue Share (%), by Application 2025 & 2033
- Figure 10: South America Logic Burn-In Board Revenue (million), by Types 2025 & 2033
- Figure 11: South America Logic Burn-In Board Revenue Share (%), by Types 2025 & 2033
- Figure 12: South America Logic Burn-In Board Revenue (million), by Country 2025 & 2033
- Figure 13: South America Logic Burn-In Board Revenue Share (%), by Country 2025 & 2033
- Figure 14: Europe Logic Burn-In Board Revenue (million), by Application 2025 & 2033
- Figure 15: Europe Logic Burn-In Board Revenue Share (%), by Application 2025 & 2033
- Figure 16: Europe Logic Burn-In Board Revenue (million), by Types 2025 & 2033
- Figure 17: Europe Logic Burn-In Board Revenue Share (%), by Types 2025 & 2033
- Figure 18: Europe Logic Burn-In Board Revenue (million), by Country 2025 & 2033
- Figure 19: Europe Logic Burn-In Board Revenue Share (%), by Country 2025 & 2033
- Figure 20: Middle East & Africa Logic Burn-In Board Revenue (million), by Application 2025 & 2033
- Figure 21: Middle East & Africa Logic Burn-In Board Revenue Share (%), by Application 2025 & 2033
- Figure 22: Middle East & Africa Logic Burn-In Board Revenue (million), by Types 2025 & 2033
- Figure 23: Middle East & Africa Logic Burn-In Board Revenue Share (%), by Types 2025 & 2033
- Figure 24: Middle East & Africa Logic Burn-In Board Revenue (million), by Country 2025 & 2033
- Figure 25: Middle East & Africa Logic Burn-In Board Revenue Share (%), by Country 2025 & 2033
- Figure 26: Asia Pacific Logic Burn-In Board Revenue (million), by Application 2025 & 2033
- Figure 27: Asia Pacific Logic Burn-In Board Revenue Share (%), by Application 2025 & 2033
- Figure 28: Asia Pacific Logic Burn-In Board Revenue (million), by Types 2025 & 2033
- Figure 29: Asia Pacific Logic Burn-In Board Revenue Share (%), by Types 2025 & 2033
- Figure 30: Asia Pacific Logic Burn-In Board Revenue (million), by Country 2025 & 2033
- Figure 31: Asia Pacific Logic Burn-In Board Revenue Share (%), by Country 2025 & 2033
List of Tables
- Table 1: Global Logic Burn-In Board Revenue million Forecast, by Application 2020 & 2033
- Table 2: Global Logic Burn-In Board Revenue million Forecast, by Types 2020 & 2033
- Table 3: Global Logic Burn-In Board Revenue million Forecast, by Region 2020 & 2033
- Table 4: Global Logic Burn-In Board Revenue million Forecast, by Application 2020 & 2033
- Table 5: Global Logic Burn-In Board Revenue million Forecast, by Types 2020 & 2033
- Table 6: Global Logic Burn-In Board Revenue million Forecast, by Country 2020 & 2033
- Table 7: United States Logic Burn-In Board Revenue (million) Forecast, by Application 2020 & 2033
- Table 8: Canada Logic Burn-In Board Revenue (million) Forecast, by Application 2020 & 2033
- Table 9: Mexico Logic Burn-In Board Revenue (million) Forecast, by Application 2020 & 2033
- Table 10: Global Logic Burn-In Board Revenue million Forecast, by Application 2020 & 2033
- Table 11: Global Logic Burn-In Board Revenue million Forecast, by Types 2020 & 2033
- Table 12: Global Logic Burn-In Board Revenue million Forecast, by Country 2020 & 2033
- Table 13: Brazil Logic Burn-In Board Revenue (million) Forecast, by Application 2020 & 2033
- Table 14: Argentina Logic Burn-In Board Revenue (million) Forecast, by Application 2020 & 2033
- Table 15: Rest of South America Logic Burn-In Board Revenue (million) Forecast, by Application 2020 & 2033
- Table 16: Global Logic Burn-In Board Revenue million Forecast, by Application 2020 & 2033
- Table 17: Global Logic Burn-In Board Revenue million Forecast, by Types 2020 & 2033
- Table 18: Global Logic Burn-In Board Revenue million Forecast, by Country 2020 & 2033
- Table 19: United Kingdom Logic Burn-In Board Revenue (million) Forecast, by Application 2020 & 2033
- Table 20: Germany Logic Burn-In Board Revenue (million) Forecast, by Application 2020 & 2033
- Table 21: France Logic Burn-In Board Revenue (million) Forecast, by Application 2020 & 2033
- Table 22: Italy Logic Burn-In Board Revenue (million) Forecast, by Application 2020 & 2033
- Table 23: Spain Logic Burn-In Board Revenue (million) Forecast, by Application 2020 & 2033
- Table 24: Russia Logic Burn-In Board Revenue (million) Forecast, by Application 2020 & 2033
- Table 25: Benelux Logic Burn-In Board Revenue (million) Forecast, by Application 2020 & 2033
- Table 26: Nordics Logic Burn-In Board Revenue (million) Forecast, by Application 2020 & 2033
- Table 27: Rest of Europe Logic Burn-In Board Revenue (million) Forecast, by Application 2020 & 2033
- Table 28: Global Logic Burn-In Board Revenue million Forecast, by Application 2020 & 2033
- Table 29: Global Logic Burn-In Board Revenue million Forecast, by Types 2020 & 2033
- Table 30: Global Logic Burn-In Board Revenue million Forecast, by Country 2020 & 2033
- Table 31: Turkey Logic Burn-In Board Revenue (million) Forecast, by Application 2020 & 2033
- Table 32: Israel Logic Burn-In Board Revenue (million) Forecast, by Application 2020 & 2033
- Table 33: GCC Logic Burn-In Board Revenue (million) Forecast, by Application 2020 & 2033
- Table 34: North Africa Logic Burn-In Board Revenue (million) Forecast, by Application 2020 & 2033
- Table 35: South Africa Logic Burn-In Board Revenue (million) Forecast, by Application 2020 & 2033
- Table 36: Rest of Middle East & Africa Logic Burn-In Board Revenue (million) Forecast, by Application 2020 & 2033
- Table 37: Global Logic Burn-In Board Revenue million Forecast, by Application 2020 & 2033
- Table 38: Global Logic Burn-In Board Revenue million Forecast, by Types 2020 & 2033
- Table 39: Global Logic Burn-In Board Revenue million Forecast, by Country 2020 & 2033
- Table 40: China Logic Burn-In Board Revenue (million) Forecast, by Application 2020 & 2033
- Table 41: India Logic Burn-In Board Revenue (million) Forecast, by Application 2020 & 2033
- Table 42: Japan Logic Burn-In Board Revenue (million) Forecast, by Application 2020 & 2033
- Table 43: South Korea Logic Burn-In Board Revenue (million) Forecast, by Application 2020 & 2033
- Table 44: ASEAN Logic Burn-In Board Revenue (million) Forecast, by Application 2020 & 2033
- Table 45: Oceania Logic Burn-In Board Revenue (million) Forecast, by Application 2020 & 2033
- Table 46: Rest of Asia Pacific Logic Burn-In Board Revenue (million) Forecast, by Application 2020 & 2033
Frequently Asked Questions
1. What is the projected Compound Annual Growth Rate (CAGR) of the Logic Burn-In Board?
The projected CAGR is approximately 8.18%.
2. Which companies are prominent players in the Logic Burn-In Board?
Key companies in the market include ISC, Fusion Electronics, Abrel, STK Technology, Micro Control, Trio-Tech International, EDA Industries, Loranger International, KES Systems, Sunright Limited, Guangzhou FastPrint Circuit Tech, Keystone Microtech Corporation.
3. What are the main segments of the Logic Burn-In Board?
The market segments include Application, Types.
4. Can you provide details about the market size?
The market size is estimated to be USD 180.29 million as of 2022.
5. What are some drivers contributing to market growth?
N/A
6. What are the notable trends driving market growth?
N/A
7. Are there any restraints impacting market growth?
N/A
8. Can you provide examples of recent developments in the market?
N/A
9. What pricing options are available for accessing the report?
Pricing options include single-user, multi-user, and enterprise licenses priced at USD 2900.00, USD 4350.00, and USD 5800.00 respectively.
10. Is the market size provided in terms of value or volume?
The market size is provided in terms of value, measured in million.
11. Are there any specific market keywords associated with the report?
Yes, the market keyword associated with the report is "Logic Burn-In Board," which aids in identifying and referencing the specific market segment covered.
12. How do I determine which pricing option suits my needs best?
The pricing options vary based on user requirements and access needs. Individual users may opt for single-user licenses, while businesses requiring broader access may choose multi-user or enterprise licenses for cost-effective access to the report.
13. Are there any additional resources or data provided in the Logic Burn-In Board report?
While the report offers comprehensive insights, it's advisable to review the specific contents or supplementary materials provided to ascertain if additional resources or data are available.
14. How can I stay updated on further developments or reports in the Logic Burn-In Board?
To stay informed about further developments, trends, and reports in the Logic Burn-In Board, consider subscribing to industry newsletters, following relevant companies and organizations, or regularly checking reputable industry news sources and publications.
Methodology
Step 1 - Identification of Relevant Samples Size from Population Database


Step 2 - Approaches for Defining Global Market Size (Value, Volume* & Price*)

Note*: In applicable scenarios
Step 3 - Data Sources
Primary Research
- Web Analytics
- Survey Reports
- Research Institute
- Latest Research Reports
- Opinion Leaders
Secondary Research
- Annual Reports
- White Paper
- Latest Press Release
- Industry Association
- Paid Database
- Investor Presentations

Step 4 - Data Triangulation
Involves using different sources of information in order to increase the validity of a study
These sources are likely to be stakeholders in a program - participants, other researchers, program staff, other community members, and so on.
Then we put all data in single framework & apply various statistical tools to find out the dynamic on the market.
During the analysis stage, feedback from the stakeholder groups would be compared to determine areas of agreement as well as areas of divergence