

Key Insights
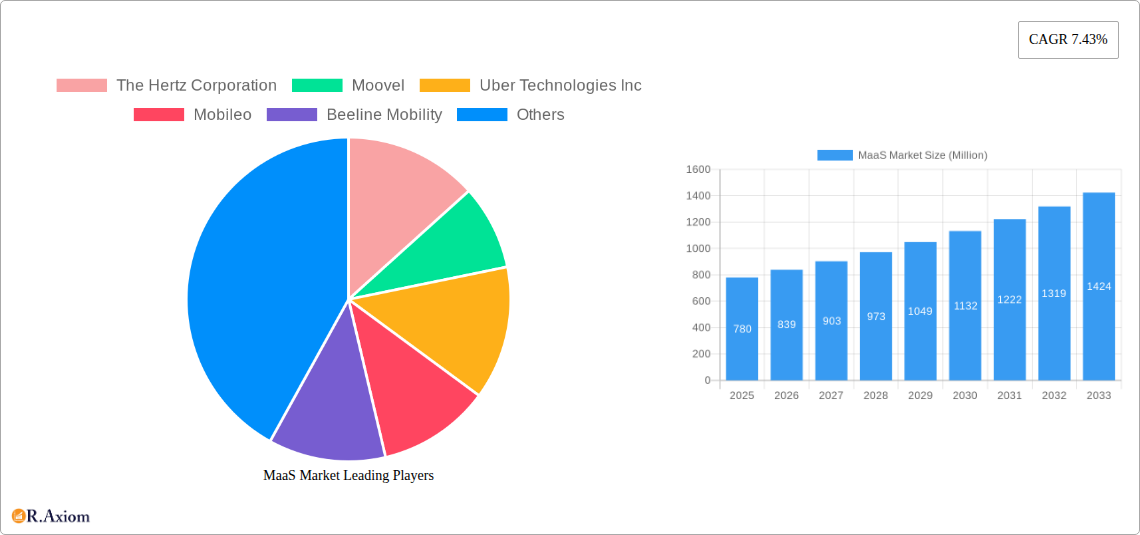
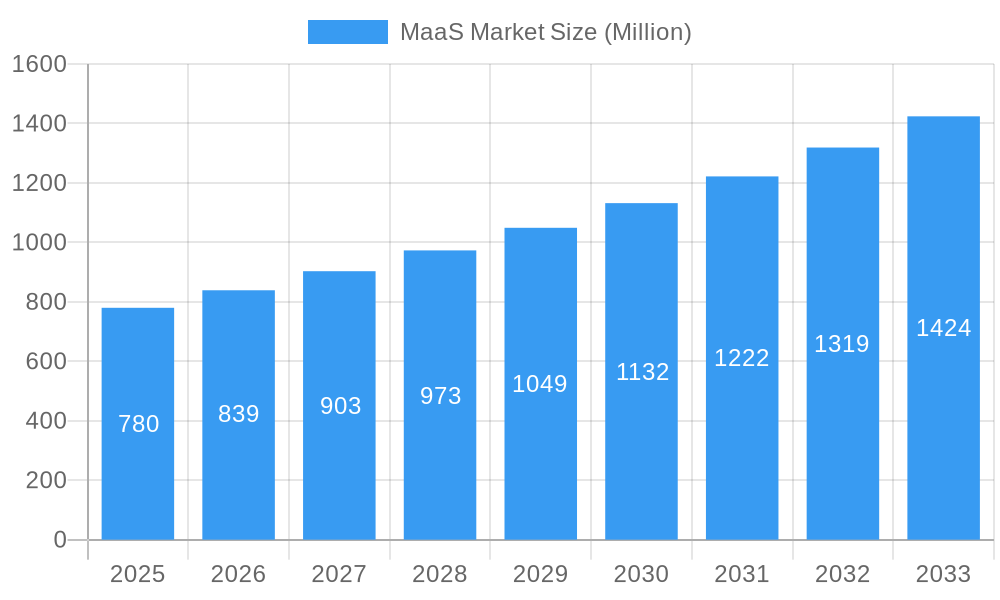
The Mobility as a Service (MaaS) market, currently valued at $0.78 billion in 2025, is projected to experience robust growth, driven by increasing urbanization, rising fuel prices, and a growing preference for sustainable transportation solutions. The market's Compound Annual Growth Rate (CAGR) of 7.43% from 2025 to 2033 indicates a significant expansion in market size over the forecast period. Key drivers include the rising adoption of smart city initiatives, technological advancements in transportation infrastructure (including improved public transportation apps and integrated ticketing systems), and the increasing availability of on-demand mobility services. The integration of various transportation modes – car, bus, bike – within a single platform, coupled with options for both public and private transportation, appeals to a wider consumer base. This is further fueled by the expansion of shared mobility services and the development of sophisticated mobility management platforms offered by players like Uber, Hertz, and Moovit. The market faces some restraints, including concerns over data privacy and security, potential regulatory hurdles in different regions, and the need for seamless integration across diverse transportation systems. However, the overall market trajectory remains positive, particularly in regions like North America and Europe where technological infrastructure and consumer adoption are strong. Asia-Pacific is expected to witness significant growth in the coming years driven by rapidly expanding urban populations and increasing investments in technological infrastructure.
MaaS Market Market Size (In Million)
The segmentation of the MaaS market by service type (car, bus, bike) and transportation type (public, private) reveals opportunities for tailored service offerings. The dominance of certain service types varies regionally; for instance, car-based MaaS solutions may be more prevalent in North America, while bike-sharing programs may find greater traction in Europe and Asia. The continued innovation in service offerings, coupled with strategic partnerships between MaaS providers and traditional transportation companies, is expected to further consolidate and expand the market. Furthermore, the increasing focus on developing integrated, user-friendly mobile applications and platforms will play a crucial role in accelerating the adoption of MaaS services across diverse demographics. The competitive landscape is dynamic, featuring both established transportation companies diversifying their offerings and innovative startups entering the market. Success will depend on factors such as the ability to provide a seamless user experience, secure data privacy, and effectively integrate various transportation modes within a single platform.
MaaS Market Company Market Share
MaaS Market: A Comprehensive Report (2019-2033)
This comprehensive report provides an in-depth analysis of the MaaS (Mobility as a Service) market, covering its current state, future trends, and key players. With a study period spanning 2019-2033, a base year of 2025, and a forecast period of 2025-2033, this report offers invaluable insights for industry stakeholders, investors, and strategic decision-makers. The report utilizes data from the historical period (2019-2024) to project future market dynamics, including market size and growth projections in Millions.
MaaS Market Concentration & Innovation
The MaaS market exhibits a moderately concentrated landscape, with several major players vying for market share. However, the emergence of numerous smaller, innovative companies is driving competition and fostering innovation. Market share analysis reveals that Uber Technologies Inc. and Didi Chuxing currently hold significant positions, although their precise percentages are subject to ongoing competitive activity and are estimated to be around xx% and xx%, respectively, in 2025. The market is characterized by frequent mergers and acquisitions (M&A) activity, with deal values in the past five years totaling an estimated XX Million. These M&A activities have primarily focused on expanding service offerings, geographical reach, and technological capabilities.
- Key Innovation Drivers: Technological advancements in areas such as AI, big data analytics, and IoT are driving the development of more sophisticated and integrated MaaS platforms.
- Regulatory Frameworks: Varying regulatory environments across different regions influence the adoption and expansion of MaaS services. Stricter regulations can hinder growth, while supportive frameworks can accelerate market penetration.
- Product Substitutes: Traditional modes of transportation, such as private car ownership, remain significant substitutes. However, the increasing affordability and convenience of MaaS are gradually eroding their dominance in urban areas.
- End-User Trends: Growing urbanization, rising disposable incomes, and a preference for convenient and sustainable transportation options are driving demand for MaaS. Consumers are increasingly seeking integrated mobility solutions that combine different modes of transport.
- M&A Activity: The increasing M&A activity reflects the strategic importance of the MaaS market. Companies are looking to expand their offerings, gain access to new technologies, and solidify their market position through acquisitions.
MaaS Market Industry Trends & Insights
The MaaS market is experiencing robust growth, driven by several key factors. The Compound Annual Growth Rate (CAGR) for the forecast period (2025-2033) is projected at xx%, indicating significant market expansion. This growth is fueled by increasing urbanization, rising environmental concerns, and the growing adoption of smartphones and mobile apps. Technological disruptions, such as the introduction of autonomous vehicles and improved data analytics, are reshaping the competitive landscape. Consumer preferences are shifting towards integrated, on-demand mobility solutions, which provide greater convenience and flexibility. Competitive dynamics are intense, with established players and new entrants constantly innovating and expanding their services to cater to evolving consumer demands. Market penetration is expected to reach xx% by 2033, primarily in densely populated urban areas. The evolving preferences toward sustainable transportation options are boosting the market growth.
Dominant Markets & Segments in MaaS Market
While the MaaS market is globally expanding, certain regions and segments exhibit stronger dominance than others.
Leading Region/Country: North America and particularly the United States currently dominate the MaaS market, due to higher levels of technological advancement, robust infrastructure, and a greater willingness to adopt new mobility solutions. However, rapid growth is anticipated in Asia-Pacific regions in the coming years. Europe is also witnessing significant market expansion.
Dominant Segments:
- By Service Type: The car segment currently holds the largest market share, driven by the widespread availability of ride-hailing services. However, the bike and bus segments are expected to see significant growth, driven by increased focus on micro-mobility and public transportation integration.
- By Transportation Type: The private transportation segment currently commands a larger share, but the public transportation segment is growing rapidly, fueled by collaborations between MaaS providers and public transit agencies.
Key Drivers for Dominant Segments:
- Economic Policies: Government incentives and subsidies for public transportation and sustainable mobility solutions are driving growth in the bus and public transportation segments.
- Infrastructure: The availability of well-developed public transport infrastructure and cycling lanes is crucial for the success of the bus and bike segments.
MaaS Market Product Developments
Recent product innovations in the MaaS market include the integration of various transportation modes into a single platform, the use of AI-powered route optimization, and the implementation of seamless payment systems. These developments provide greater convenience, flexibility, and cost-effectiveness for users. The integration of real-time data analytics and predictive modeling enhances service efficiency and optimizes resource allocation. These advancements are improving market fit by catering to diverse user needs and preferences.
Report Scope & Segmentation Analysis
This report segments the MaaS market based on service type (car, bus, bike) and transportation type (public, private). Each segment's growth projections, market sizes (in Millions), and competitive dynamics are analyzed in detail.
By Service Type: The car segment is expected to maintain its significant market share, while bus and bike segments are projected to witness notable growth, driven by increasing adoption of micro-mobility solutions and government initiatives to promote sustainable transport.
By Transportation Type: The private transportation segment currently dominates but will likely see its growth rate moderated by the increasing popularity of integrated public transport options within MaaS platforms. The public transportation segment is poised for substantial growth due to collaborations between MaaS providers and public transit authorities.
Key Drivers of MaaS Market Growth
The MaaS market's growth is propelled by technological advancements, supportive government policies, and evolving consumer preferences. The increasing adoption of smartphones and mobile apps facilitates seamless access to integrated transportation services. Government initiatives promoting sustainable transportation and reducing traffic congestion further encourage MaaS adoption.
Challenges in the MaaS Market Sector
The MaaS market faces challenges, including regulatory hurdles in different jurisdictions, potential data privacy concerns, and the need for robust cybersecurity measures. Supply chain disruptions affecting vehicle manufacturing and maintenance can impact service availability. Intense competition and pricing pressures also represent significant hurdles.
Emerging Opportunities in MaaS Market
Emerging opportunities include the expansion of MaaS into underserved markets, the integration of autonomous vehicles, and the development of personalized mobility solutions. The growing emphasis on sustainability presents opportunities for MaaS providers to offer eco-friendly transportation options.
Leading Players in the MaaS Market Market
- The Hertz Corporation
- Moovel
- Uber Technologies Inc
- Mobileo
- Beeline Mobility
- Enterprise Holdings Inc
- Avis Budget Group
- Moovit Inc
- Whim (Maas Global)
- Didi Chuxing
- Bridj Technology Pty Ltd
- Ubigo (via-id)
- Citymapper
Key Developments in MaaS Market Industry
- February 2023: Uber partnered with HSBC to launch a digital payment solution for unbanked drivers in Egypt, improving driver income accessibility.
- January 2023: DiDi partnered with Jordan Transfer Guidance to integrate taxi dispatch into a tourism app, anticipating increased tourism.
- December 2022: Moovit launched a MaaS pilot in Tampa, Florida, integrating various modes of transport into a single app.
Strategic Outlook for MaaS Market Market
The MaaS market is poised for continued expansion, driven by technological innovation, evolving consumer preferences, and supportive government policies. Future growth will be shaped by the integration of autonomous vehicles, the development of more personalized mobility solutions, and the expansion into new markets. The focus on sustainability and seamless user experiences will remain critical for success in the MaaS sector.
MaaS Market Segmentation
-
1. Service Type
- 1.1. Car
- 1.2. Bus
- 1.3. Bike
-
2. Transportation Type
- 2.1. Public
- 2.2. Private
MaaS Market Segmentation By Geography
-
1. North America
- 1.1. United States
- 1.2. Canada
- 1.3. Rest of North America
-
2. Europe
- 2.1. Germany
- 2.2. United Kingdom
- 2.3. France
- 2.4. Rest of Europe
-
3. Asia Pacific
- 3.1. India
- 3.2. China
- 3.3. Japan
- 3.4. South Korea
- 3.5. Rest of Asia Pacific
-
4. Rest of the World
- 4.1. South America
- 4.2. Middle East and Africa
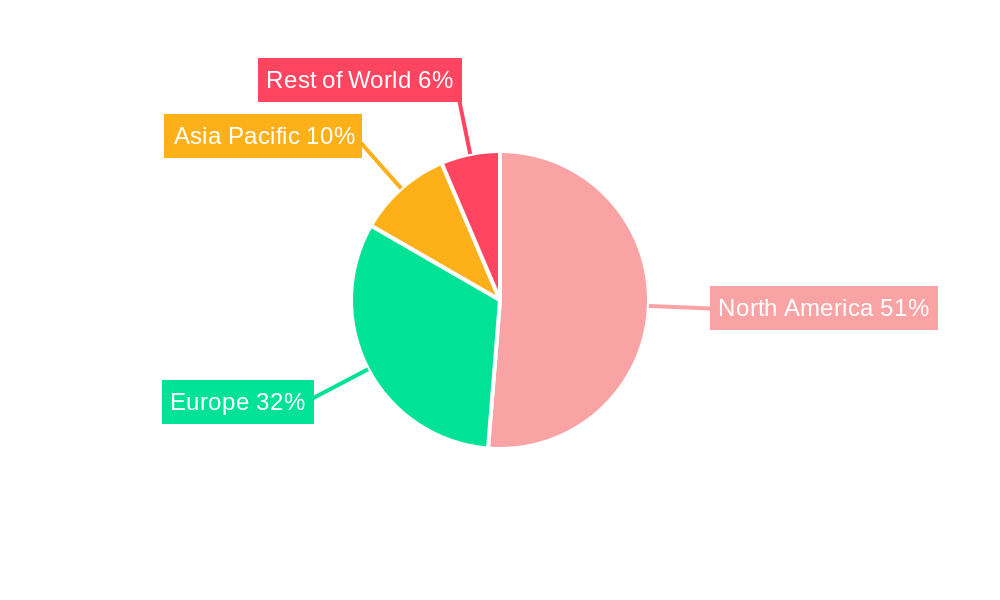
MaaS Market Regional Market Share
Geographic Coverage of MaaS Market
MaaS Market REPORT HIGHLIGHTS
| Aspects | Details |
|---|---|
| Study Period | 2020-2034 |
| Base Year | 2025 |
| Estimated Year | 2026 |
| Forecast Period | 2026-2034 |
| Historical Period | 2020-2025 |
| Growth Rate | CAGR of 7.43% from 2020-2034 |
| Segmentation |
|
Table of Contents
- 1. Introduction
- 1.1. Research Scope
- 1.2. Market Segmentation
- 1.3. Research Objective
- 1.4. Definitions and Assumptions
- 2. Executive Summary
- 2.1. Market Snapshot
- 3. Market Dynamics
- 3.1. Market Drivers
- 3.2. Market Restrains
- 3.3. Market Trends
- 3.4. Market Opportunities
- 4. Market Factor Analysis
- 4.1. Porters Five Forces
- 4.1.1. Bargaining Power of Suppliers
- 4.1.2. Bargaining Power of Buyers
- 4.1.3. Threat of New Entrants
- 4.1.4. Threat of Substitutes
- 4.1.5. Competitive Rivalry
- 4.2. PESTEL analysis
- 4.3. BCG Analysis
- 4.3.1. Stars (High Growth, High Market Share)
- 4.3.2. Cash Cows (Low Growth, High Market Share)
- 4.3.3. Question Mark (High Growth, Low Market Share)
- 4.3.4. Dogs (Low Growth, Low Market Share)
- 4.4. Ansoff Matrix Analysis
- 4.5. Supply Chain Analysis
- 4.6. Regulatory Landscape
- 4.7. Current Market Potential and Opportunity Assessment (TAM–SAM–SOM Framework)
- 4.8. RAX Analyst Note
- 4.1. Porters Five Forces
- 5. Market Analysis, Insights and Forecast 2021-2033
- 5.1. Market Analysis, Insights and Forecast - by Service Type
- 5.1.1. Car
- 5.1.2. Bus
- 5.1.3. Bike
- 5.2. Market Analysis, Insights and Forecast - by Transportation Type
- 5.2.1. Public
- 5.2.2. Private
- 5.3. Market Analysis, Insights and Forecast - by Region
- 5.3.1. North America
- 5.3.2. Europe
- 5.3.3. Asia Pacific
- 5.3.4. Rest of the World
- 5.1. Market Analysis, Insights and Forecast - by Service Type
- 6. Global MaaS Market Analysis, Insights and Forecast, 2021-2033
- 6.1. Market Analysis, Insights and Forecast - by Service Type
- 6.1.1. Car
- 6.1.2. Bus
- 6.1.3. Bike
- 6.2. Market Analysis, Insights and Forecast - by Transportation Type
- 6.2.1. Public
- 6.2.2. Private
- 6.1. Market Analysis, Insights and Forecast - by Service Type
- 7. North America MaaS Market Analysis, Insights and Forecast, 2020-2032
- 7.1. Market Analysis, Insights and Forecast - by Service Type
- 7.1.1. Car
- 7.1.2. Bus
- 7.1.3. Bike
- 7.2. Market Analysis, Insights and Forecast - by Transportation Type
- 7.2.1. Public
- 7.2.2. Private
- 7.1. Market Analysis, Insights and Forecast - by Service Type
- 8. Europe MaaS Market Analysis, Insights and Forecast, 2020-2032
- 8.1. Market Analysis, Insights and Forecast - by Service Type
- 8.1.1. Car
- 8.1.2. Bus
- 8.1.3. Bike
- 8.2. Market Analysis, Insights and Forecast - by Transportation Type
- 8.2.1. Public
- 8.2.2. Private
- 8.1. Market Analysis, Insights and Forecast - by Service Type
- 9. Asia Pacific MaaS Market Analysis, Insights and Forecast, 2020-2032
- 9.1. Market Analysis, Insights and Forecast - by Service Type
- 9.1.1. Car
- 9.1.2. Bus
- 9.1.3. Bike
- 9.2. Market Analysis, Insights and Forecast - by Transportation Type
- 9.2.1. Public
- 9.2.2. Private
- 9.1. Market Analysis, Insights and Forecast - by Service Type
- 10. Rest of the World MaaS Market Analysis, Insights and Forecast, 2020-2032
- 10.1. Market Analysis, Insights and Forecast - by Service Type
- 10.1.1. Car
- 10.1.2. Bus
- 10.1.3. Bike
- 10.2. Market Analysis, Insights and Forecast - by Transportation Type
- 10.2.1. Public
- 10.2.2. Private
- 10.1. Market Analysis, Insights and Forecast - by Service Type
- 11. Competitive Analysis
- 11.1. Company Profiles
- 11.1.1 The Hertz Corporation
- 11.1.1.1. Company Overview
- 11.1.1.2. Products
- 11.1.1.3. Company Financials
- 11.1.1.4. SWOT Analysis
- 11.1.2 Moovel
- 11.1.2.1. Company Overview
- 11.1.2.2. Products
- 11.1.2.3. Company Financials
- 11.1.2.4. SWOT Analysis
- 11.1.3 Uber Technologies Inc
- 11.1.3.1. Company Overview
- 11.1.3.2. Products
- 11.1.3.3. Company Financials
- 11.1.3.4. SWOT Analysis
- 11.1.4 Mobileo
- 11.1.4.1. Company Overview
- 11.1.4.2. Products
- 11.1.4.3. Company Financials
- 11.1.4.4. SWOT Analysis
- 11.1.5 Beeline Mobility
- 11.1.5.1. Company Overview
- 11.1.5.2. Products
- 11.1.5.3. Company Financials
- 11.1.5.4. SWOT Analysis
- 11.1.6 Enterprise Holdings Inc
- 11.1.6.1. Company Overview
- 11.1.6.2. Products
- 11.1.6.3. Company Financials
- 11.1.6.4. SWOT Analysis
- 11.1.7 Avis Budget Group
- 11.1.7.1. Company Overview
- 11.1.7.2. Products
- 11.1.7.3. Company Financials
- 11.1.7.4. SWOT Analysis
- 11.1.8 Moovit Inc
- 11.1.8.1. Company Overview
- 11.1.8.2. Products
- 11.1.8.3. Company Financials
- 11.1.8.4. SWOT Analysis
- 11.1.9 Whim (Maas Global)
- 11.1.9.1. Company Overview
- 11.1.9.2. Products
- 11.1.9.3. Company Financials
- 11.1.9.4. SWOT Analysis
- 11.1.10 Didi Chuxing
- 11.1.10.1. Company Overview
- 11.1.10.2. Products
- 11.1.10.3. Company Financials
- 11.1.10.4. SWOT Analysis
- 11.1.11 Bridj Technology Pty Ltd
- 11.1.11.1. Company Overview
- 11.1.11.2. Products
- 11.1.11.3. Company Financials
- 11.1.11.4. SWOT Analysis
- 11.1.12 Ubigo (via-id)
- 11.1.12.1. Company Overview
- 11.1.12.2. Products
- 11.1.12.3. Company Financials
- 11.1.12.4. SWOT Analysis
- 11.1.13 Citymapper
- 11.1.13.1. Company Overview
- 11.1.13.2. Products
- 11.1.13.3. Company Financials
- 11.1.13.4. SWOT Analysis
- 11.1.1 The Hertz Corporation
- 11.2. Market Entropy
- 11.2.1 Company's Key Areas Served
- 11.2.2 Recent Developments
- 11.3. Company Market Share Analysis 2025
- 11.3.1 Top 5 Companies Market Share Analysis
- 11.3.2 Top 3 Companies Market Share Analysis
- 11.4. List of Potential Customers
- 12. Research Methodology
List of Figures
- Figure 1: Global MaaS Market Revenue Breakdown (Million, %) by Region 2025 & 2033
- Figure 2: North America MaaS Market Revenue (Million), by Service Type 2025 & 2033
- Figure 3: North America MaaS Market Revenue Share (%), by Service Type 2025 & 2033
- Figure 4: North America MaaS Market Revenue (Million), by Transportation Type 2025 & 2033
- Figure 5: North America MaaS Market Revenue Share (%), by Transportation Type 2025 & 2033
- Figure 6: North America MaaS Market Revenue (Million), by Country 2025 & 2033
- Figure 7: North America MaaS Market Revenue Share (%), by Country 2025 & 2033
- Figure 8: Europe MaaS Market Revenue (Million), by Service Type 2025 & 2033
- Figure 9: Europe MaaS Market Revenue Share (%), by Service Type 2025 & 2033
- Figure 10: Europe MaaS Market Revenue (Million), by Transportation Type 2025 & 2033
- Figure 11: Europe MaaS Market Revenue Share (%), by Transportation Type 2025 & 2033
- Figure 12: Europe MaaS Market Revenue (Million), by Country 2025 & 2033
- Figure 13: Europe MaaS Market Revenue Share (%), by Country 2025 & 2033
- Figure 14: Asia Pacific MaaS Market Revenue (Million), by Service Type 2025 & 2033
- Figure 15: Asia Pacific MaaS Market Revenue Share (%), by Service Type 2025 & 2033
- Figure 16: Asia Pacific MaaS Market Revenue (Million), by Transportation Type 2025 & 2033
- Figure 17: Asia Pacific MaaS Market Revenue Share (%), by Transportation Type 2025 & 2033
- Figure 18: Asia Pacific MaaS Market Revenue (Million), by Country 2025 & 2033
- Figure 19: Asia Pacific MaaS Market Revenue Share (%), by Country 2025 & 2033
- Figure 20: Rest of the World MaaS Market Revenue (Million), by Service Type 2025 & 2033
- Figure 21: Rest of the World MaaS Market Revenue Share (%), by Service Type 2025 & 2033
- Figure 22: Rest of the World MaaS Market Revenue (Million), by Transportation Type 2025 & 2033
- Figure 23: Rest of the World MaaS Market Revenue Share (%), by Transportation Type 2025 & 2033
- Figure 24: Rest of the World MaaS Market Revenue (Million), by Country 2025 & 2033
- Figure 25: Rest of the World MaaS Market Revenue Share (%), by Country 2025 & 2033
List of Tables
- Table 1: Global MaaS Market Revenue Million Forecast, by Service Type 2020 & 2033
- Table 2: Global MaaS Market Revenue Million Forecast, by Transportation Type 2020 & 2033
- Table 3: Global MaaS Market Revenue Million Forecast, by Region 2020 & 2033
- Table 4: Global MaaS Market Revenue Million Forecast, by Service Type 2020 & 2033
- Table 5: Global MaaS Market Revenue Million Forecast, by Transportation Type 2020 & 2033
- Table 6: Global MaaS Market Revenue Million Forecast, by Country 2020 & 2033
- Table 7: United States MaaS Market Revenue (Million) Forecast, by Application 2020 & 2033
- Table 8: Canada MaaS Market Revenue (Million) Forecast, by Application 2020 & 2033
- Table 9: Rest of North America MaaS Market Revenue (Million) Forecast, by Application 2020 & 2033
- Table 10: Global MaaS Market Revenue Million Forecast, by Service Type 2020 & 2033
- Table 11: Global MaaS Market Revenue Million Forecast, by Transportation Type 2020 & 2033
- Table 12: Global MaaS Market Revenue Million Forecast, by Country 2020 & 2033
- Table 13: Germany MaaS Market Revenue (Million) Forecast, by Application 2020 & 2033
- Table 14: United Kingdom MaaS Market Revenue (Million) Forecast, by Application 2020 & 2033
- Table 15: France MaaS Market Revenue (Million) Forecast, by Application 2020 & 2033
- Table 16: Rest of Europe MaaS Market Revenue (Million) Forecast, by Application 2020 & 2033
- Table 17: Global MaaS Market Revenue Million Forecast, by Service Type 2020 & 2033
- Table 18: Global MaaS Market Revenue Million Forecast, by Transportation Type 2020 & 2033
- Table 19: Global MaaS Market Revenue Million Forecast, by Country 2020 & 2033
- Table 20: India MaaS Market Revenue (Million) Forecast, by Application 2020 & 2033
- Table 21: China MaaS Market Revenue (Million) Forecast, by Application 2020 & 2033
- Table 22: Japan MaaS Market Revenue (Million) Forecast, by Application 2020 & 2033
- Table 23: South Korea MaaS Market Revenue (Million) Forecast, by Application 2020 & 2033
- Table 24: Rest of Asia Pacific MaaS Market Revenue (Million) Forecast, by Application 2020 & 2033
- Table 25: Global MaaS Market Revenue Million Forecast, by Service Type 2020 & 2033
- Table 26: Global MaaS Market Revenue Million Forecast, by Transportation Type 2020 & 2033
- Table 27: Global MaaS Market Revenue Million Forecast, by Country 2020 & 2033
- Table 28: South America MaaS Market Revenue (Million) Forecast, by Application 2020 & 2033
- Table 29: Middle East and Africa MaaS Market Revenue (Million) Forecast, by Application 2020 & 2033
Frequently Asked Questions
1. What is the projected Compound Annual Growth Rate (CAGR) of the MaaS Market?
The projected CAGR is approximately 7.43%.
2. Which companies are prominent players in the MaaS Market?
Key companies in the market include The Hertz Corporation, Moovel, Uber Technologies Inc, Mobileo, Beeline Mobility, Enterprise Holdings Inc, Avis Budget Group, Moovit Inc, Whim (Maas Global), Didi Chuxing, Bridj Technology Pty Ltd, Ubigo (via-id), Citymapper.
3. What are the main segments of the MaaS Market?
The market segments include Service Type, Transportation Type.
4. Can you provide details about the market size?
The market size is estimated to be USD 0.78 Million as of 2022.
5. What are some drivers contributing to market growth?
Increasing Vehicle Production; Emphasis on Vehicle Comfort and NVH Reduction.
6. What are the notable trends driving market growth?
Increasing Traffic Congestion Drive the Demand in the Market.
7. Are there any restraints impacting market growth?
Economic Fluctuations And Uncertainties.
8. Can you provide examples of recent developments in the market?
In February 2023, Uber partnered with financial services firm HSBC to launch a digital payments solution that allows unbanked drivers in Egypt to receive on-demand cash outs into mobile wallets. Through this collaboration, the companies hope to provide Uber platform drivers with access to 100% of their earnings in a timely and convenient manner via HSBC Net's payment solution.
9. What pricing options are available for accessing the report?
Pricing options include single-user, multi-user, and enterprise licenses priced at USD 4750, USD 5250, and USD 8750 respectively.
10. Is the market size provided in terms of value or volume?
The market size is provided in terms of value, measured in Million.
11. Are there any specific market keywords associated with the report?
Yes, the market keyword associated with the report is "MaaS Market," which aids in identifying and referencing the specific market segment covered.
12. How do I determine which pricing option suits my needs best?
The pricing options vary based on user requirements and access needs. Individual users may opt for single-user licenses, while businesses requiring broader access may choose multi-user or enterprise licenses for cost-effective access to the report.
13. Are there any additional resources or data provided in the MaaS Market report?
While the report offers comprehensive insights, it's advisable to review the specific contents or supplementary materials provided to ascertain if additional resources or data are available.
14. How can I stay updated on further developments or reports in the MaaS Market?
To stay informed about further developments, trends, and reports in the MaaS Market, consider subscribing to industry newsletters, following relevant companies and organizations, or regularly checking reputable industry news sources and publications.
Methodology
Step 1 - Identification of Relevant Samples Size from Population Database


Step 2 - Approaches for Defining Global Market Size (Value, Volume* & Price*)

Note*: In applicable scenarios
Step 3 - Data Sources
Primary Research
- Web Analytics
- Survey Reports
- Research Institute
- Latest Research Reports
- Opinion Leaders
Secondary Research
- Annual Reports
- White Paper
- Latest Press Release
- Industry Association
- Paid Database
- Investor Presentations

Step 4 - Data Triangulation
Involves using different sources of information in order to increase the validity of a study
These sources are likely to be stakeholders in a program - participants, other researchers, program staff, other community members, and so on.
Then we put all data in single framework & apply various statistical tools to find out the dynamic on the market.
During the analysis stage, feedback from the stakeholder groups would be compared to determine areas of agreement as well as areas of divergence