

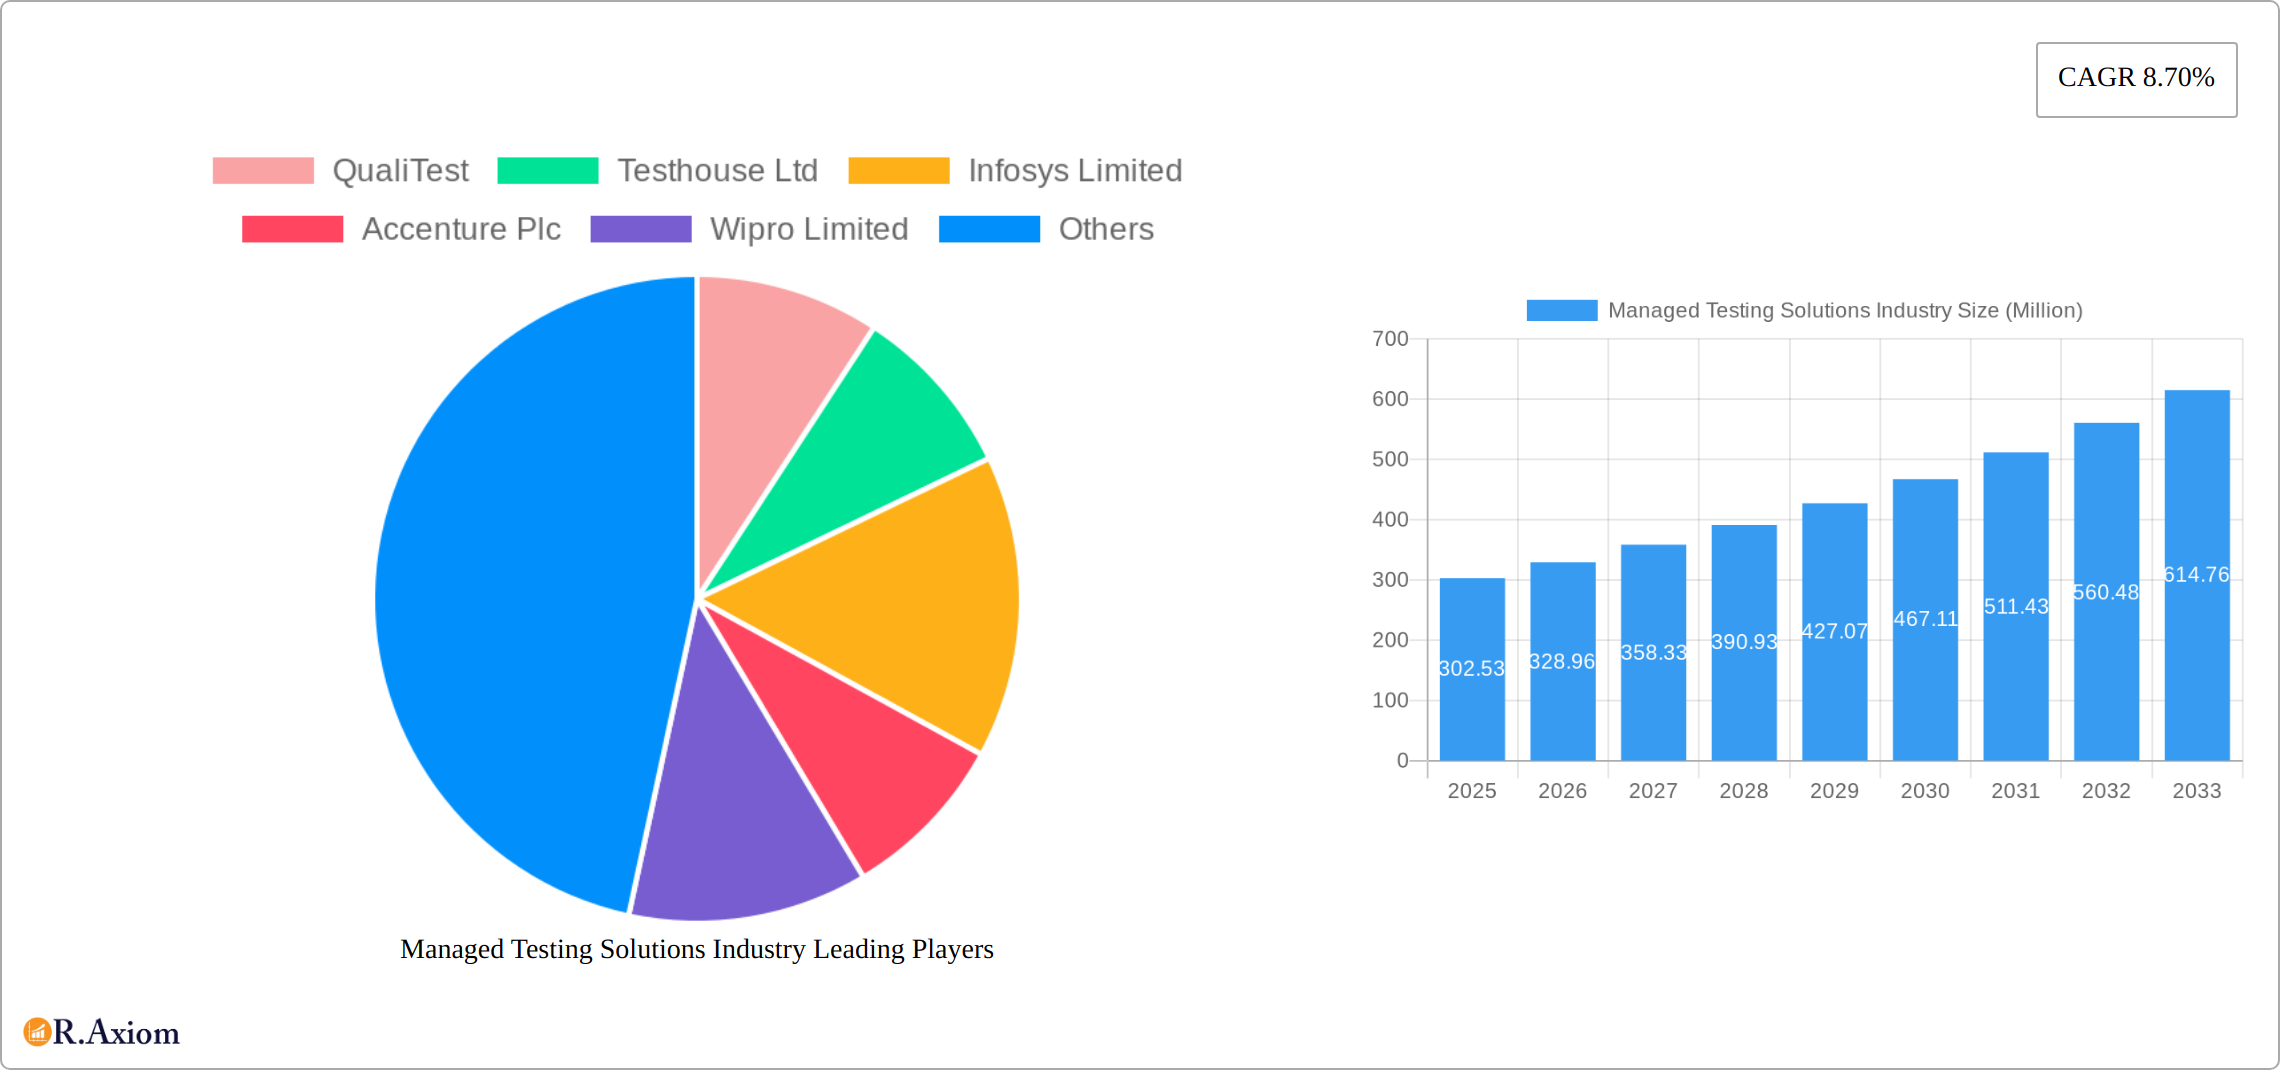
Key Insights
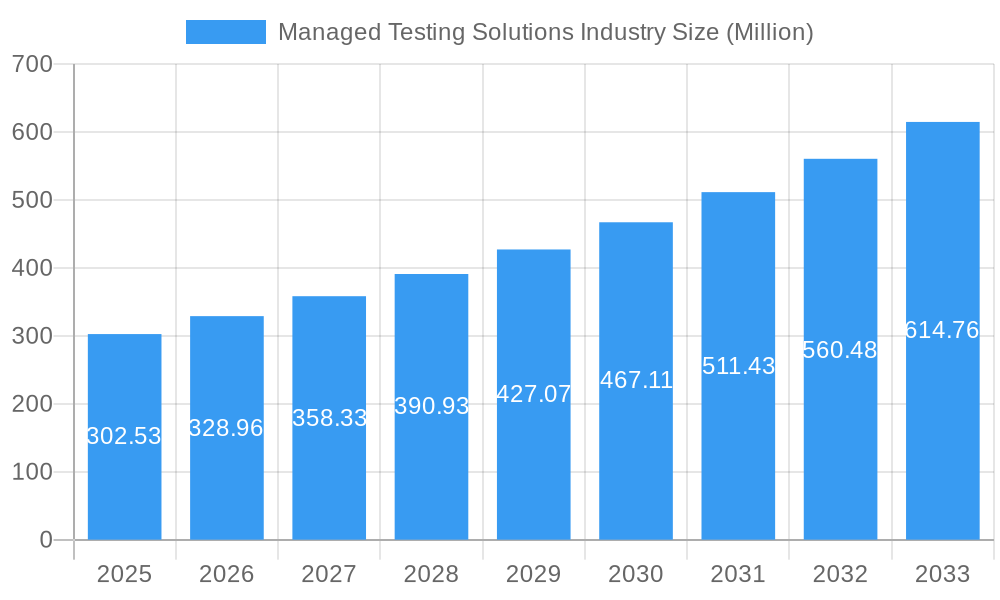
The Managed Testing Solutions market is experiencing robust growth, projected to reach $302.53 million in 2025 and exhibiting a Compound Annual Growth Rate (CAGR) of 8.70% from 2025 to 2033. This expansion is fueled by several key drivers. The increasing complexity of software applications across various industries necessitates comprehensive testing solutions to ensure quality, security, and performance. Furthermore, the rising adoption of cloud-based technologies and agile development methodologies creates a greater demand for flexible and scalable managed testing services. The shift towards digital transformation initiatives across sectors like healthcare, BFSI (Banking, Financial Services, and Insurance), and retail is also significantly contributing to market growth. Businesses are outsourcing testing functions to specialized providers to leverage their expertise and reduce operational costs, further accelerating market expansion. The market segmentation reveals significant contributions from large enterprises and the healthcare, BFSI, and Telecom & IT sectors. Geographically, North America and Europe currently hold substantial market share, but the Asia-Pacific region is poised for significant growth driven by increasing digital adoption and a large pool of skilled IT professionals. Competitive landscape analysis indicates that established players such as Infosys, Accenture, Wipro, and IBM are leading the market, alongside specialized testing companies like QualiTest and Testhouse.
Managed Testing Solutions Industry Market Size (In Million)
The future growth of the Managed Testing Solutions market will depend on several factors. Continued technological advancements, particularly in areas like Artificial Intelligence (AI) and automation, will lead to increased efficiency and improved testing capabilities. The adoption of DevOps practices and continuous integration/continuous delivery (CI/CD) pipelines will further drive demand for managed testing services that can seamlessly integrate into agile development workflows. However, challenges remain, including the need for skilled professionals, the complexity of integrating testing into diverse IT landscapes, and ensuring data security and compliance. The ability of providers to adapt to these evolving needs, leverage new technologies effectively, and address security concerns will be crucial to their success in the years ahead. The market's trajectory points to continued expansion, making it an attractive investment opportunity for stakeholders.
Managed Testing Solutions Industry Company Market Share
Managed Testing Solutions Industry: A Comprehensive Market Report (2019-2033)
This comprehensive report provides an in-depth analysis of the Managed Testing Solutions industry, covering market size, segmentation, growth drivers, challenges, and key players. The study period spans from 2019 to 2033, with 2025 as the base and estimated year. The report leverages extensive primary and secondary research to deliver actionable insights for stakeholders across the value chain. With a forecast period of 2025-2033 and a historical period of 2019-2024, this report is an essential resource for strategic decision-making in this rapidly evolving market. The global market value is predicted to reach xx Million by 2033.
Managed Testing Solutions Industry Market Concentration & Innovation
The Managed Testing Solutions market exhibits a moderately concentrated landscape, with a few major players holding significant market share. QualiTest, Testhouse Ltd, Infosys Limited, Accenture Plc, Wipro Limited, Cognizant, TATA Consultancy Services Limited, Hexaware Technologies, Capgemini SE, and International Business Machines Corporation (IBM) are key players influencing market dynamics. In 2024, the top five players collectively held an estimated xx% market share. Innovation is driven by advancements in AI, automation, and cloud-based testing solutions. Stringent regulatory frameworks, particularly in sectors like healthcare and finance, influence testing methodologies and service adoption. The emergence of sophisticated test automation tools and the growing demand for DevOps practices are pushing the industry toward greater efficiency and speed. Product substitutes, such as open-source testing tools, pose competitive pressure, particularly to smaller companies. End-user trends lean towards demanding comprehensive quality assurance, including security testing and performance testing. The market has witnessed significant M&A activity in recent years, with deal values exceeding xx Million in 2024 alone. Key acquisitions have focused on expanding service offerings and geographical reach.
- Market Share (2024): Top 5 players: xx%
- M&A Deal Value (2024): xx Million
- Key Innovation Drivers: AI, Automation, Cloud-based testing, DevOps
Managed Testing Solutions Industry Industry Trends & Insights
The Managed Testing Solutions market is experiencing a period of dynamic expansion, propelled by the escalating complexity of modern software, the widespread embrace of agile development and DevOps practices, and the imperative for digital transformation across diverse industries. Analysts project a robust Compound Annual Growth Rate (CAGR) of approximately XX% for the market during the forecast period of 2025-2033. A significant catalyst for this growth is the integration of advanced technologies such as Artificial Intelligence (AI) and Machine Learning (ML) into testing processes, which are revolutionizing efficiency, accuracy, and predictive capabilities. Concurrently, there's a discernible shift in client preferences towards comprehensive Quality Assurance (QA) solutions that seamlessly integrate functional, security, and performance testing. The competitive landscape is intensifying, fostering innovation and driving price optimizations that impact profitability. While North America and Europe currently lead in market penetration due to mature IT infrastructures, emerging economies are rapidly catching up, fueled by substantial investments in IT and digital initiatives.
Dominant Markets & Segments in Managed Testing Solutions Industry
North America continues to hold a commanding position in the Managed Testing Solutions market, representing an estimated XX% of global revenue in 2024. This leadership is attributed to substantial IT investments, the early adoption of cutting-edge technologies, and a deep reservoir of skilled testing professionals. Examining the key segments within the market:
- Size of Organization: Large Enterprises constitute the largest segment, driven by their extensive IT budgets, complex application ecosystems, and a consistent demand for high-quality testing.
- End-user Verticals: The Banking, Financial Services, and Insurance (BFSI) and Healthcare sectors remain dominant verticals. This is primarily due to stringent regulatory compliance mandates, the mission-critical nature of their applications, and the paramount importance of data security. The Telecommunications and IT sectors also represent significant contributing segments.
- Type of Delivery Model: The Offshore delivery model is frequently favored for its inherent cost-effectiveness and scalability, enabling access to a wider talent pool. Conversely, Onshore solutions are often preferred for specialized projects requiring rapid turnaround times and close client collaboration.
Key Drivers for Dominant Segments:
- Large Enterprises: Significant IT expenditure, intricate application landscapes, and rigorous quality assurance standards.
- BFSI & Healthcare: The necessity of adhering to strict regulatory frameworks, the critical nature of their software systems, and the absolute requirement for data integrity and privacy.
- Offshore Model: Strategic cost reduction, leverage of global talent, and enhanced scalability of testing operations.
Managed Testing Solutions Industry Product Developments
Recent product innovations include AI-powered test automation tools, cloud-based test environments, and specialized testing solutions for emerging technologies like IoT and blockchain. These innovations improve testing efficiency, reduce costs, and enhance the overall quality of software applications. The key competitive advantage lies in providing customized solutions tailored to specific client needs and integrating the latest technological advancements.
Report Scope & Segmentation Analysis
This report segments the Managed Testing Solutions market by:
Size of Organization: Small & Medium Enterprises (SMEs) and Large Enterprises. SMEs are projected to show a xx% CAGR, driven by increasing digitalization. Large Enterprises, due to the complex applications and higher budgets, contribute the largest market share.
End-user Vertical: Healthcare, BFSI, Telecom and IT, Retail, Government, and Other End-user Verticals. The Healthcare and BFSI sectors are expected to show the highest growth rate due to increasing regulatory pressures and the critical nature of the applications.
Type of Delivery Model: Onshore and Offshore. Offshore models are expected to witness strong growth due to cost advantages and access to a larger talent pool.
Key Drivers of Managed Testing Solutions Industry Growth
The expansion of the Managed Testing Solutions market is underpinned by a confluence of potent factors. The ever-increasing intricacy of software applications necessitates sophisticated and specialized testing methodologies to ensure reliability and performance. The widespread adoption of agile and DevOps methodologies, which emphasize continuous integration and continuous delivery (CI/CD), demands a parallel evolution in testing strategies to support rapid development cycles. Furthermore, stringent regulatory compliance requirements across various industries, particularly in the BFSI and healthcare sectors, create an ongoing demand for expert-driven testing services to ensure adherence to standards. The proliferation of cloud-based technologies has also opened up new avenues and opportunities for specialized cloud-native testing solutions, further contributing to market growth.
Challenges in the Managed Testing Solutions Industry Sector
The Managed Testing Solutions industry faces challenges such as the need for skilled professionals, particularly in specialized areas like security testing and AI-powered testing. Maintaining cost competitiveness in a global market with varying labor costs is also a significant concern. Adapting to rapidly evolving technologies and ensuring the security of sensitive client data are critical challenges for providers. The increasing pressure to deliver faster testing cycles impacts the overall quality of the test outcome.
Emerging Opportunities in Managed Testing Solutions Industry
Emerging opportunities include the growing demand for AI-powered test automation, cloud-based testing solutions, and specialized testing services for new technologies like IoT, blockchain, and 5G. The increasing adoption of DevOps and DevSecOps presents opportunities for integrating security and testing into the software development process. Expansion into underserved markets and addressing niche requirements for specialized industries represent significant growth potentials.
Leading Players in the Managed Testing Solutions Industry Market
- QualiTest
- Testhouse Ltd
- Infosys Limited
- Accenture Plc
- Wipro Limited
- Cognizant
- TATA Consultancy Services Limited
- Hexaware Technologies
- Capgemini SE
- International Business Machines Corporation (IBM)
Key Developments in Managed Testing Solutions Industry Industry
- July 2023: TestingXperts strategically expanded its global footprint by entering the Canadian market, significantly bolstering its presence and service delivery capabilities within North America.
- June 2023: TestingXperts solidified a key Quality Assurance (QA) partnership with a leading provider of AI-based candidate screening services, leveraging its expertise and an offshore delivery model to enhance the client's testing operations.
Strategic Outlook for Managed Testing Solutions Industry Market
The Managed Testing Solutions market is poised for significant growth, driven by ongoing digital transformation, increasing software complexity, and heightened regulatory requirements. Opportunities abound in areas such as AI-powered test automation, cloud-based testing, and specialized testing services for emerging technologies. Companies that invest in innovation, talent development, and strategic partnerships are well-positioned to capitalize on the future growth potential of this dynamic market.
Managed Testing Solutions Industry Segmentation
-
1. Type of Delivery Model
- 1.1. Onshore
- 1.2. Offshore
-
2. Size of Organization
- 2.1. Small & Medium Enterprises
- 2.2. Large Enterprises
-
3. End-user Vertical
- 3.1. Healthcare
- 3.2. BFSI
- 3.3. Telecom and IT
- 3.4. Retail
- 3.5. Government
- 3.6. Other End-user Verticals
Managed Testing Solutions Industry Segmentation By Geography
- 1. North America
- 2. Europe
- 3. Asia Pacific
- 4. South America
- 5. Middle East
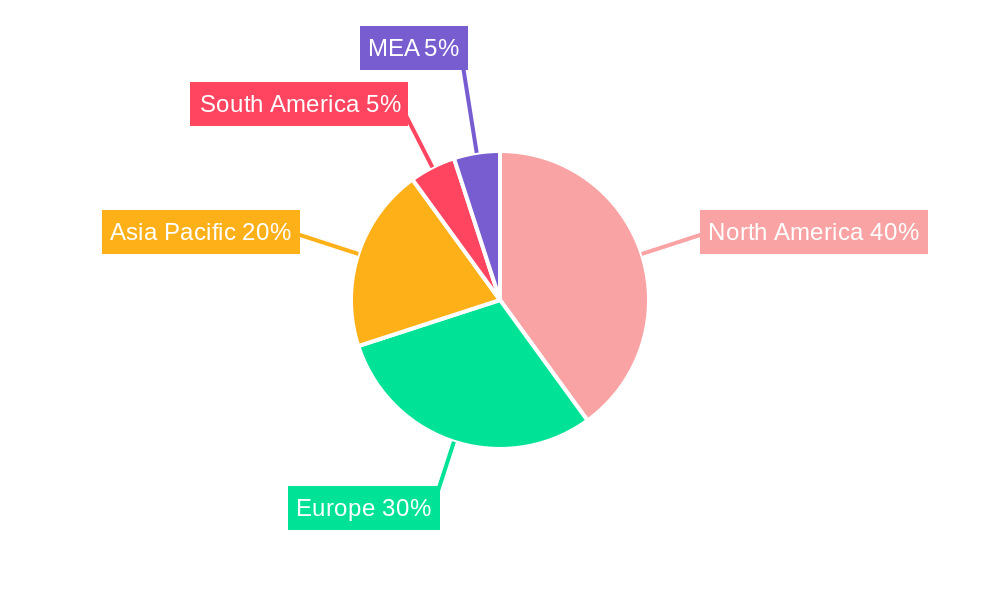
Managed Testing Solutions Industry Regional Market Share
Geographic Coverage of Managed Testing Solutions Industry
Managed Testing Solutions Industry REPORT HIGHLIGHTS
| Aspects | Details |
|---|---|
| Study Period | 2020-2034 |
| Base Year | 2025 |
| Estimated Year | 2026 |
| Forecast Period | 2026-2034 |
| Historical Period | 2020-2025 |
| Growth Rate | CAGR of 8.70% from 2020-2034 |
| Segmentation |
|
Table of Contents
- 1. Introduction
- 1.1. Research Scope
- 1.2. Market Segmentation
- 1.3. Research Objective
- 1.4. Definitions and Assumptions
- 2. Executive Summary
- 2.1. Market Snapshot
- 3. Market Dynamics
- 3.1. Market Drivers
- 3.2. Market Restrains
- 3.3. Market Trends
- 3.4. Market Opportunities
- 4. Market Factor Analysis
- 4.1. Porters Five Forces
- 4.1.1. Bargaining Power of Suppliers
- 4.1.2. Bargaining Power of Buyers
- 4.1.3. Threat of New Entrants
- 4.1.4. Threat of Substitutes
- 4.1.5. Competitive Rivalry
- 4.2. PESTEL analysis
- 4.3. BCG Analysis
- 4.3.1. Stars (High Growth, High Market Share)
- 4.3.2. Cash Cows (Low Growth, High Market Share)
- 4.3.3. Question Mark (High Growth, Low Market Share)
- 4.3.4. Dogs (Low Growth, Low Market Share)
- 4.4. Ansoff Matrix Analysis
- 4.5. Supply Chain Analysis
- 4.6. Regulatory Landscape
- 4.7. Current Market Potential and Opportunity Assessment (TAM–SAM–SOM Framework)
- 4.8. RAX Analyst Note
- 4.1. Porters Five Forces
- 5. Market Analysis, Insights and Forecast 2021-2033
- 5.1. Market Analysis, Insights and Forecast - by Type of Delivery Model
- 5.1.1. Onshore
- 5.1.2. Offshore
- 5.2. Market Analysis, Insights and Forecast - by Size of Organization
- 5.2.1. Small & Medium Enterprises
- 5.2.2. Large Enterprises
- 5.3. Market Analysis, Insights and Forecast - by End-user Vertical
- 5.3.1. Healthcare
- 5.3.2. BFSI
- 5.3.3. Telecom and IT
- 5.3.4. Retail
- 5.3.5. Government
- 5.3.6. Other End-user Verticals
- 5.4. Market Analysis, Insights and Forecast - by Region
- 5.4.1. North America
- 5.4.2. Europe
- 5.4.3. Asia Pacific
- 5.4.4. South America
- 5.4.5. Middle East
- 5.1. Market Analysis, Insights and Forecast - by Type of Delivery Model
- 6. Global Managed Testing Solutions Industry Analysis, Insights and Forecast, 2021-2033
- 6.1. Market Analysis, Insights and Forecast - by Type of Delivery Model
- 6.1.1. Onshore
- 6.1.2. Offshore
- 6.2. Market Analysis, Insights and Forecast - by Size of Organization
- 6.2.1. Small & Medium Enterprises
- 6.2.2. Large Enterprises
- 6.3. Market Analysis, Insights and Forecast - by End-user Vertical
- 6.3.1. Healthcare
- 6.3.2. BFSI
- 6.3.3. Telecom and IT
- 6.3.4. Retail
- 6.3.5. Government
- 6.3.6. Other End-user Verticals
- 6.1. Market Analysis, Insights and Forecast - by Type of Delivery Model
- 7. North America Managed Testing Solutions Industry Analysis, Insights and Forecast, 2020-2032
- 7.1. Market Analysis, Insights and Forecast - by Type of Delivery Model
- 7.1.1. Onshore
- 7.1.2. Offshore
- 7.2. Market Analysis, Insights and Forecast - by Size of Organization
- 7.2.1. Small & Medium Enterprises
- 7.2.2. Large Enterprises
- 7.3. Market Analysis, Insights and Forecast - by End-user Vertical
- 7.3.1. Healthcare
- 7.3.2. BFSI
- 7.3.3. Telecom and IT
- 7.3.4. Retail
- 7.3.5. Government
- 7.3.6. Other End-user Verticals
- 7.1. Market Analysis, Insights and Forecast - by Type of Delivery Model
- 8. Europe Managed Testing Solutions Industry Analysis, Insights and Forecast, 2020-2032
- 8.1. Market Analysis, Insights and Forecast - by Type of Delivery Model
- 8.1.1. Onshore
- 8.1.2. Offshore
- 8.2. Market Analysis, Insights and Forecast - by Size of Organization
- 8.2.1. Small & Medium Enterprises
- 8.2.2. Large Enterprises
- 8.3. Market Analysis, Insights and Forecast - by End-user Vertical
- 8.3.1. Healthcare
- 8.3.2. BFSI
- 8.3.3. Telecom and IT
- 8.3.4. Retail
- 8.3.5. Government
- 8.3.6. Other End-user Verticals
- 8.1. Market Analysis, Insights and Forecast - by Type of Delivery Model
- 9. Asia Pacific Managed Testing Solutions Industry Analysis, Insights and Forecast, 2020-2032
- 9.1. Market Analysis, Insights and Forecast - by Type of Delivery Model
- 9.1.1. Onshore
- 9.1.2. Offshore
- 9.2. Market Analysis, Insights and Forecast - by Size of Organization
- 9.2.1. Small & Medium Enterprises
- 9.2.2. Large Enterprises
- 9.3. Market Analysis, Insights and Forecast - by End-user Vertical
- 9.3.1. Healthcare
- 9.3.2. BFSI
- 9.3.3. Telecom and IT
- 9.3.4. Retail
- 9.3.5. Government
- 9.3.6. Other End-user Verticals
- 9.1. Market Analysis, Insights and Forecast - by Type of Delivery Model
- 10. South America Managed Testing Solutions Industry Analysis, Insights and Forecast, 2020-2032
- 10.1. Market Analysis, Insights and Forecast - by Type of Delivery Model
- 10.1.1. Onshore
- 10.1.2. Offshore
- 10.2. Market Analysis, Insights and Forecast - by Size of Organization
- 10.2.1. Small & Medium Enterprises
- 10.2.2. Large Enterprises
- 10.3. Market Analysis, Insights and Forecast - by End-user Vertical
- 10.3.1. Healthcare
- 10.3.2. BFSI
- 10.3.3. Telecom and IT
- 10.3.4. Retail
- 10.3.5. Government
- 10.3.6. Other End-user Verticals
- 10.1. Market Analysis, Insights and Forecast - by Type of Delivery Model
- 11. Middle East Managed Testing Solutions Industry Analysis, Insights and Forecast, 2020-2032
- 11.1. Market Analysis, Insights and Forecast - by Type of Delivery Model
- 11.1.1. Onshore
- 11.1.2. Offshore
- 11.2. Market Analysis, Insights and Forecast - by Size of Organization
- 11.2.1. Small & Medium Enterprises
- 11.2.2. Large Enterprises
- 11.3. Market Analysis, Insights and Forecast - by End-user Vertical
- 11.3.1. Healthcare
- 11.3.2. BFSI
- 11.3.3. Telecom and IT
- 11.3.4. Retail
- 11.3.5. Government
- 11.3.6. Other End-user Verticals
- 11.1. Market Analysis, Insights and Forecast - by Type of Delivery Model
- 12. Competitive Analysis
- 12.1. Company Profiles
- 12.1.1 QualiTest
- 12.1.1.1. Company Overview
- 12.1.1.2. Products
- 12.1.1.3. Company Financials
- 12.1.1.4. SWOT Analysis
- 12.1.2 Testhouse Ltd
- 12.1.2.1. Company Overview
- 12.1.2.2. Products
- 12.1.2.3. Company Financials
- 12.1.2.4. SWOT Analysis
- 12.1.3 Infosys Limited
- 12.1.3.1. Company Overview
- 12.1.3.2. Products
- 12.1.3.3. Company Financials
- 12.1.3.4. SWOT Analysis
- 12.1.4 Accenture Plc
- 12.1.4.1. Company Overview
- 12.1.4.2. Products
- 12.1.4.3. Company Financials
- 12.1.4.4. SWOT Analysis
- 12.1.5 Wipro Limited
- 12.1.5.1. Company Overview
- 12.1.5.2. Products
- 12.1.5.3. Company Financials
- 12.1.5.4. SWOT Analysis
- 12.1.6 Cognizant
- 12.1.6.1. Company Overview
- 12.1.6.2. Products
- 12.1.6.3. Company Financials
- 12.1.6.4. SWOT Analysis
- 12.1.7 TATA Consultancy Services Limited
- 12.1.7.1. Company Overview
- 12.1.7.2. Products
- 12.1.7.3. Company Financials
- 12.1.7.4. SWOT Analysis
- 12.1.8 Hexaware Technologies
- 12.1.8.1. Company Overview
- 12.1.8.2. Products
- 12.1.8.3. Company Financials
- 12.1.8.4. SWOT Analysis
- 12.1.9 Capgemini SE
- 12.1.9.1. Company Overview
- 12.1.9.2. Products
- 12.1.9.3. Company Financials
- 12.1.9.4. SWOT Analysis
- 12.1.10 International Business Machines Corporation (IBM)
- 12.1.10.1. Company Overview
- 12.1.10.2. Products
- 12.1.10.3. Company Financials
- 12.1.10.4. SWOT Analysis
- 12.1.1 QualiTest
- 12.2. Market Entropy
- 12.2.1 Company's Key Areas Served
- 12.2.2 Recent Developments
- 12.3. Company Market Share Analysis 2025
- 12.3.1 Top 5 Companies Market Share Analysis
- 12.3.2 Top 3 Companies Market Share Analysis
- 12.4. List of Potential Customers
- 13. Research Methodology
List of Figures
- Figure 1: Global Managed Testing Solutions Industry Revenue Breakdown (Million, %) by Region 2025 & 2033
- Figure 2: North America Managed Testing Solutions Industry Revenue (Million), by Type of Delivery Model 2025 & 2033
- Figure 3: North America Managed Testing Solutions Industry Revenue Share (%), by Type of Delivery Model 2025 & 2033
- Figure 4: North America Managed Testing Solutions Industry Revenue (Million), by Size of Organization 2025 & 2033
- Figure 5: North America Managed Testing Solutions Industry Revenue Share (%), by Size of Organization 2025 & 2033
- Figure 6: North America Managed Testing Solutions Industry Revenue (Million), by End-user Vertical 2025 & 2033
- Figure 7: North America Managed Testing Solutions Industry Revenue Share (%), by End-user Vertical 2025 & 2033
- Figure 8: North America Managed Testing Solutions Industry Revenue (Million), by Country 2025 & 2033
- Figure 9: North America Managed Testing Solutions Industry Revenue Share (%), by Country 2025 & 2033
- Figure 10: Europe Managed Testing Solutions Industry Revenue (Million), by Type of Delivery Model 2025 & 2033
- Figure 11: Europe Managed Testing Solutions Industry Revenue Share (%), by Type of Delivery Model 2025 & 2033
- Figure 12: Europe Managed Testing Solutions Industry Revenue (Million), by Size of Organization 2025 & 2033
- Figure 13: Europe Managed Testing Solutions Industry Revenue Share (%), by Size of Organization 2025 & 2033
- Figure 14: Europe Managed Testing Solutions Industry Revenue (Million), by End-user Vertical 2025 & 2033
- Figure 15: Europe Managed Testing Solutions Industry Revenue Share (%), by End-user Vertical 2025 & 2033
- Figure 16: Europe Managed Testing Solutions Industry Revenue (Million), by Country 2025 & 2033
- Figure 17: Europe Managed Testing Solutions Industry Revenue Share (%), by Country 2025 & 2033
- Figure 18: Asia Pacific Managed Testing Solutions Industry Revenue (Million), by Type of Delivery Model 2025 & 2033
- Figure 19: Asia Pacific Managed Testing Solutions Industry Revenue Share (%), by Type of Delivery Model 2025 & 2033
- Figure 20: Asia Pacific Managed Testing Solutions Industry Revenue (Million), by Size of Organization 2025 & 2033
- Figure 21: Asia Pacific Managed Testing Solutions Industry Revenue Share (%), by Size of Organization 2025 & 2033
- Figure 22: Asia Pacific Managed Testing Solutions Industry Revenue (Million), by End-user Vertical 2025 & 2033
- Figure 23: Asia Pacific Managed Testing Solutions Industry Revenue Share (%), by End-user Vertical 2025 & 2033
- Figure 24: Asia Pacific Managed Testing Solutions Industry Revenue (Million), by Country 2025 & 2033
- Figure 25: Asia Pacific Managed Testing Solutions Industry Revenue Share (%), by Country 2025 & 2033
- Figure 26: South America Managed Testing Solutions Industry Revenue (Million), by Type of Delivery Model 2025 & 2033
- Figure 27: South America Managed Testing Solutions Industry Revenue Share (%), by Type of Delivery Model 2025 & 2033
- Figure 28: South America Managed Testing Solutions Industry Revenue (Million), by Size of Organization 2025 & 2033
- Figure 29: South America Managed Testing Solutions Industry Revenue Share (%), by Size of Organization 2025 & 2033
- Figure 30: South America Managed Testing Solutions Industry Revenue (Million), by End-user Vertical 2025 & 2033
- Figure 31: South America Managed Testing Solutions Industry Revenue Share (%), by End-user Vertical 2025 & 2033
- Figure 32: South America Managed Testing Solutions Industry Revenue (Million), by Country 2025 & 2033
- Figure 33: South America Managed Testing Solutions Industry Revenue Share (%), by Country 2025 & 2033
- Figure 34: Middle East Managed Testing Solutions Industry Revenue (Million), by Type of Delivery Model 2025 & 2033
- Figure 35: Middle East Managed Testing Solutions Industry Revenue Share (%), by Type of Delivery Model 2025 & 2033
- Figure 36: Middle East Managed Testing Solutions Industry Revenue (Million), by Size of Organization 2025 & 2033
- Figure 37: Middle East Managed Testing Solutions Industry Revenue Share (%), by Size of Organization 2025 & 2033
- Figure 38: Middle East Managed Testing Solutions Industry Revenue (Million), by End-user Vertical 2025 & 2033
- Figure 39: Middle East Managed Testing Solutions Industry Revenue Share (%), by End-user Vertical 2025 & 2033
- Figure 40: Middle East Managed Testing Solutions Industry Revenue (Million), by Country 2025 & 2033
- Figure 41: Middle East Managed Testing Solutions Industry Revenue Share (%), by Country 2025 & 2033
List of Tables
- Table 1: Global Managed Testing Solutions Industry Revenue Million Forecast, by Type of Delivery Model 2020 & 2033
- Table 2: Global Managed Testing Solutions Industry Revenue Million Forecast, by Size of Organization 2020 & 2033
- Table 3: Global Managed Testing Solutions Industry Revenue Million Forecast, by End-user Vertical 2020 & 2033
- Table 4: Global Managed Testing Solutions Industry Revenue Million Forecast, by Region 2020 & 2033
- Table 5: Global Managed Testing Solutions Industry Revenue Million Forecast, by Type of Delivery Model 2020 & 2033
- Table 6: Global Managed Testing Solutions Industry Revenue Million Forecast, by Size of Organization 2020 & 2033
- Table 7: Global Managed Testing Solutions Industry Revenue Million Forecast, by End-user Vertical 2020 & 2033
- Table 8: Global Managed Testing Solutions Industry Revenue Million Forecast, by Country 2020 & 2033
- Table 9: Global Managed Testing Solutions Industry Revenue Million Forecast, by Type of Delivery Model 2020 & 2033
- Table 10: Global Managed Testing Solutions Industry Revenue Million Forecast, by Size of Organization 2020 & 2033
- Table 11: Global Managed Testing Solutions Industry Revenue Million Forecast, by End-user Vertical 2020 & 2033
- Table 12: Global Managed Testing Solutions Industry Revenue Million Forecast, by Country 2020 & 2033
- Table 13: Global Managed Testing Solutions Industry Revenue Million Forecast, by Type of Delivery Model 2020 & 2033
- Table 14: Global Managed Testing Solutions Industry Revenue Million Forecast, by Size of Organization 2020 & 2033
- Table 15: Global Managed Testing Solutions Industry Revenue Million Forecast, by End-user Vertical 2020 & 2033
- Table 16: Global Managed Testing Solutions Industry Revenue Million Forecast, by Country 2020 & 2033
- Table 17: Global Managed Testing Solutions Industry Revenue Million Forecast, by Type of Delivery Model 2020 & 2033
- Table 18: Global Managed Testing Solutions Industry Revenue Million Forecast, by Size of Organization 2020 & 2033
- Table 19: Global Managed Testing Solutions Industry Revenue Million Forecast, by End-user Vertical 2020 & 2033
- Table 20: Global Managed Testing Solutions Industry Revenue Million Forecast, by Country 2020 & 2033
- Table 21: Global Managed Testing Solutions Industry Revenue Million Forecast, by Type of Delivery Model 2020 & 2033
- Table 22: Global Managed Testing Solutions Industry Revenue Million Forecast, by Size of Organization 2020 & 2033
- Table 23: Global Managed Testing Solutions Industry Revenue Million Forecast, by End-user Vertical 2020 & 2033
- Table 24: Global Managed Testing Solutions Industry Revenue Million Forecast, by Country 2020 & 2033
Frequently Asked Questions
1. What is the projected Compound Annual Growth Rate (CAGR) of the Managed Testing Solutions Industry?
The projected CAGR is approximately 8.70%.
2. Which companies are prominent players in the Managed Testing Solutions Industry?
Key companies in the market include QualiTest, Testhouse Ltd, Infosys Limited, Accenture Plc, Wipro Limited, Cognizant, TATA Consultancy Services Limited, Hexaware Technologies, Capgemini SE, International Business Machines Corporation (IBM).
3. What are the main segments of the Managed Testing Solutions Industry?
The market segments include Type of Delivery Model, Size of Organization, End-user Vertical.
4. Can you provide details about the market size?
The market size is estimated to be USD 302.53 Million as of 2022.
5. What are some drivers contributing to market growth?
Adopting artificial intelligence (AI) and cloud management is eventually helping organizations meet various functional business requirements while driving business process optimization.; The growing preference for outsourcing management functions to cloud service providers and managed service providers is expected to drive market growth..
6. What are the notable trends driving market growth?
Healthcare to Witness the Highest Growth.
7. Are there any restraints impacting market growth?
The market's need for more skilled labor is a significant challenge. Understanding customer requirements and selecting the best testing method required specialized knowledge..
8. Can you provide examples of recent developments in the market?
July 2023 - TestingXperts, a software testing and quality assurance company, is pleased to announce its further expansion into Canada, strengthening its presence in the North American market. The decision to expand into Canada aligns with the company's strategic vision to cater to the region's growing demand for Quality Engineering and software testing services.
9. What pricing options are available for accessing the report?
Pricing options include single-user, multi-user, and enterprise licenses priced at USD 4750, USD 5250, and USD 8750 respectively.
10. Is the market size provided in terms of value or volume?
The market size is provided in terms of value, measured in Million.
11. Are there any specific market keywords associated with the report?
Yes, the market keyword associated with the report is "Managed Testing Solutions Industry," which aids in identifying and referencing the specific market segment covered.
12. How do I determine which pricing option suits my needs best?
The pricing options vary based on user requirements and access needs. Individual users may opt for single-user licenses, while businesses requiring broader access may choose multi-user or enterprise licenses for cost-effective access to the report.
13. Are there any additional resources or data provided in the Managed Testing Solutions Industry report?
While the report offers comprehensive insights, it's advisable to review the specific contents or supplementary materials provided to ascertain if additional resources or data are available.
14. How can I stay updated on further developments or reports in the Managed Testing Solutions Industry?
To stay informed about further developments, trends, and reports in the Managed Testing Solutions Industry, consider subscribing to industry newsletters, following relevant companies and organizations, or regularly checking reputable industry news sources and publications.
Methodology
Step 1 - Identification of Relevant Samples Size from Population Database


Step 2 - Approaches for Defining Global Market Size (Value, Volume* & Price*)

Note*: In applicable scenarios
Step 3 - Data Sources
Primary Research
- Web Analytics
- Survey Reports
- Research Institute
- Latest Research Reports
- Opinion Leaders
Secondary Research
- Annual Reports
- White Paper
- Latest Press Release
- Industry Association
- Paid Database
- Investor Presentations

Step 4 - Data Triangulation
Involves using different sources of information in order to increase the validity of a study
These sources are likely to be stakeholders in a program - participants, other researchers, program staff, other community members, and so on.
Then we put all data in single framework & apply various statistical tools to find out the dynamic on the market.
During the analysis stage, feedback from the stakeholder groups would be compared to determine areas of agreement as well as areas of divergence