

Key Insights
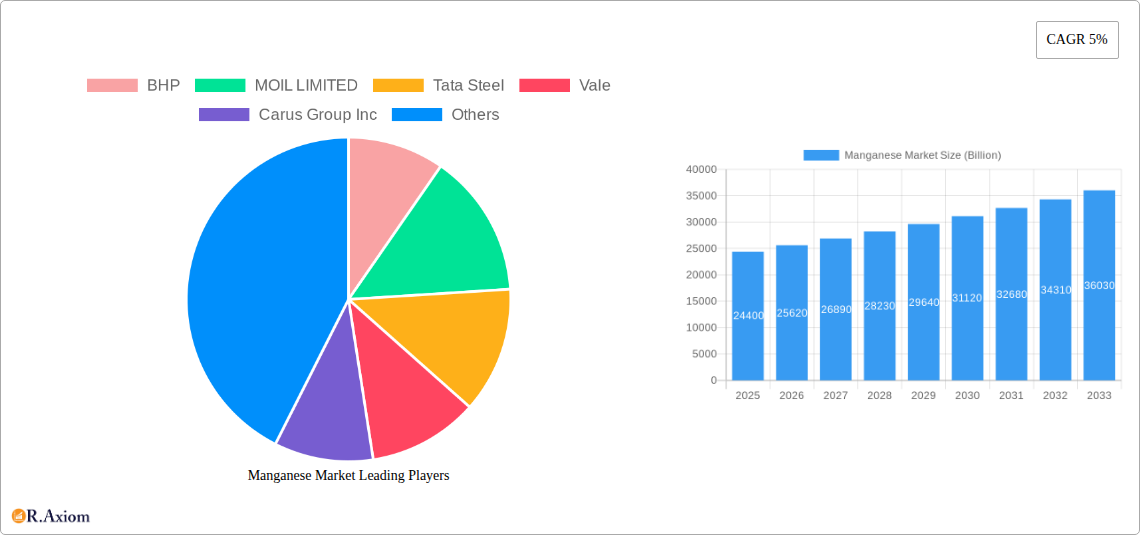
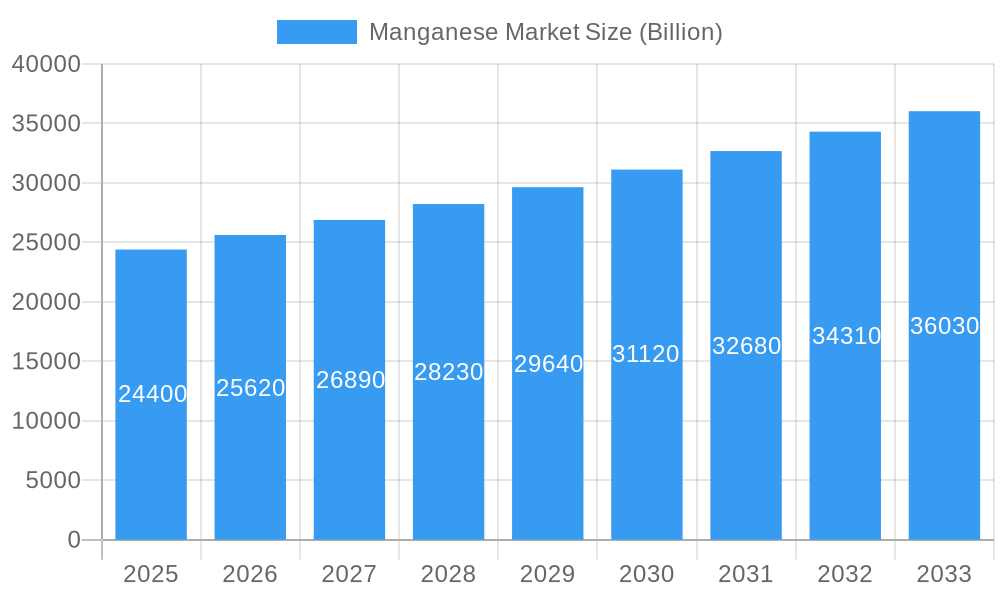
The global Manganese Market is poised for significant expansion, projected to reach a substantial value of $24.4 billion. This growth will be propelled by a compound annual growth rate (CAGR) of 5% over the forecast period of 2025-2033. Key drivers fueling this upward trajectory include the escalating demand from the steel industry, where manganese is an indispensable alloying agent, and the burgeoning need for manganese in advanced battery technologies, particularly for electric vehicles and grid-scale energy storage. The increasing industrialization across developing economies and the ongoing advancements in material science are also anticipated to contribute to market expansion. Furthermore, the construction sector's continuous development and the global push towards cleaner energy solutions will create sustained demand for manganese-based products.
Manganese Market Market Size (In Billion)
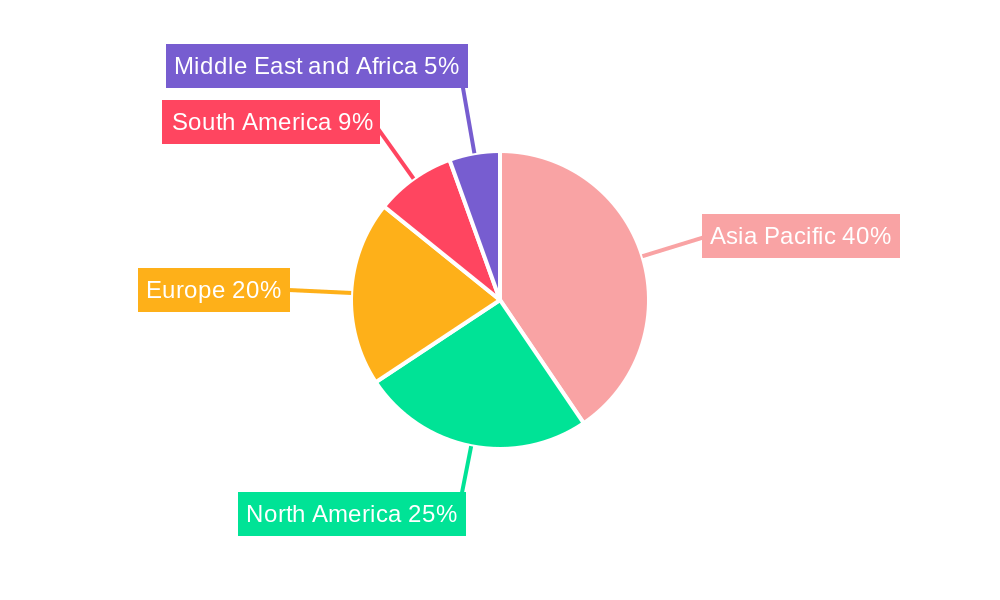
The market's segmentation reveals a diversified application landscape, with Alloys, Electrolytic Manganese Dioxide (EMD), and Electrolytic Manganese Metals representing the primary consumption areas. EMD, in particular, is experiencing robust growth due to its critical role in alkaline and lithium-ion batteries. The End-use Sector analysis highlights the Industrial and Power Storage and Electricity segments as major contributors to market value. Geographically, the Asia Pacific region, led by China and India, is expected to dominate the market owing to its vast manufacturing base and rapid economic development. However, North America and Europe are also significant markets, driven by technological innovation and increasing investments in renewable energy infrastructure. Emerging restraints, such as fluctuating raw material prices and stringent environmental regulations concerning mining operations, will require strategic mitigation by market participants to ensure sustained profitability and market stability.
Manganese Market Company Market Share
This comprehensive report provides an in-depth analysis of the global Manganese Market from 2019 to 2033, with a base year of 2025. It offers critical insights into market dynamics, growth drivers, challenges, and emerging opportunities, equipping industry stakeholders with actionable intelligence for strategic decision-making. The study leverages extensive historical data (2019-2024) and detailed forecasts (2025-2033) to present a robust market outlook.
Manganese Market Market Concentration & Innovation
The Manganese Market exhibits moderate to high concentration, with a few key players dominating global production and supply. Major contributors like BHP, MOIL LIMITED, Tata Steel, Vale, and Carus Group Inc. wield significant market share. Innovation in the manganese sector is primarily driven by advancements in mining extraction efficiency, beneficiation techniques, and the development of high-purity manganese products for specialized applications, particularly in the rapidly growing battery sector. Regulatory frameworks, though varying by region, generally focus on environmental impact mitigation and sustainable mining practices, influencing operational strategies. Product substitutes for manganese exist, primarily in certain steel alloys, but its unique properties in stainless steel and batteries limit widespread substitution. End-user trends are increasingly leaning towards demand for high-performance alloys and battery-grade manganese dioxide, fueled by the automotive and electronics industries. Merger and acquisition (M&A) activities are strategic, often aimed at securing raw material supply chains or expanding into higher-value downstream applications. M&A deal values in recent years have seen significant figures, often in the billions, reflecting the strategic importance of manganese assets.
Manganese Market Industry Trends & Insights
The Manganese Market is poised for substantial growth, driven by a confluence of technological advancements, evolving consumer preferences, and burgeoning end-use sectors. The Compound Annual Growth Rate (CAGR) for the forecast period is projected to be robust, indicating significant expansion. A primary growth driver is the escalating demand from the Power Storage and Electricity sector, specifically for lithium-ion batteries. The increasing adoption of electric vehicles (EVs) globally necessitates a higher supply of battery-grade manganese dioxide (EMD), a key component in cathode materials. This surge in EV sales directly translates into a higher market penetration for manganese in this critical application.
Furthermore, the Industrial and Construction sectors continue to be significant consumers of manganese, primarily for its use in steel alloys. The strengthening of infrastructure development initiatives in emerging economies, coupled with the ongoing demand for high-strength, corrosion-resistant steels in construction projects, underpins consistent growth in these segments. Technological disruptions are also shaping the market. Innovations in mining and processing technologies are leading to improved recovery rates and the production of higher-purity manganese products, thereby reducing operational costs and enhancing product quality. This efficiency gain is crucial for maintaining competitiveness.
Consumer preferences are subtly shifting, with an increasing awareness and demand for products manufactured using sustainable and ethically sourced materials. This trend may favor producers who can demonstrate responsible mining practices and a lower environmental footprint. The competitive dynamics within the Manganese Market are characterized by a mix of large, vertically integrated mining giants and specialized producers of electrolytic manganese and its derivatives. Strategic partnerships and joint ventures are becoming increasingly common as companies seek to secure raw material access, expand their geographical reach, and invest in cutting-edge research and development. The global market penetration of manganese is steadily increasing across various applications, reflecting its indispensable role in modern industrial and technological landscapes.
Dominant Markets & Segments in Manganese Market
The Manganese Market is characterized by regional dominance and segment-specific growth patterns. Asia Pacific, particularly China, consistently emerges as the leading region due to its substantial manufacturing base, particularly in steel production and the burgeoning battery industry. Government policies supporting industrial growth and infrastructure development further bolster this dominance. Within this region, countries like India and Australia are also significant players in both production and consumption.
Application Segment Dominance:
- Alloys: This segment holds a commanding position in the global Manganese Market. The extensive use of manganese in the production of steel, especially stainless steel and carbon steel, drives its demand. Steel alloys contribute to enhanced strength, hardness, and corrosion resistance, making them indispensable in infrastructure projects, automotive manufacturing, and heavy machinery. Economic policies that promote industrialization and construction directly influence the demand for steel alloys, thus underpinning the dominance of this segment.
- Electrolytic Manganese Dioxide (EMD): The rapid expansion of the Power Storage and Electricity sector, driven by the electric vehicle revolution and the growing need for portable electronics, has propelled EMD into a position of critical importance. The superior electrochemical properties of EMD make it a preferred material for the cathodes of alkaline and lithium-ion batteries. Forecasts indicate this segment will experience the highest growth trajectory in the coming years.
- Electrolytic Manganese Metals (EMM): While not as large as the alloys segment, EMM plays a crucial role in specialized applications, including the production of certain high-purity alloys, stainless steel grades, and as a reducing agent. Its demand is closely linked to advancements in niche industrial processes and the development of specialized materials.
- Other Applications: This encompasses a diverse range of uses, including agricultural micronutrients, water treatment chemicals, and fireworks. While individually smaller, collectively, these applications contribute to market diversification and stability.
End-use Sector Dominance:
- Industrial: This remains a cornerstone of the Manganese Market, encompassing steel manufacturing, chemical production, and other manufacturing processes. The sheer volume of manganese consumed by heavy industries solidifies its dominant position.
- Construction: Directly linked to the Alloys segment, the construction sector's demand for steel in building, infrastructure, and renovation projects is a perpetual driver. Urbanization and infrastructure development projects, particularly in emerging economies, are key economic policies influencing this sector's manganese consumption.
- Power Storage and Electricity: As mentioned, this sector is experiencing exponential growth. The transition to renewable energy sources and the widespread adoption of EVs are creating unprecedented demand for battery-grade manganese. This segment is expected to witness significant market share gains and is a key area for future growth.
- Other End-use Sectors: This includes automotive (beyond structural steel, e.g., in certain electronic components), electronics, and agriculture. While these sectors contribute to overall demand, their current impact on the total Manganese Market size is less pronounced compared to the leading sectors.
The interplay of these dominant regions and segments, supported by favorable economic policies and continuous technological advancements, dictates the overall trajectory and profitability within the global Manganese Market.
Manganese Market Product Developments
Product developments in the Manganese Market are largely centered on enhancing purity and performance for specialized applications, particularly in the battery sector. Innovations in electrolytic manganese dioxide (EMD) are yielding higher energy densities and longer lifespans for lithium-ion batteries, a critical advantage in the EV market. Advancements in high-purity manganese metal production cater to the demand for specialized alloys in aerospace and electronics. Furthermore, research into novel manganese-based cathode materials for next-generation batteries promises to further expand market reach. These developments aim to improve cost-effectiveness, reduce environmental impact, and unlock new application frontiers, giving companies a competitive edge.
Report Scope & Segmentation Analysis
This report provides a comprehensive analysis of the global Manganese Market, meticulously segmented across key areas to offer granular insights. The segmentation includes:
Application: This report delves into the market dynamics for Alloys, Electrolytic Manganese Dioxide (EMD), Electrolytic Manganese Metals (EMM), and Other Applications. Each segment's growth projections, current market size, and competitive landscape are detailed, with Alloys and EMD expected to lead in terms of volume and growth respectively.
End-use Sector: The analysis further segments the market by Industrial, Construction, Power Storage and Electricity, and Other End-use Sectors. Detailed evaluations of each sector's current contribution and future potential are provided. The Power Storage and Electricity sector is projected to exhibit the most aggressive growth, driven by the EV revolution, while the Industrial and Construction sectors will continue to represent substantial, stable demand.
Key Drivers of Manganese Market Growth
The Manganese Market is propelled by several synergistic growth drivers. The accelerating global transition towards electric vehicles (EVs) is a paramount driver, directly fueling the demand for battery-grade Electrolytic Manganese Dioxide (EMD) for cathode materials. Technological advancements in battery chemistry are continuously improving the performance and cost-effectiveness of manganese-based batteries. Furthermore, sustained infrastructure development projects worldwide, particularly in emerging economies, necessitate significant quantities of steel alloys, where manganese plays a crucial role in enhancing strength and durability. Government initiatives promoting industrialization and the demand for high-strength, lightweight materials in various manufacturing sectors also contribute significantly. Economic stability and growth in key industrial regions directly correlate with increased manganese consumption.
Challenges in the Manganese Market Sector
Despite robust growth prospects, the Manganese Market faces several challenges. Volatility in commodity prices, influenced by global supply-demand dynamics and geopolitical factors, can impact profitability for producers. Strict environmental regulations and the increasing focus on sustainable mining practices necessitate significant investment in cleaner technologies and compliance measures, potentially increasing operational costs. Supply chain disruptions, exacerbated by logistical bottlenecks and trade uncertainties, can affect the timely availability of manganese ore and processed products. Moreover, the development of alternative materials or battery chemistries that reduce manganese dependency, though currently limited, poses a long-term competitive threat.
Emerging Opportunities in Manganese Market
The Manganese Market is ripe with emerging opportunities. The surging demand for high-performance batteries for EVs and grid-scale energy storage systems presents a significant avenue for growth, particularly for high-purity EMD. Innovations in manganese-based alloys for lightweighting in the automotive and aerospace industries offer new application potentials. Furthermore, the increasing focus on recycling and circular economy principles presents opportunities for developing efficient manganese recovery processes from spent batteries and industrial waste. Emerging economies, with their expanding industrial bases and infrastructure projects, represent untapped markets with substantial future demand.
Leading Players in the Manganese Market Market
BHP MOIL LIMITED Tata Steel Vale Carus Group Inc Jupiter Mines Limited Sibelco Mesa Minerals Limited NIPPON DENKO CO LTD Ningxia Tianyuan Manganese Industry Group Co Ltd Eramet Anglo American PLC Assore Limited (Assmang Proprietary Limited)
Key Developments in Manganese Market Industry
- August 2020: South32 Ltd. announced the sale of its entire stake in the manganese alloy smelter, Tasmanian Electro Metallurgical Company (TEMCO) to UK-based conglomerate GFG Alliance, thereby enhancing the business of GFG Alliance.
Strategic Outlook for Manganese Market Market
The strategic outlook for the Manganese Market is overwhelmingly positive, driven by the indispensable role of manganese in critical growth sectors. The ongoing global energy transition and the exponential rise of electric vehicles will continue to be the primary catalyst, significantly boosting demand for high-purity Electrolytic Manganese Dioxide (EMD). Continued investments in infrastructure and industrial expansion, particularly in emerging economies, will sustain strong demand from the steel alloys segment. Companies focusing on technological innovation to improve extraction efficiency, develop advanced battery materials, and adhere to stringent sustainability standards will be best positioned for future success. Strategic collaborations and vertical integration will likely intensify as players seek to secure supply chains and capture value across the entire manganese lifecycle. The market is expected to witness robust growth and evolving competitive dynamics.
Manganese Market Segmentation
-
1. Application
- 1.1. Alloys
- 1.2. Electrolytic Manganese Dioxide
- 1.3. Electrolytic Manganese Metals
- 1.4. Other Applications
-
2. End-use Sector
- 2.1. Industrial
- 2.2. Construction
- 2.3. Power Storage and Electricity
- 2.4. Other End-use Sectors
Manganese Market Segmentation By Geography
-
1. Asia Pacific
- 1.1. China
- 1.2. India
- 1.3. Japan
- 1.4. South Korea
- 1.5. Rest of Asia Pacific
-
2. North America
- 2.1. United States
- 2.2. Canada
- 2.3. Mexico
-
3. Europe
- 3.1. Germany
- 3.2. United Kingdom
- 3.3. Italy
- 3.4. France
- 3.5. Rest of Europe
-
4. South America
- 4.1. Brazil
- 4.2. Argentina
- 4.3. Rest of South America
-
5. Middle East and Africa
- 5.1. Saudi Arabia
- 5.2. South Africa
- 5.3. Rest of Middle East and Africa
Manganese Market Regional Market Share
Geographic Coverage of Manganese Market
Manganese Market REPORT HIGHLIGHTS
| Aspects | Details |
|---|---|
| Study Period | 2020-2034 |
| Base Year | 2025 |
| Estimated Year | 2026 |
| Forecast Period | 2026-2034 |
| Historical Period | 2020-2025 |
| Growth Rate | CAGR of 5% from 2020-2034 |
| Segmentation |
|
Table of Contents
- 1. Introduction
- 1.1. Research Scope
- 1.2. Market Segmentation
- 1.3. Research Objective
- 1.4. Definitions and Assumptions
- 2. Executive Summary
- 2.1. Market Snapshot
- 3. Market Dynamics
- 3.1. Market Drivers
- 3.2. Market Restrains
- 3.3. Market Trends
- 3.4. Market Opportunities
- 4. Market Factor Analysis
- 4.1. Porters Five Forces
- 4.1.1. Bargaining Power of Suppliers
- 4.1.2. Bargaining Power of Buyers
- 4.1.3. Threat of New Entrants
- 4.1.4. Threat of Substitutes
- 4.1.5. Competitive Rivalry
- 4.2. PESTEL analysis
- 4.3. BCG Analysis
- 4.3.1. Stars (High Growth, High Market Share)
- 4.3.2. Cash Cows (Low Growth, High Market Share)
- 4.3.3. Question Mark (High Growth, Low Market Share)
- 4.3.4. Dogs (Low Growth, Low Market Share)
- 4.4. Ansoff Matrix Analysis
- 4.5. Supply Chain Analysis
- 4.6. Regulatory Landscape
- 4.7. Current Market Potential and Opportunity Assessment (TAM–SAM–SOM Framework)
- 4.8. RAX Analyst Note
- 4.1. Porters Five Forces
- 5. Market Analysis, Insights and Forecast 2021-2033
- 5.1. Market Analysis, Insights and Forecast - by Application
- 5.1.1. Alloys
- 5.1.2. Electrolytic Manganese Dioxide
- 5.1.3. Electrolytic Manganese Metals
- 5.1.4. Other Applications
- 5.2. Market Analysis, Insights and Forecast - by End-use Sector
- 5.2.1. Industrial
- 5.2.2. Construction
- 5.2.3. Power Storage and Electricity
- 5.2.4. Other End-use Sectors
- 5.3. Market Analysis, Insights and Forecast - by Region
- 5.3.1. Asia Pacific
- 5.3.2. North America
- 5.3.3. Europe
- 5.3.4. South America
- 5.3.5. Middle East and Africa
- 5.1. Market Analysis, Insights and Forecast - by Application
- 6. Global Manganese Market Analysis, Insights and Forecast, 2021-2033
- 6.1. Market Analysis, Insights and Forecast - by Application
- 6.1.1. Alloys
- 6.1.2. Electrolytic Manganese Dioxide
- 6.1.3. Electrolytic Manganese Metals
- 6.1.4. Other Applications
- 6.2. Market Analysis, Insights and Forecast - by End-use Sector
- 6.2.1. Industrial
- 6.2.2. Construction
- 6.2.3. Power Storage and Electricity
- 6.2.4. Other End-use Sectors
- 6.1. Market Analysis, Insights and Forecast - by Application
- 7. Asia Pacific Manganese Market Analysis, Insights and Forecast, 2020-2032
- 7.1. Market Analysis, Insights and Forecast - by Application
- 7.1.1. Alloys
- 7.1.2. Electrolytic Manganese Dioxide
- 7.1.3. Electrolytic Manganese Metals
- 7.1.4. Other Applications
- 7.2. Market Analysis, Insights and Forecast - by End-use Sector
- 7.2.1. Industrial
- 7.2.2. Construction
- 7.2.3. Power Storage and Electricity
- 7.2.4. Other End-use Sectors
- 7.1. Market Analysis, Insights and Forecast - by Application
- 8. North America Manganese Market Analysis, Insights and Forecast, 2020-2032
- 8.1. Market Analysis, Insights and Forecast - by Application
- 8.1.1. Alloys
- 8.1.2. Electrolytic Manganese Dioxide
- 8.1.3. Electrolytic Manganese Metals
- 8.1.4. Other Applications
- 8.2. Market Analysis, Insights and Forecast - by End-use Sector
- 8.2.1. Industrial
- 8.2.2. Construction
- 8.2.3. Power Storage and Electricity
- 8.2.4. Other End-use Sectors
- 8.1. Market Analysis, Insights and Forecast - by Application
- 9. Europe Manganese Market Analysis, Insights and Forecast, 2020-2032
- 9.1. Market Analysis, Insights and Forecast - by Application
- 9.1.1. Alloys
- 9.1.2. Electrolytic Manganese Dioxide
- 9.1.3. Electrolytic Manganese Metals
- 9.1.4. Other Applications
- 9.2. Market Analysis, Insights and Forecast - by End-use Sector
- 9.2.1. Industrial
- 9.2.2. Construction
- 9.2.3. Power Storage and Electricity
- 9.2.4. Other End-use Sectors
- 9.1. Market Analysis, Insights and Forecast - by Application
- 10. South America Manganese Market Analysis, Insights and Forecast, 2020-2032
- 10.1. Market Analysis, Insights and Forecast - by Application
- 10.1.1. Alloys
- 10.1.2. Electrolytic Manganese Dioxide
- 10.1.3. Electrolytic Manganese Metals
- 10.1.4. Other Applications
- 10.2. Market Analysis, Insights and Forecast - by End-use Sector
- 10.2.1. Industrial
- 10.2.2. Construction
- 10.2.3. Power Storage and Electricity
- 10.2.4. Other End-use Sectors
- 10.1. Market Analysis, Insights and Forecast - by Application
- 11. Middle East and Africa Manganese Market Analysis, Insights and Forecast, 2020-2032
- 11.1. Market Analysis, Insights and Forecast - by Application
- 11.1.1. Alloys
- 11.1.2. Electrolytic Manganese Dioxide
- 11.1.3. Electrolytic Manganese Metals
- 11.1.4. Other Applications
- 11.2. Market Analysis, Insights and Forecast - by End-use Sector
- 11.2.1. Industrial
- 11.2.2. Construction
- 11.2.3. Power Storage and Electricity
- 11.2.4. Other End-use Sectors
- 11.1. Market Analysis, Insights and Forecast - by Application
- 12. Competitive Analysis
- 12.1. Company Profiles
- 12.1.1 BHP
- 12.1.1.1. Company Overview
- 12.1.1.2. Products
- 12.1.1.3. Company Financials
- 12.1.1.4. SWOT Analysis
- 12.1.2 MOIL LIMITED
- 12.1.2.1. Company Overview
- 12.1.2.2. Products
- 12.1.2.3. Company Financials
- 12.1.2.4. SWOT Analysis
- 12.1.3 Tata Steel
- 12.1.3.1. Company Overview
- 12.1.3.2. Products
- 12.1.3.3. Company Financials
- 12.1.3.4. SWOT Analysis
- 12.1.4 Vale
- 12.1.4.1. Company Overview
- 12.1.4.2. Products
- 12.1.4.3. Company Financials
- 12.1.4.4. SWOT Analysis
- 12.1.5 Carus Group Inc
- 12.1.5.1. Company Overview
- 12.1.5.2. Products
- 12.1.5.3. Company Financials
- 12.1.5.4. SWOT Analysis
- 12.1.6 Jupiter Mines Limited
- 12.1.6.1. Company Overview
- 12.1.6.2. Products
- 12.1.6.3. Company Financials
- 12.1.6.4. SWOT Analysis
- 12.1.7 Sibelco
- 12.1.7.1. Company Overview
- 12.1.7.2. Products
- 12.1.7.3. Company Financials
- 12.1.7.4. SWOT Analysis
- 12.1.8 Mesa Minerals Limited
- 12.1.8.1. Company Overview
- 12.1.8.2. Products
- 12.1.8.3. Company Financials
- 12.1.8.4. SWOT Analysis
- 12.1.9 NIPPON DENKO CO LTD
- 12.1.9.1. Company Overview
- 12.1.9.2. Products
- 12.1.9.3. Company Financials
- 12.1.9.4. SWOT Analysis
- 12.1.10 Ningxia Tianyuan Manganese Industry Group Co Ltd
- 12.1.10.1. Company Overview
- 12.1.10.2. Products
- 12.1.10.3. Company Financials
- 12.1.10.4. SWOT Analysis
- 12.1.11 Eramet
- 12.1.11.1. Company Overview
- 12.1.11.2. Products
- 12.1.11.3. Company Financials
- 12.1.11.4. SWOT Analysis
- 12.1.12 Anglo American PLC
- 12.1.12.1. Company Overview
- 12.1.12.2. Products
- 12.1.12.3. Company Financials
- 12.1.12.4. SWOT Analysis
- 12.1.13 Assore Limited (Assmang Proprietary Limited)
- 12.1.13.1. Company Overview
- 12.1.13.2. Products
- 12.1.13.3. Company Financials
- 12.1.13.4. SWOT Analysis
- 12.1.1 BHP
- 12.2. Market Entropy
- 12.2.1 Company's Key Areas Served
- 12.2.2 Recent Developments
- 12.3. Company Market Share Analysis 2025
- 12.3.1 Top 5 Companies Market Share Analysis
- 12.3.2 Top 3 Companies Market Share Analysis
- 12.4. List of Potential Customers
- 13. Research Methodology
List of Figures
- Figure 1: Global Manganese Market Revenue Breakdown (Billion, %) by Region 2025 & 2033
- Figure 2: Global Manganese Market Volume Breakdown (K Tons, %) by Region 2025 & 2033
- Figure 3: Asia Pacific Manganese Market Revenue (Billion), by Application 2025 & 2033
- Figure 4: Asia Pacific Manganese Market Volume (K Tons), by Application 2025 & 2033
- Figure 5: Asia Pacific Manganese Market Revenue Share (%), by Application 2025 & 2033
- Figure 6: Asia Pacific Manganese Market Volume Share (%), by Application 2025 & 2033
- Figure 7: Asia Pacific Manganese Market Revenue (Billion), by End-use Sector 2025 & 2033
- Figure 8: Asia Pacific Manganese Market Volume (K Tons), by End-use Sector 2025 & 2033
- Figure 9: Asia Pacific Manganese Market Revenue Share (%), by End-use Sector 2025 & 2033
- Figure 10: Asia Pacific Manganese Market Volume Share (%), by End-use Sector 2025 & 2033
- Figure 11: Asia Pacific Manganese Market Revenue (Billion), by Country 2025 & 2033
- Figure 12: Asia Pacific Manganese Market Volume (K Tons), by Country 2025 & 2033
- Figure 13: Asia Pacific Manganese Market Revenue Share (%), by Country 2025 & 2033
- Figure 14: Asia Pacific Manganese Market Volume Share (%), by Country 2025 & 2033
- Figure 15: North America Manganese Market Revenue (Billion), by Application 2025 & 2033
- Figure 16: North America Manganese Market Volume (K Tons), by Application 2025 & 2033
- Figure 17: North America Manganese Market Revenue Share (%), by Application 2025 & 2033
- Figure 18: North America Manganese Market Volume Share (%), by Application 2025 & 2033
- Figure 19: North America Manganese Market Revenue (Billion), by End-use Sector 2025 & 2033
- Figure 20: North America Manganese Market Volume (K Tons), by End-use Sector 2025 & 2033
- Figure 21: North America Manganese Market Revenue Share (%), by End-use Sector 2025 & 2033
- Figure 22: North America Manganese Market Volume Share (%), by End-use Sector 2025 & 2033
- Figure 23: North America Manganese Market Revenue (Billion), by Country 2025 & 2033
- Figure 24: North America Manganese Market Volume (K Tons), by Country 2025 & 2033
- Figure 25: North America Manganese Market Revenue Share (%), by Country 2025 & 2033
- Figure 26: North America Manganese Market Volume Share (%), by Country 2025 & 2033
- Figure 27: Europe Manganese Market Revenue (Billion), by Application 2025 & 2033
- Figure 28: Europe Manganese Market Volume (K Tons), by Application 2025 & 2033
- Figure 29: Europe Manganese Market Revenue Share (%), by Application 2025 & 2033
- Figure 30: Europe Manganese Market Volume Share (%), by Application 2025 & 2033
- Figure 31: Europe Manganese Market Revenue (Billion), by End-use Sector 2025 & 2033
- Figure 32: Europe Manganese Market Volume (K Tons), by End-use Sector 2025 & 2033
- Figure 33: Europe Manganese Market Revenue Share (%), by End-use Sector 2025 & 2033
- Figure 34: Europe Manganese Market Volume Share (%), by End-use Sector 2025 & 2033
- Figure 35: Europe Manganese Market Revenue (Billion), by Country 2025 & 2033
- Figure 36: Europe Manganese Market Volume (K Tons), by Country 2025 & 2033
- Figure 37: Europe Manganese Market Revenue Share (%), by Country 2025 & 2033
- Figure 38: Europe Manganese Market Volume Share (%), by Country 2025 & 2033
- Figure 39: South America Manganese Market Revenue (Billion), by Application 2025 & 2033
- Figure 40: South America Manganese Market Volume (K Tons), by Application 2025 & 2033
- Figure 41: South America Manganese Market Revenue Share (%), by Application 2025 & 2033
- Figure 42: South America Manganese Market Volume Share (%), by Application 2025 & 2033
- Figure 43: South America Manganese Market Revenue (Billion), by End-use Sector 2025 & 2033
- Figure 44: South America Manganese Market Volume (K Tons), by End-use Sector 2025 & 2033
- Figure 45: South America Manganese Market Revenue Share (%), by End-use Sector 2025 & 2033
- Figure 46: South America Manganese Market Volume Share (%), by End-use Sector 2025 & 2033
- Figure 47: South America Manganese Market Revenue (Billion), by Country 2025 & 2033
- Figure 48: South America Manganese Market Volume (K Tons), by Country 2025 & 2033
- Figure 49: South America Manganese Market Revenue Share (%), by Country 2025 & 2033
- Figure 50: South America Manganese Market Volume Share (%), by Country 2025 & 2033
- Figure 51: Middle East and Africa Manganese Market Revenue (Billion), by Application 2025 & 2033
- Figure 52: Middle East and Africa Manganese Market Volume (K Tons), by Application 2025 & 2033
- Figure 53: Middle East and Africa Manganese Market Revenue Share (%), by Application 2025 & 2033
- Figure 54: Middle East and Africa Manganese Market Volume Share (%), by Application 2025 & 2033
- Figure 55: Middle East and Africa Manganese Market Revenue (Billion), by End-use Sector 2025 & 2033
- Figure 56: Middle East and Africa Manganese Market Volume (K Tons), by End-use Sector 2025 & 2033
- Figure 57: Middle East and Africa Manganese Market Revenue Share (%), by End-use Sector 2025 & 2033
- Figure 58: Middle East and Africa Manganese Market Volume Share (%), by End-use Sector 2025 & 2033
- Figure 59: Middle East and Africa Manganese Market Revenue (Billion), by Country 2025 & 2033
- Figure 60: Middle East and Africa Manganese Market Volume (K Tons), by Country 2025 & 2033
- Figure 61: Middle East and Africa Manganese Market Revenue Share (%), by Country 2025 & 2033
- Figure 62: Middle East and Africa Manganese Market Volume Share (%), by Country 2025 & 2033
List of Tables
- Table 1: Global Manganese Market Revenue Billion Forecast, by Application 2020 & 2033
- Table 2: Global Manganese Market Volume K Tons Forecast, by Application 2020 & 2033
- Table 3: Global Manganese Market Revenue Billion Forecast, by End-use Sector 2020 & 2033
- Table 4: Global Manganese Market Volume K Tons Forecast, by End-use Sector 2020 & 2033
- Table 5: Global Manganese Market Revenue Billion Forecast, by Region 2020 & 2033
- Table 6: Global Manganese Market Volume K Tons Forecast, by Region 2020 & 2033
- Table 7: Global Manganese Market Revenue Billion Forecast, by Application 2020 & 2033
- Table 8: Global Manganese Market Volume K Tons Forecast, by Application 2020 & 2033
- Table 9: Global Manganese Market Revenue Billion Forecast, by End-use Sector 2020 & 2033
- Table 10: Global Manganese Market Volume K Tons Forecast, by End-use Sector 2020 & 2033
- Table 11: Global Manganese Market Revenue Billion Forecast, by Country 2020 & 2033
- Table 12: Global Manganese Market Volume K Tons Forecast, by Country 2020 & 2033
- Table 13: China Manganese Market Revenue (Billion) Forecast, by Application 2020 & 2033
- Table 14: China Manganese Market Volume (K Tons) Forecast, by Application 2020 & 2033
- Table 15: India Manganese Market Revenue (Billion) Forecast, by Application 2020 & 2033
- Table 16: India Manganese Market Volume (K Tons) Forecast, by Application 2020 & 2033
- Table 17: Japan Manganese Market Revenue (Billion) Forecast, by Application 2020 & 2033
- Table 18: Japan Manganese Market Volume (K Tons) Forecast, by Application 2020 & 2033
- Table 19: South Korea Manganese Market Revenue (Billion) Forecast, by Application 2020 & 2033
- Table 20: South Korea Manganese Market Volume (K Tons) Forecast, by Application 2020 & 2033
- Table 21: Rest of Asia Pacific Manganese Market Revenue (Billion) Forecast, by Application 2020 & 2033
- Table 22: Rest of Asia Pacific Manganese Market Volume (K Tons) Forecast, by Application 2020 & 2033
- Table 23: Global Manganese Market Revenue Billion Forecast, by Application 2020 & 2033
- Table 24: Global Manganese Market Volume K Tons Forecast, by Application 2020 & 2033
- Table 25: Global Manganese Market Revenue Billion Forecast, by End-use Sector 2020 & 2033
- Table 26: Global Manganese Market Volume K Tons Forecast, by End-use Sector 2020 & 2033
- Table 27: Global Manganese Market Revenue Billion Forecast, by Country 2020 & 2033
- Table 28: Global Manganese Market Volume K Tons Forecast, by Country 2020 & 2033
- Table 29: United States Manganese Market Revenue (Billion) Forecast, by Application 2020 & 2033
- Table 30: United States Manganese Market Volume (K Tons) Forecast, by Application 2020 & 2033
- Table 31: Canada Manganese Market Revenue (Billion) Forecast, by Application 2020 & 2033
- Table 32: Canada Manganese Market Volume (K Tons) Forecast, by Application 2020 & 2033
- Table 33: Mexico Manganese Market Revenue (Billion) Forecast, by Application 2020 & 2033
- Table 34: Mexico Manganese Market Volume (K Tons) Forecast, by Application 2020 & 2033
- Table 35: Global Manganese Market Revenue Billion Forecast, by Application 2020 & 2033
- Table 36: Global Manganese Market Volume K Tons Forecast, by Application 2020 & 2033
- Table 37: Global Manganese Market Revenue Billion Forecast, by End-use Sector 2020 & 2033
- Table 38: Global Manganese Market Volume K Tons Forecast, by End-use Sector 2020 & 2033
- Table 39: Global Manganese Market Revenue Billion Forecast, by Country 2020 & 2033
- Table 40: Global Manganese Market Volume K Tons Forecast, by Country 2020 & 2033
- Table 41: Germany Manganese Market Revenue (Billion) Forecast, by Application 2020 & 2033
- Table 42: Germany Manganese Market Volume (K Tons) Forecast, by Application 2020 & 2033
- Table 43: United Kingdom Manganese Market Revenue (Billion) Forecast, by Application 2020 & 2033
- Table 44: United Kingdom Manganese Market Volume (K Tons) Forecast, by Application 2020 & 2033
- Table 45: Italy Manganese Market Revenue (Billion) Forecast, by Application 2020 & 2033
- Table 46: Italy Manganese Market Volume (K Tons) Forecast, by Application 2020 & 2033
- Table 47: France Manganese Market Revenue (Billion) Forecast, by Application 2020 & 2033
- Table 48: France Manganese Market Volume (K Tons) Forecast, by Application 2020 & 2033
- Table 49: Rest of Europe Manganese Market Revenue (Billion) Forecast, by Application 2020 & 2033
- Table 50: Rest of Europe Manganese Market Volume (K Tons) Forecast, by Application 2020 & 2033
- Table 51: Global Manganese Market Revenue Billion Forecast, by Application 2020 & 2033
- Table 52: Global Manganese Market Volume K Tons Forecast, by Application 2020 & 2033
- Table 53: Global Manganese Market Revenue Billion Forecast, by End-use Sector 2020 & 2033
- Table 54: Global Manganese Market Volume K Tons Forecast, by End-use Sector 2020 & 2033
- Table 55: Global Manganese Market Revenue Billion Forecast, by Country 2020 & 2033
- Table 56: Global Manganese Market Volume K Tons Forecast, by Country 2020 & 2033
- Table 57: Brazil Manganese Market Revenue (Billion) Forecast, by Application 2020 & 2033
- Table 58: Brazil Manganese Market Volume (K Tons) Forecast, by Application 2020 & 2033
- Table 59: Argentina Manganese Market Revenue (Billion) Forecast, by Application 2020 & 2033
- Table 60: Argentina Manganese Market Volume (K Tons) Forecast, by Application 2020 & 2033
- Table 61: Rest of South America Manganese Market Revenue (Billion) Forecast, by Application 2020 & 2033
- Table 62: Rest of South America Manganese Market Volume (K Tons) Forecast, by Application 2020 & 2033
- Table 63: Global Manganese Market Revenue Billion Forecast, by Application 2020 & 2033
- Table 64: Global Manganese Market Volume K Tons Forecast, by Application 2020 & 2033
- Table 65: Global Manganese Market Revenue Billion Forecast, by End-use Sector 2020 & 2033
- Table 66: Global Manganese Market Volume K Tons Forecast, by End-use Sector 2020 & 2033
- Table 67: Global Manganese Market Revenue Billion Forecast, by Country 2020 & 2033
- Table 68: Global Manganese Market Volume K Tons Forecast, by Country 2020 & 2033
- Table 69: Saudi Arabia Manganese Market Revenue (Billion) Forecast, by Application 2020 & 2033
- Table 70: Saudi Arabia Manganese Market Volume (K Tons) Forecast, by Application 2020 & 2033
- Table 71: South Africa Manganese Market Revenue (Billion) Forecast, by Application 2020 & 2033
- Table 72: South Africa Manganese Market Volume (K Tons) Forecast, by Application 2020 & 2033
- Table 73: Rest of Middle East and Africa Manganese Market Revenue (Billion) Forecast, by Application 2020 & 2033
- Table 74: Rest of Middle East and Africa Manganese Market Volume (K Tons) Forecast, by Application 2020 & 2033
Frequently Asked Questions
1. What is the projected Compound Annual Growth Rate (CAGR) of the Manganese Market?
The projected CAGR is approximately 5%.
2. Which companies are prominent players in the Manganese Market?
Key companies in the market include BHP, MOIL LIMITED, Tata Steel, Vale, Carus Group Inc, Jupiter Mines Limited, Sibelco, Mesa Minerals Limited, NIPPON DENKO CO LTD, Ningxia Tianyuan Manganese Industry Group Co Ltd, Eramet, Anglo American PLC, Assore Limited (Assmang Proprietary Limited).
3. What are the main segments of the Manganese Market?
The market segments include Application, End-use Sector.
4. Can you provide details about the market size?
The market size is estimated to be USD 24.4 Billion as of 2022.
5. What are some drivers contributing to market growth?
Increasing Demand of Electric Vehicles; Other Drivers.
6. What are the notable trends driving market growth?
Increasing Demand from Construction Sector.
7. Are there any restraints impacting market growth?
Other Restraints.
8. Can you provide examples of recent developments in the market?
In August 2020, South32 Ltd. announced that it would sell its entire stake in the manganese alloy smelter, Tasmanian Electro Metallurgical Company (TEMCO) to UK-based conglomerate GFG Alliance and thereby enhancing the business of GFG Alliance.
9. What pricing options are available for accessing the report?
Pricing options include single-user, multi-user, and enterprise licenses priced at USD 4750, USD 5250, and USD 8750 respectively.
10. Is the market size provided in terms of value or volume?
The market size is provided in terms of value, measured in Billion and volume, measured in K Tons.
11. Are there any specific market keywords associated with the report?
Yes, the market keyword associated with the report is "Manganese Market," which aids in identifying and referencing the specific market segment covered.
12. How do I determine which pricing option suits my needs best?
The pricing options vary based on user requirements and access needs. Individual users may opt for single-user licenses, while businesses requiring broader access may choose multi-user or enterprise licenses for cost-effective access to the report.
13. Are there any additional resources or data provided in the Manganese Market report?
While the report offers comprehensive insights, it's advisable to review the specific contents or supplementary materials provided to ascertain if additional resources or data are available.
14. How can I stay updated on further developments or reports in the Manganese Market?
To stay informed about further developments, trends, and reports in the Manganese Market, consider subscribing to industry newsletters, following relevant companies and organizations, or regularly checking reputable industry news sources and publications.
Methodology
Step 1 - Identification of Relevant Samples Size from Population Database


Step 2 - Approaches for Defining Global Market Size (Value, Volume* & Price*)

Note*: In applicable scenarios
Step 3 - Data Sources
Primary Research
- Web Analytics
- Survey Reports
- Research Institute
- Latest Research Reports
- Opinion Leaders
Secondary Research
- Annual Reports
- White Paper
- Latest Press Release
- Industry Association
- Paid Database
- Investor Presentations

Step 4 - Data Triangulation
Involves using different sources of information in order to increase the validity of a study
These sources are likely to be stakeholders in a program - participants, other researchers, program staff, other community members, and so on.
Then we put all data in single framework & apply various statistical tools to find out the dynamic on the market.
During the analysis stage, feedback from the stakeholder groups would be compared to determine areas of agreement as well as areas of divergence