Key Insights
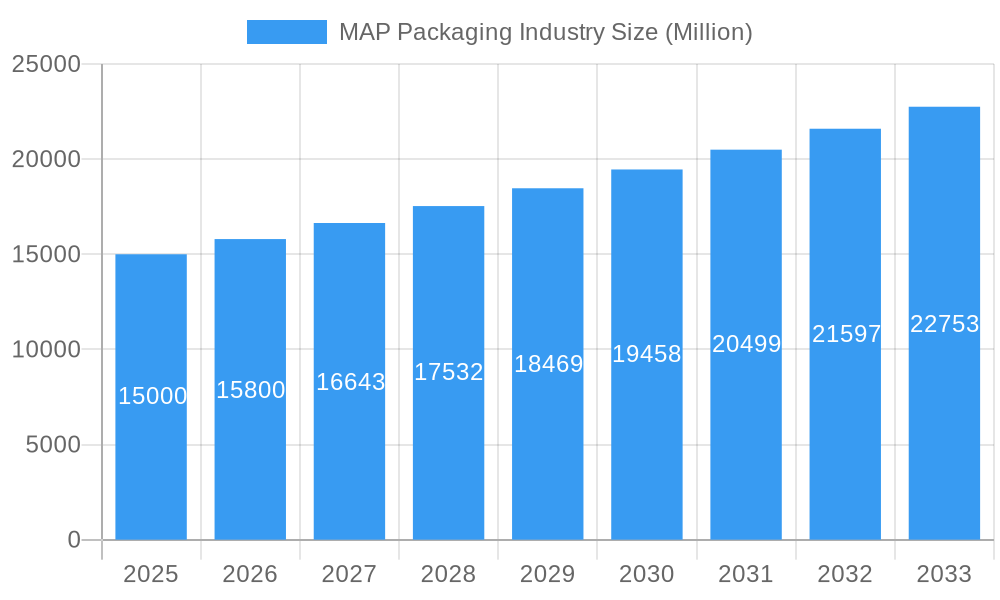
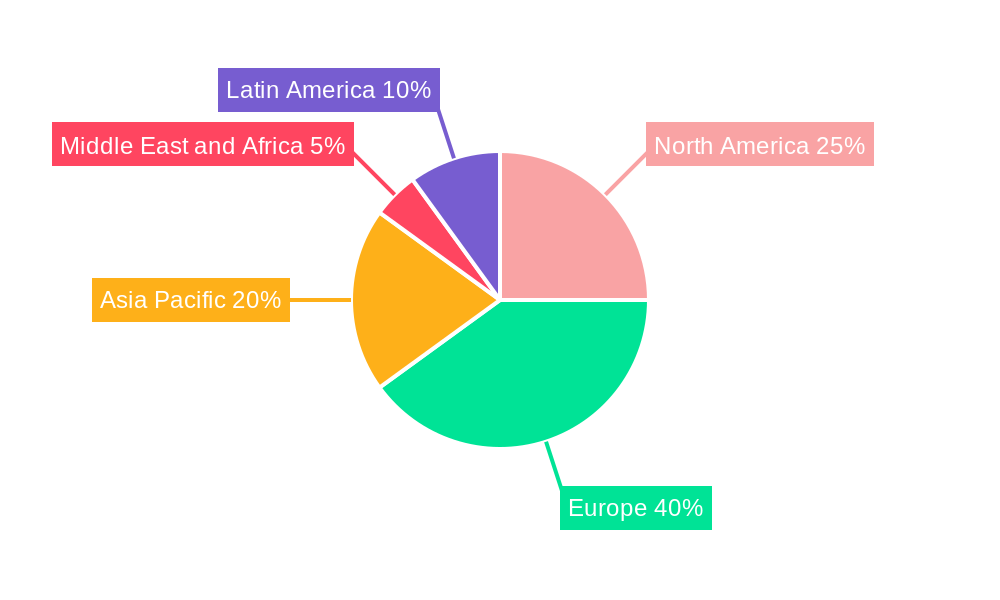
The Modified Atmosphere Packaging (MAP) industry is experiencing robust growth, driven by increasing consumer demand for extended shelf life and improved food quality. A 5.30% CAGR indicates a significant expansion, projected to reach a substantial market valuation by 2033. Key drivers include the rising popularity of ready-to-eat meals, the growing awareness of food waste reduction, and the increasing adoption of MAP technology across diverse food segments like poultry, seafood, fruits, and vegetables. Europe, particularly the UK, Germany, France, and Italy, currently holds a dominant market share, fueled by advanced packaging infrastructure and stringent food safety regulations. However, the Asia-Pacific region is expected to witness rapid growth due to increasing disposable incomes and changing consumer preferences. The adoption of various packaging materials like Polypropylene (PP), Polyvinylchloride (PVC), and Low-Density Polyethylene (LDPE) caters to diverse product needs and cost considerations. While the market faces restraints from high initial investment costs associated with MAP technology and potential challenges related to packaging material recyclability, continuous innovation in packaging materials and technology is expected to mitigate these challenges. Leading players like SEALPAC Schweiz GmbH, Linde AG, and Amcor Plc are driving market consolidation through strategic partnerships and technological advancements. The projected market expansion hinges on continuous product innovation, the exploration of sustainable packaging solutions, and the expansion of MAP technology into new food applications and emerging markets.
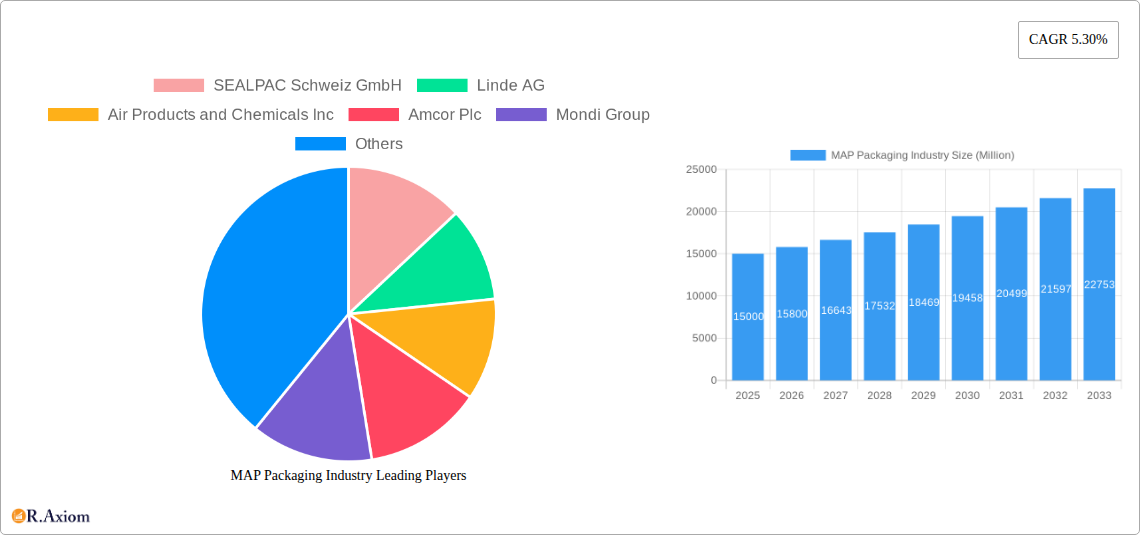
MAP Packaging Industry Market Size (In Billion)
The competitive landscape is characterized by both established players and innovative startups. Large multinational companies possess significant resources for research and development, enabling them to offer technologically advanced solutions. Smaller, specialized companies are often more agile and focused on niche markets, providing competition and fostering innovation. Future growth will depend on factors such as the development of sustainable and environmentally friendly packaging materials, further automation in the packaging process, and effective supply chain management. The industry is likely to witness increasing mergers and acquisitions, further consolidating market power among key players. Successful strategies will focus on both cost optimization and value-added services, catering to the evolving needs of food producers and retailers. A significant focus on reducing environmental impact through sustainable packaging options will be critical for long-term success within the MAP packaging industry.
MAP Packaging Industry Company Market Share
MAP Packaging Industry: A Comprehensive Market Analysis (2019-2033)
This comprehensive report provides a detailed analysis of the MAP (Modified Atmosphere Packaging) industry, offering invaluable insights for stakeholders, investors, and businesses operating within this dynamic sector. The report covers the period from 2019 to 2033, with a focus on the forecast period of 2025-2033 and a base year of 2025. The market size is projected to reach xx Million by 2033, exhibiting a CAGR of xx% during the forecast period.
MAP Packaging Industry Market Concentration & Innovation
This section analyzes the competitive landscape of the MAP packaging industry, examining market concentration, innovation drivers, regulatory influences, and market dynamics. The report delves into the strategic maneuvers of key players, including mergers and acquisitions (M&A) activities. Analysis of market share reveals that the top five players—Amcor Plc, Mondi Group, Sealed Air Corporation, Linde AG, and Air Products and Chemicals Inc—currently hold approximately xx% of the global market. However, the market is characterized by a high level of innovation, with smaller players making significant inroads.
The total M&A deal value in the MAP packaging sector during the historical period (2019-2024) is estimated at xx Million. Key innovation drivers include advancements in packaging materials (e.g., biodegradable polymers), improved gas-mixing technologies, and the development of smart packaging solutions incorporating sensors for extended shelf life monitoring. Regulatory frameworks concerning food safety and environmental sustainability significantly influence industry practices, while the increasing prevalence of ready-to-eat meals and the rise of e-commerce fuel demand for extended shelf-life packaging. Product substitutes, such as vacuum packaging, present ongoing competitive challenges. Finally, evolving end-user preferences regarding convenience, sustainability, and food safety continuously reshape the market dynamics.
- Key Players' Market Share: Amcor Plc (xx%), Mondi Group (xx%), Sealed Air Corporation (xx%), Linde AG (xx%), Air Products and Chemicals Inc (xx%).
- M&A Deal Value (2019-2024): xx Million
- Key Innovation Drivers: Biodegradable materials, advanced gas-mixing, smart packaging.
MAP Packaging Industry Industry Trends & Insights
The MAP packaging industry is experiencing robust growth, driven by several factors. The rising demand for convenient and ready-to-eat food products fuels the need for extended shelf-life packaging. Technological advancements, such as the development of active and intelligent packaging, enhance product preservation and improve consumer experience. Changing consumer preferences, with a focus on sustainability and food safety, are also shaping industry trends. Competitive dynamics are intense, with players focusing on product differentiation, innovation, and cost optimization.
The market is witnessing a shift towards sustainable packaging materials, with increased adoption of bio-based and recyclable options. The growing awareness of environmental concerns is driving this trend. Technological disruptions, such as the adoption of automation and digital technologies in manufacturing processes, are improving efficiency and reducing costs. Furthermore, the increasing adoption of e-commerce and the rise of online grocery shopping are also contributing to the market growth.
- CAGR (2025-2033): xx%
- Market Penetration of Sustainable Materials (2025): xx%
- Market Growth Drivers: Convenience, sustainability, e-commerce.
Dominant Markets & Segments in MAP Packaging Industry
The European market dominates the MAP packaging industry, with Germany, the United Kingdom, and France leading the regional rankings. The strong food processing industry and advanced infrastructure in these countries contribute to their dominance. Nitrogen is the most widely used packaging gas, given its inert properties and effectiveness in preserving food quality. Polypropylene (PP) is the preferred packaging material due to its versatility, cost-effectiveness, and suitability for various food applications. Poultry, seafood, and meat products account for a significant portion of the market, given the need for extended shelf life and preservation.
- Leading Region: Europe
- Leading Countries: Germany, United Kingdom, France
- Dominant Packaging Gas: Nitrogen
- Dominant Packaging Material: Polypropylene (PP)
- Leading Application: Poultry, Seafood, & Meat Products
Key Drivers:
- Germany: Strong food processing industry, robust economy, supportive government policies.
- United Kingdom: Large retail sector, well-developed infrastructure, high consumer demand.
- France: Significant agricultural sector, established food processing industry, supportive regulations.
MAP Packaging Industry Product Developments
Recent product innovations focus on enhancing sustainability, improving barrier properties, and incorporating smart features. Biodegradable and compostable packaging materials are gaining traction, while advancements in gas-mixing technologies allow for optimized atmospheric control. Smart packaging solutions with integrated sensors provide real-time monitoring of product freshness and quality. These developments enhance product shelf life, improve food safety, and address growing consumer concerns regarding environmental impact. The market fit for these innovations is excellent, as they directly address key industry challenges and consumer demands.
Report Scope & Segmentation Analysis
This report provides a comprehensive segmentation of the MAP packaging market by country (United Kingdom, Germany, France, Italy, Rest of Europe), packaging gas type (Oxygen, Nitrogen, Carbon Dioxide, Other Gases), type of packaging material (Polypropylene (PP), Polyvinylchloride (PVC), Low-Density Polyethylene (LDPE), Other Materials), and application (Poultry, Seafood, & Meat Products, Fruits & Vegetables, Bakery & Confectionery, Other Applications). Each segment's growth projections, market size, and competitive dynamics are analyzed, offering a granular view of market opportunities. For example, the Polypropylene (PP) segment is expected to witness substantial growth, driven by its versatility and cost-effectiveness. Similarly, the demand for MAP packaging in the Poultry, Seafood & Meat Products segment is projected to increase significantly due to the rising consumption of these food items globally.
Key Drivers of MAP Packaging Industry Growth
The growth of the MAP packaging industry is driven by several factors: the increasing demand for convenient, ready-to-eat food, technological advancements in packaging materials and gas-mixing technologies, growing consumer awareness of food safety and preservation, and stringent government regulations promoting extended shelf life and reduced food waste. The expansion of the global food and beverage sector, coupled with the rise of e-commerce and online grocery shopping, further fuels the industry's expansion. The growing demand for sustainable and environmentally friendly packaging options also presents significant growth opportunities.
Challenges in the MAP Packaging Industry Sector
The MAP packaging industry faces several challenges, including fluctuating raw material prices, increasing competition from alternative packaging technologies, and stringent environmental regulations. Supply chain disruptions and logistics complexities can impact production and distribution, while maintaining consistent gas quality and minimizing environmental impact remain key operational challenges. These factors can impact profitability and require continuous innovation and adaptation to overcome.
Emerging Opportunities in MAP Packaging Industry
Emerging opportunities abound in the MAP packaging industry. The rising demand for sustainable and recyclable packaging solutions presents a significant market opportunity. The development of active and intelligent packaging incorporating sensors and indicators for freshness monitoring presents considerable potential. Expansion into new geographical markets, particularly in developing economies, offers further growth opportunities. Finally, catering to specialized food segments, such as organic and gourmet products, provides niche market potential.
Leading Players in the MAP Packaging Industry Market
- SEALPAC Schweiz GmbH
- Linde AG
- Air Products and Chemicals Inc
- Amcor Plc
- Mondi Group
- Syntegon Technology GmbH
- Barry-Wehmiller Companies
- ULMA Packaging
- CV-Tek
- Sealed Air Corporation
Key Developments in MAP Packaging Industry Industry
- 2022-Q4: Amcor Plc launches a new range of recyclable MAP packaging for fresh produce.
- 2023-Q1: Linde AG invests in a new gas-mixing facility to increase production capacity.
- 2023-Q2: Sealed Air Corporation introduces a smart packaging solution with integrated sensors.
- 2024-Q3: Mondi Group partners with a technology provider to develop biodegradable MAP packaging. (Further developments to be added based on available data)
Strategic Outlook for MAP Packaging Industry Market
The future of the MAP packaging industry is bright, driven by continued innovation in packaging materials and technologies, growing consumer demand for convenience and sustainability, and expanding applications across various food segments. The industry's future growth trajectory hinges on strategic partnerships, technological advancements, and a proactive approach to meeting evolving regulatory requirements and consumer expectations. Companies that effectively adapt to sustainability trends and incorporate smart packaging features will be best positioned for success.
MAP Packaging Industry Segmentation
-
1. Packaging Gas Type
- 1.1. Oxygen
- 1.2. Nitrogen
- 1.3. Carbon Dioxide
- 1.4. Other Gases
-
2. Type of Packaging Material
- 2.1. Polypropylene (PP)
- 2.2. Polyvinylchloride (PVC)
- 2.3. Low-Density Polyethylene (LDPE)
- 2.4. Other Materials
-
3. Application
- 3.1. Poultry, Seafood, & Meat Products
- 3.2. Fruits & Vegetables
- 3.3. Bakery & Confectionery
- 3.4. Other Applications
MAP Packaging Industry Segmentation By Geography
-
1. North America
- 1.1. United States
- 1.2. Canada
- 1.3. Mexico
-
2. South America
- 2.1. Brazil
- 2.2. Argentina
- 2.3. Rest of South America
-
3. Europe
- 3.1. United Kingdom
- 3.2. Germany
- 3.3. France
- 3.4. Italy
- 3.5. Spain
- 3.6. Russia
- 3.7. Benelux
- 3.8. Nordics
- 3.9. Rest of Europe
-
4. Middle East & Africa
- 4.1. Turkey
- 4.2. Israel
- 4.3. GCC
- 4.4. North Africa
- 4.5. South Africa
- 4.6. Rest of Middle East & Africa
-
5. Asia Pacific
- 5.1. China
- 5.2. India
- 5.3. Japan
- 5.4. South Korea
- 5.5. ASEAN
- 5.6. Oceania
- 5.7. Rest of Asia Pacific
MAP Packaging Industry Regional Market Share
Geographic Coverage of MAP Packaging Industry
MAP Packaging Industry REPORT HIGHLIGHTS
| Aspects | Details |
|---|---|
| Study Period | 2020-2034 |
| Base Year | 2025 |
| Estimated Year | 2026 |
| Forecast Period | 2026-2034 |
| Historical Period | 2020-2025 |
| Growth Rate | CAGR of 5.30% from 2020-2034 |
| Segmentation |
|
Table of Contents
- 1. Introduction
- 1.1. Research Scope
- 1.2. Market Segmentation
- 1.3. Research Objective
- 1.4. Definitions and Assumptions
- 2. Executive Summary
- 2.1. Market Snapshot
- 3. Market Dynamics
- 3.1. Market Drivers
- 3.2. Market Restrains
- 3.3. Market Trends
- 3.4. Market Opportunities
- 4. Market Factor Analysis
- 4.1. Porters Five Forces
- 4.1.1. Bargaining Power of Suppliers
- 4.1.2. Bargaining Power of Buyers
- 4.1.3. Threat of New Entrants
- 4.1.4. Threat of Substitutes
- 4.1.5. Competitive Rivalry
- 4.2. PESTEL analysis
- 4.3. BCG Analysis
- 4.3.1. Stars (High Growth, High Market Share)
- 4.3.2. Cash Cows (Low Growth, High Market Share)
- 4.3.3. Question Mark (High Growth, Low Market Share)
- 4.3.4. Dogs (Low Growth, Low Market Share)
- 4.4. Ansoff Matrix Analysis
- 4.5. Supply Chain Analysis
- 4.6. Regulatory Landscape
- 4.7. Current Market Potential and Opportunity Assessment (TAM–SAM–SOM Framework)
- 4.8. RAX Analyst Note
- 4.1. Porters Five Forces
- 5. Market Analysis, Insights and Forecast 2021-2033
- 5.1. Market Analysis, Insights and Forecast - by Packaging Gas Type
- 5.1.1. Oxygen
- 5.1.2. Nitrogen
- 5.1.3. Carbon Dioxide
- 5.1.4. Other Gases
- 5.2. Market Analysis, Insights and Forecast - by Type of Packaging Material
- 5.2.1. Polypropylene (PP)
- 5.2.2. Polyvinylchloride (PVC)
- 5.2.3. Low-Density Polyethylene (LDPE)
- 5.2.4. Other Materials
- 5.3. Market Analysis, Insights and Forecast - by Application
- 5.3.1. Poultry, Seafood, & Meat Products
- 5.3.2. Fruits & Vegetables
- 5.3.3. Bakery & Confectionery
- 5.3.4. Other Applications
- 5.4. Market Analysis, Insights and Forecast - by Region
- 5.4.1. North America
- 5.4.2. South America
- 5.4.3. Europe
- 5.4.4. Middle East & Africa
- 5.4.5. Asia Pacific
- 5.1. Market Analysis, Insights and Forecast - by Packaging Gas Type
- 6. Global MAP Packaging Industry Analysis, Insights and Forecast, 2021-2033
- 6.1. Market Analysis, Insights and Forecast - by Packaging Gas Type
- 6.1.1. Oxygen
- 6.1.2. Nitrogen
- 6.1.3. Carbon Dioxide
- 6.1.4. Other Gases
- 6.2. Market Analysis, Insights and Forecast - by Type of Packaging Material
- 6.2.1. Polypropylene (PP)
- 6.2.2. Polyvinylchloride (PVC)
- 6.2.3. Low-Density Polyethylene (LDPE)
- 6.2.4. Other Materials
- 6.3. Market Analysis, Insights and Forecast - by Application
- 6.3.1. Poultry, Seafood, & Meat Products
- 6.3.2. Fruits & Vegetables
- 6.3.3. Bakery & Confectionery
- 6.3.4. Other Applications
- 6.1. Market Analysis, Insights and Forecast - by Packaging Gas Type
- 7. North America MAP Packaging Industry Analysis, Insights and Forecast, 2020-2032
- 7.1. Market Analysis, Insights and Forecast - by Packaging Gas Type
- 7.1.1. Oxygen
- 7.1.2. Nitrogen
- 7.1.3. Carbon Dioxide
- 7.1.4. Other Gases
- 7.2. Market Analysis, Insights and Forecast - by Type of Packaging Material
- 7.2.1. Polypropylene (PP)
- 7.2.2. Polyvinylchloride (PVC)
- 7.2.3. Low-Density Polyethylene (LDPE)
- 7.2.4. Other Materials
- 7.3. Market Analysis, Insights and Forecast - by Application
- 7.3.1. Poultry, Seafood, & Meat Products
- 7.3.2. Fruits & Vegetables
- 7.3.3. Bakery & Confectionery
- 7.3.4. Other Applications
- 7.1. Market Analysis, Insights and Forecast - by Packaging Gas Type
- 8. South America MAP Packaging Industry Analysis, Insights and Forecast, 2020-2032
- 8.1. Market Analysis, Insights and Forecast - by Packaging Gas Type
- 8.1.1. Oxygen
- 8.1.2. Nitrogen
- 8.1.3. Carbon Dioxide
- 8.1.4. Other Gases
- 8.2. Market Analysis, Insights and Forecast - by Type of Packaging Material
- 8.2.1. Polypropylene (PP)
- 8.2.2. Polyvinylchloride (PVC)
- 8.2.3. Low-Density Polyethylene (LDPE)
- 8.2.4. Other Materials
- 8.3. Market Analysis, Insights and Forecast - by Application
- 8.3.1. Poultry, Seafood, & Meat Products
- 8.3.2. Fruits & Vegetables
- 8.3.3. Bakery & Confectionery
- 8.3.4. Other Applications
- 8.1. Market Analysis, Insights and Forecast - by Packaging Gas Type
- 9. Europe MAP Packaging Industry Analysis, Insights and Forecast, 2020-2032
- 9.1. Market Analysis, Insights and Forecast - by Packaging Gas Type
- 9.1.1. Oxygen
- 9.1.2. Nitrogen
- 9.1.3. Carbon Dioxide
- 9.1.4. Other Gases
- 9.2. Market Analysis, Insights and Forecast - by Type of Packaging Material
- 9.2.1. Polypropylene (PP)
- 9.2.2. Polyvinylchloride (PVC)
- 9.2.3. Low-Density Polyethylene (LDPE)
- 9.2.4. Other Materials
- 9.3. Market Analysis, Insights and Forecast - by Application
- 9.3.1. Poultry, Seafood, & Meat Products
- 9.3.2. Fruits & Vegetables
- 9.3.3. Bakery & Confectionery
- 9.3.4. Other Applications
- 9.1. Market Analysis, Insights and Forecast - by Packaging Gas Type
- 10. Middle East & Africa MAP Packaging Industry Analysis, Insights and Forecast, 2020-2032
- 10.1. Market Analysis, Insights and Forecast - by Packaging Gas Type
- 10.1.1. Oxygen
- 10.1.2. Nitrogen
- 10.1.3. Carbon Dioxide
- 10.1.4. Other Gases
- 10.2. Market Analysis, Insights and Forecast - by Type of Packaging Material
- 10.2.1. Polypropylene (PP)
- 10.2.2. Polyvinylchloride (PVC)
- 10.2.3. Low-Density Polyethylene (LDPE)
- 10.2.4. Other Materials
- 10.3. Market Analysis, Insights and Forecast - by Application
- 10.3.1. Poultry, Seafood, & Meat Products
- 10.3.2. Fruits & Vegetables
- 10.3.3. Bakery & Confectionery
- 10.3.4. Other Applications
- 10.1. Market Analysis, Insights and Forecast - by Packaging Gas Type
- 11. Asia Pacific MAP Packaging Industry Analysis, Insights and Forecast, 2020-2032
- 11.1. Market Analysis, Insights and Forecast - by Packaging Gas Type
- 11.1.1. Oxygen
- 11.1.2. Nitrogen
- 11.1.3. Carbon Dioxide
- 11.1.4. Other Gases
- 11.2. Market Analysis, Insights and Forecast - by Type of Packaging Material
- 11.2.1. Polypropylene (PP)
- 11.2.2. Polyvinylchloride (PVC)
- 11.2.3. Low-Density Polyethylene (LDPE)
- 11.2.4. Other Materials
- 11.3. Market Analysis, Insights and Forecast - by Application
- 11.3.1. Poultry, Seafood, & Meat Products
- 11.3.2. Fruits & Vegetables
- 11.3.3. Bakery & Confectionery
- 11.3.4. Other Applications
- 11.1. Market Analysis, Insights and Forecast - by Packaging Gas Type
- 12. Competitive Analysis
- 12.1. Company Profiles
- 12.1.1 SEALPAC Schweiz GmbH
- 12.1.1.1. Company Overview
- 12.1.1.2. Products
- 12.1.1.3. Company Financials
- 12.1.1.4. SWOT Analysis
- 12.1.2 Linde AG
- 12.1.2.1. Company Overview
- 12.1.2.2. Products
- 12.1.2.3. Company Financials
- 12.1.2.4. SWOT Analysis
- 12.1.3 Air Products and Chemicals Inc
- 12.1.3.1. Company Overview
- 12.1.3.2. Products
- 12.1.3.3. Company Financials
- 12.1.3.4. SWOT Analysis
- 12.1.4 Amcor Plc
- 12.1.4.1. Company Overview
- 12.1.4.2. Products
- 12.1.4.3. Company Financials
- 12.1.4.4. SWOT Analysis
- 12.1.5 Mondi Group
- 12.1.5.1. Company Overview
- 12.1.5.2. Products
- 12.1.5.3. Company Financials
- 12.1.5.4. SWOT Analysis
- 12.1.6 Syntegon Technology GmbH*List Not Exhaustive
- 12.1.6.1. Company Overview
- 12.1.6.2. Products
- 12.1.6.3. Company Financials
- 12.1.6.4. SWOT Analysis
- 12.1.7 Barry-Wehmiller Companies
- 12.1.7.1. Company Overview
- 12.1.7.2. Products
- 12.1.7.3. Company Financials
- 12.1.7.4. SWOT Analysis
- 12.1.8 ULMA Packaging
- 12.1.8.1. Company Overview
- 12.1.8.2. Products
- 12.1.8.3. Company Financials
- 12.1.8.4. SWOT Analysis
- 12.1.9 CV-Tek
- 12.1.9.1. Company Overview
- 12.1.9.2. Products
- 12.1.9.3. Company Financials
- 12.1.9.4. SWOT Analysis
- 12.1.10 Sealed Air Corporation
- 12.1.10.1. Company Overview
- 12.1.10.2. Products
- 12.1.10.3. Company Financials
- 12.1.10.4. SWOT Analysis
- 12.1.1 SEALPAC Schweiz GmbH
- 12.2. Market Entropy
- 12.2.1 Company's Key Areas Served
- 12.2.2 Recent Developments
- 12.3. Company Market Share Analysis 2025
- 12.3.1 Top 5 Companies Market Share Analysis
- 12.3.2 Top 3 Companies Market Share Analysis
- 12.4. List of Potential Customers
- 13. Research Methodology
List of Figures
- Figure 1: Global MAP Packaging Industry Revenue Breakdown (Million, %) by Region 2025 & 2033
- Figure 2: North America MAP Packaging Industry Revenue (Million), by Packaging Gas Type 2025 & 2033
- Figure 3: North America MAP Packaging Industry Revenue Share (%), by Packaging Gas Type 2025 & 2033
- Figure 4: North America MAP Packaging Industry Revenue (Million), by Type of Packaging Material 2025 & 2033
- Figure 5: North America MAP Packaging Industry Revenue Share (%), by Type of Packaging Material 2025 & 2033
- Figure 6: North America MAP Packaging Industry Revenue (Million), by Application 2025 & 2033
- Figure 7: North America MAP Packaging Industry Revenue Share (%), by Application 2025 & 2033
- Figure 8: North America MAP Packaging Industry Revenue (Million), by Country 2025 & 2033
- Figure 9: North America MAP Packaging Industry Revenue Share (%), by Country 2025 & 2033
- Figure 10: South America MAP Packaging Industry Revenue (Million), by Packaging Gas Type 2025 & 2033
- Figure 11: South America MAP Packaging Industry Revenue Share (%), by Packaging Gas Type 2025 & 2033
- Figure 12: South America MAP Packaging Industry Revenue (Million), by Type of Packaging Material 2025 & 2033
- Figure 13: South America MAP Packaging Industry Revenue Share (%), by Type of Packaging Material 2025 & 2033
- Figure 14: South America MAP Packaging Industry Revenue (Million), by Application 2025 & 2033
- Figure 15: South America MAP Packaging Industry Revenue Share (%), by Application 2025 & 2033
- Figure 16: South America MAP Packaging Industry Revenue (Million), by Country 2025 & 2033
- Figure 17: South America MAP Packaging Industry Revenue Share (%), by Country 2025 & 2033
- Figure 18: Europe MAP Packaging Industry Revenue (Million), by Packaging Gas Type 2025 & 2033
- Figure 19: Europe MAP Packaging Industry Revenue Share (%), by Packaging Gas Type 2025 & 2033
- Figure 20: Europe MAP Packaging Industry Revenue (Million), by Type of Packaging Material 2025 & 2033
- Figure 21: Europe MAP Packaging Industry Revenue Share (%), by Type of Packaging Material 2025 & 2033
- Figure 22: Europe MAP Packaging Industry Revenue (Million), by Application 2025 & 2033
- Figure 23: Europe MAP Packaging Industry Revenue Share (%), by Application 2025 & 2033
- Figure 24: Europe MAP Packaging Industry Revenue (Million), by Country 2025 & 2033
- Figure 25: Europe MAP Packaging Industry Revenue Share (%), by Country 2025 & 2033
- Figure 26: Middle East & Africa MAP Packaging Industry Revenue (Million), by Packaging Gas Type 2025 & 2033
- Figure 27: Middle East & Africa MAP Packaging Industry Revenue Share (%), by Packaging Gas Type 2025 & 2033
- Figure 28: Middle East & Africa MAP Packaging Industry Revenue (Million), by Type of Packaging Material 2025 & 2033
- Figure 29: Middle East & Africa MAP Packaging Industry Revenue Share (%), by Type of Packaging Material 2025 & 2033
- Figure 30: Middle East & Africa MAP Packaging Industry Revenue (Million), by Application 2025 & 2033
- Figure 31: Middle East & Africa MAP Packaging Industry Revenue Share (%), by Application 2025 & 2033
- Figure 32: Middle East & Africa MAP Packaging Industry Revenue (Million), by Country 2025 & 2033
- Figure 33: Middle East & Africa MAP Packaging Industry Revenue Share (%), by Country 2025 & 2033
- Figure 34: Asia Pacific MAP Packaging Industry Revenue (Million), by Packaging Gas Type 2025 & 2033
- Figure 35: Asia Pacific MAP Packaging Industry Revenue Share (%), by Packaging Gas Type 2025 & 2033
- Figure 36: Asia Pacific MAP Packaging Industry Revenue (Million), by Type of Packaging Material 2025 & 2033
- Figure 37: Asia Pacific MAP Packaging Industry Revenue Share (%), by Type of Packaging Material 2025 & 2033
- Figure 38: Asia Pacific MAP Packaging Industry Revenue (Million), by Application 2025 & 2033
- Figure 39: Asia Pacific MAP Packaging Industry Revenue Share (%), by Application 2025 & 2033
- Figure 40: Asia Pacific MAP Packaging Industry Revenue (Million), by Country 2025 & 2033
- Figure 41: Asia Pacific MAP Packaging Industry Revenue Share (%), by Country 2025 & 2033
List of Tables
- Table 1: Global MAP Packaging Industry Revenue Million Forecast, by Packaging Gas Type 2020 & 2033
- Table 2: Global MAP Packaging Industry Revenue Million Forecast, by Type of Packaging Material 2020 & 2033
- Table 3: Global MAP Packaging Industry Revenue Million Forecast, by Application 2020 & 2033
- Table 4: Global MAP Packaging Industry Revenue Million Forecast, by Region 2020 & 2033
- Table 5: Global MAP Packaging Industry Revenue Million Forecast, by Packaging Gas Type 2020 & 2033
- Table 6: Global MAP Packaging Industry Revenue Million Forecast, by Type of Packaging Material 2020 & 2033
- Table 7: Global MAP Packaging Industry Revenue Million Forecast, by Application 2020 & 2033
- Table 8: Global MAP Packaging Industry Revenue Million Forecast, by Country 2020 & 2033
- Table 9: United States MAP Packaging Industry Revenue (Million) Forecast, by Application 2020 & 2033
- Table 10: Canada MAP Packaging Industry Revenue (Million) Forecast, by Application 2020 & 2033
- Table 11: Mexico MAP Packaging Industry Revenue (Million) Forecast, by Application 2020 & 2033
- Table 12: Global MAP Packaging Industry Revenue Million Forecast, by Packaging Gas Type 2020 & 2033
- Table 13: Global MAP Packaging Industry Revenue Million Forecast, by Type of Packaging Material 2020 & 2033
- Table 14: Global MAP Packaging Industry Revenue Million Forecast, by Application 2020 & 2033
- Table 15: Global MAP Packaging Industry Revenue Million Forecast, by Country 2020 & 2033
- Table 16: Brazil MAP Packaging Industry Revenue (Million) Forecast, by Application 2020 & 2033
- Table 17: Argentina MAP Packaging Industry Revenue (Million) Forecast, by Application 2020 & 2033
- Table 18: Rest of South America MAP Packaging Industry Revenue (Million) Forecast, by Application 2020 & 2033
- Table 19: Global MAP Packaging Industry Revenue Million Forecast, by Packaging Gas Type 2020 & 2033
- Table 20: Global MAP Packaging Industry Revenue Million Forecast, by Type of Packaging Material 2020 & 2033
- Table 21: Global MAP Packaging Industry Revenue Million Forecast, by Application 2020 & 2033
- Table 22: Global MAP Packaging Industry Revenue Million Forecast, by Country 2020 & 2033
- Table 23: United Kingdom MAP Packaging Industry Revenue (Million) Forecast, by Application 2020 & 2033
- Table 24: Germany MAP Packaging Industry Revenue (Million) Forecast, by Application 2020 & 2033
- Table 25: France MAP Packaging Industry Revenue (Million) Forecast, by Application 2020 & 2033
- Table 26: Italy MAP Packaging Industry Revenue (Million) Forecast, by Application 2020 & 2033
- Table 27: Spain MAP Packaging Industry Revenue (Million) Forecast, by Application 2020 & 2033
- Table 28: Russia MAP Packaging Industry Revenue (Million) Forecast, by Application 2020 & 2033
- Table 29: Benelux MAP Packaging Industry Revenue (Million) Forecast, by Application 2020 & 2033
- Table 30: Nordics MAP Packaging Industry Revenue (Million) Forecast, by Application 2020 & 2033
- Table 31: Rest of Europe MAP Packaging Industry Revenue (Million) Forecast, by Application 2020 & 2033
- Table 32: Global MAP Packaging Industry Revenue Million Forecast, by Packaging Gas Type 2020 & 2033
- Table 33: Global MAP Packaging Industry Revenue Million Forecast, by Type of Packaging Material 2020 & 2033
- Table 34: Global MAP Packaging Industry Revenue Million Forecast, by Application 2020 & 2033
- Table 35: Global MAP Packaging Industry Revenue Million Forecast, by Country 2020 & 2033
- Table 36: Turkey MAP Packaging Industry Revenue (Million) Forecast, by Application 2020 & 2033
- Table 37: Israel MAP Packaging Industry Revenue (Million) Forecast, by Application 2020 & 2033
- Table 38: GCC MAP Packaging Industry Revenue (Million) Forecast, by Application 2020 & 2033
- Table 39: North Africa MAP Packaging Industry Revenue (Million) Forecast, by Application 2020 & 2033
- Table 40: South Africa MAP Packaging Industry Revenue (Million) Forecast, by Application 2020 & 2033
- Table 41: Rest of Middle East & Africa MAP Packaging Industry Revenue (Million) Forecast, by Application 2020 & 2033
- Table 42: Global MAP Packaging Industry Revenue Million Forecast, by Packaging Gas Type 2020 & 2033
- Table 43: Global MAP Packaging Industry Revenue Million Forecast, by Type of Packaging Material 2020 & 2033
- Table 44: Global MAP Packaging Industry Revenue Million Forecast, by Application 2020 & 2033
- Table 45: Global MAP Packaging Industry Revenue Million Forecast, by Country 2020 & 2033
- Table 46: China MAP Packaging Industry Revenue (Million) Forecast, by Application 2020 & 2033
- Table 47: India MAP Packaging Industry Revenue (Million) Forecast, by Application 2020 & 2033
- Table 48: Japan MAP Packaging Industry Revenue (Million) Forecast, by Application 2020 & 2033
- Table 49: South Korea MAP Packaging Industry Revenue (Million) Forecast, by Application 2020 & 2033
- Table 50: ASEAN MAP Packaging Industry Revenue (Million) Forecast, by Application 2020 & 2033
- Table 51: Oceania MAP Packaging Industry Revenue (Million) Forecast, by Application 2020 & 2033
- Table 52: Rest of Asia Pacific MAP Packaging Industry Revenue (Million) Forecast, by Application 2020 & 2033
Frequently Asked Questions
1. What is the projected Compound Annual Growth Rate (CAGR) of the MAP Packaging Industry?
The projected CAGR is approximately 5.30%.
2. Which companies are prominent players in the MAP Packaging Industry?
Key companies in the market include SEALPAC Schweiz GmbH, Linde AG, Air Products and Chemicals Inc, Amcor Plc, Mondi Group, Syntegon Technology GmbH*List Not Exhaustive, Barry-Wehmiller Companies, ULMA Packaging, CV-Tek, Sealed Air Corporation.
3. What are the main segments of the MAP Packaging Industry?
The market segments include Packaging Gas Type, Type of Packaging Material, Application.
4. Can you provide details about the market size?
The market size is estimated to be USD XX Million as of 2022.
5. What are some drivers contributing to market growth?
; Increasing demand for longer shelf life; Rising demand for ready to eat food products in European countries.
6. What are the notable trends driving market growth?
Poultry. Seafood & Meat Products are Expected to Hold a Significant Share in the European Market.
7. Are there any restraints impacting market growth?
; Significantly higher cost of MAP related equipments.
8. Can you provide examples of recent developments in the market?
N/A
9. What pricing options are available for accessing the report?
Pricing options include single-user, multi-user, and enterprise licenses priced at USD 4750, USD 4950, and USD 6800 respectively.
10. Is the market size provided in terms of value or volume?
The market size is provided in terms of value, measured in Million.
11. Are there any specific market keywords associated with the report?
Yes, the market keyword associated with the report is "MAP Packaging Industry," which aids in identifying and referencing the specific market segment covered.
12. How do I determine which pricing option suits my needs best?
The pricing options vary based on user requirements and access needs. Individual users may opt for single-user licenses, while businesses requiring broader access may choose multi-user or enterprise licenses for cost-effective access to the report.
13. Are there any additional resources or data provided in the MAP Packaging Industry report?
While the report offers comprehensive insights, it's advisable to review the specific contents or supplementary materials provided to ascertain if additional resources or data are available.
14. How can I stay updated on further developments or reports in the MAP Packaging Industry?
To stay informed about further developments, trends, and reports in the MAP Packaging Industry, consider subscribing to industry newsletters, following relevant companies and organizations, or regularly checking reputable industry news sources and publications.
Methodology
Step 1 - Identification of Relevant Samples Size from Population Database


Step 2 - Approaches for Defining Global Market Size (Value, Volume* & Price*)

Note*: In applicable scenarios
Step 3 - Data Sources
Primary Research
- Web Analytics
- Survey Reports
- Research Institute
- Latest Research Reports
- Opinion Leaders
Secondary Research
- Annual Reports
- White Paper
- Latest Press Release
- Industry Association
- Paid Database
- Investor Presentations

Step 4 - Data Triangulation
Involves using different sources of information in order to increase the validity of a study
These sources are likely to be stakeholders in a program - participants, other researchers, program staff, other community members, and so on.
Then we put all data in single framework & apply various statistical tools to find out the dynamic on the market.
During the analysis stage, feedback from the stakeholder groups would be compared to determine areas of agreement as well as areas of divergence

