

Key Insights
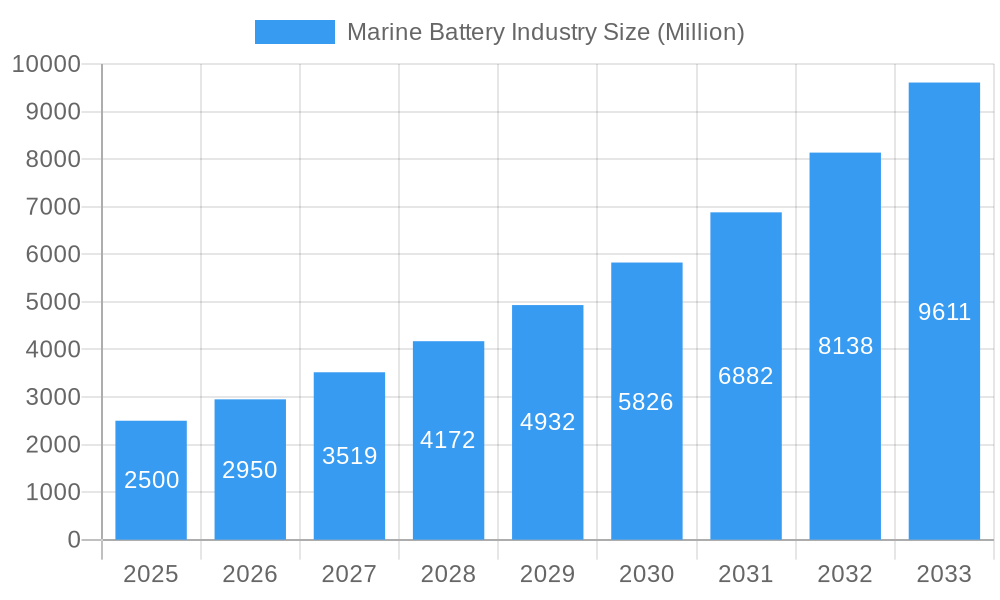
The marine battery market is poised for significant expansion, driven by the escalating demand for sustainable and high-performance power solutions within the maritime sector. The market, valued at $1.54 billion in the base year 2025, is projected to achieve a Compound Annual Growth Rate (CAGR) of 17.89% from 2025 to 2033. This robust growth is propelled by key market drivers including increasingly stringent global emission regulations, which are accelerating the adoption of advanced battery technologies like lithium-ion. The growing prevalence of hybrid and electric vessels, particularly in commercial applications, is a significant contributor to market demand. Concurrently, continuous technological advancements enhancing battery energy density, lifespan, and safety are further solidifying the market's upward trajectory. The ongoing electrification and automation initiatives across the marine industry also present substantial opportunities for battery manufacturers.
Marine Battery Industry Market Size (In Billion)
Despite these favorable trends, the marine battery market encounters certain obstacles. The substantial initial investment required for adopting novel battery technologies presents a challenge, especially for smaller maritime operators. Additionally, the availability of charging infrastructure remains a limiting factor in specific geographic areas. Nevertheless, ongoing research and development focused on battery performance optimization, complemented by government incentives promoting green maritime technologies, are expected to overcome these restraints. Market segmentation indicates strong growth across both commercial and defense vessel segments, with lithium-ion batteries spearheading technological innovation. Key industry players, including EnerSys, Leclanché SA, and Toshiba Corporation, are actively contributing to this evolution through the development and supply of advanced battery solutions. Geographically, North America, Europe, and the Asia-Pacific region demonstrate considerable demand, reflecting the global commitment to sustainable maritime operations.
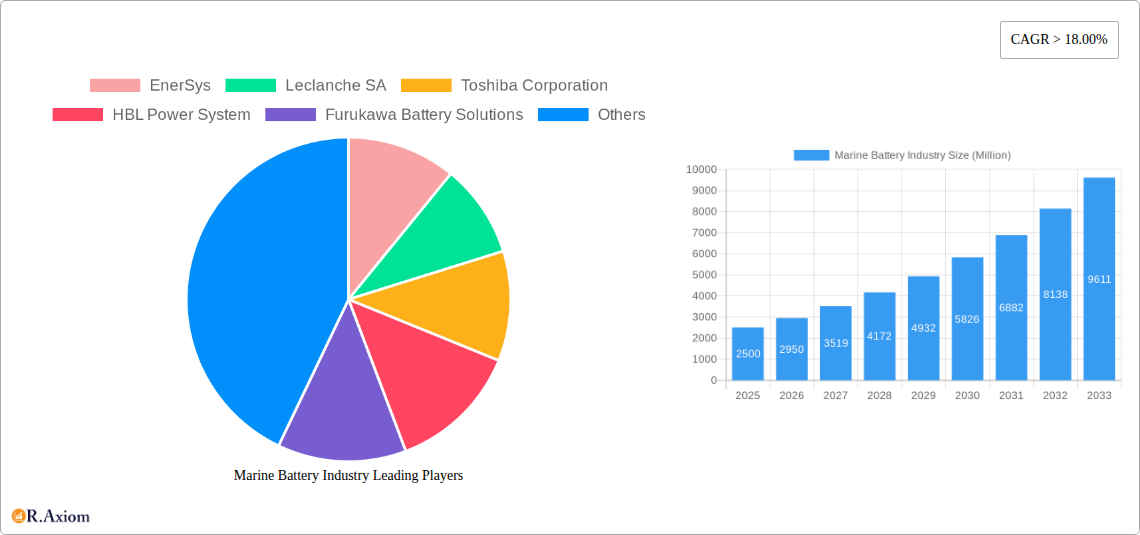
Marine Battery Industry Company Market Share
Marine Battery Industry Market Report: 2019-2033
This comprehensive report provides an in-depth analysis of the marine battery industry, encompassing market size, growth forecasts, technological advancements, competitive landscape, and key industry trends from 2019 to 2033. The study period covers 2019-2033, with 2025 as the base and estimated year. The forecast period is 2025-2033, and the historical period is 2019-2024. The report offers actionable insights for stakeholders, including manufacturers, investors, and policymakers, seeking to navigate this dynamic market. The market is segmented by battery type (Lithium-ion, Nickel-Cadmium, Fuel Cell, Lead Acid) and ship type (Commercial, Defense). Key players analyzed include EnerSys, Leclanche SA, Toshiba Corporation, HBL Power System, Furukawa Battery Solutions, Siemens AG, BorgWarner Inc, Wärtsilä, Saft, and Exide Technologies.
Marine Battery Industry Market Concentration & Innovation
The marine battery market exhibits a moderately concentrated structure, with several major players holding significant market share. While precise market share figures for each company are proprietary, it's estimated that the top five players collectively account for approximately 60% of the global market in 2025. Innovation is a crucial driver, propelled by the demand for higher energy density, longer lifespan, and improved safety features in marine batteries. Stringent environmental regulations, particularly regarding emissions from marine vessels, are further accelerating the adoption of cleaner energy solutions, fostering innovation in fuel cell and lithium-ion battery technologies. The regulatory landscape varies across regions, influencing technology adoption rates and investment decisions. Product substitutes, such as alternative propulsion systems (e.g., hydrogen fuel cells), pose a long-term competitive threat, but their current market penetration remains limited. End-user trends favor increased automation and electrification of vessels, driving demand for sophisticated battery systems. The market has witnessed several mergers and acquisitions (M&A) in recent years, with deal values exceeding $xx Million in some cases, indicative of consolidation and strategic expansion within the industry.
- Key Innovation Drivers: Increased energy density, improved safety features, reduced lifecycle costs, enhanced charging technologies.
- Regulatory Frameworks: IMO's emission reduction targets, regional variations in environmental regulations.
- M&A Activity: Significant consolidation in recent years, with deal values exceeding $xx Million in some notable transactions.
Marine Battery Industry Industry Trends & Insights
The marine battery market is experiencing robust growth, driven by increasing demand for environmentally friendly and efficient marine propulsion systems. The global market is projected to reach $xx Million by 2033, exhibiting a CAGR of xx% during the forecast period (2025-2033). Technological disruptions, particularly the advancements in lithium-ion battery technology, are significantly influencing market dynamics. Lithium-ion batteries are rapidly gaining market share due to their high energy density and improved performance compared to traditional lead-acid batteries. Consumer preferences are shifting towards longer-lasting, safer, and more environmentally friendly battery solutions. The market is characterized by intense competition among established players and emerging newcomers, driving innovation and cost reductions. The market penetration of lithium-ion batteries in the marine sector is expected to increase from xx% in 2025 to xx% by 2033, fueled by the declining cost of lithium-ion batteries and the increasing demand for electric and hybrid vessels.
Dominant Markets & Segments in Marine Battery Industry
The Asia-Pacific region is currently the dominant market for marine batteries, fueled by strong economic growth, expanding shipbuilding capacity, and increasing investments in maritime infrastructure. China, in particular, holds a significant market share due to its vast shipbuilding industry and its leading role in the production of lithium-ion batteries.
- Dominant Battery Segment: Lithium-ion batteries are projected to dominate the market by 2033 due to their high energy density, longer lifespan, and environmental benefits.
- Dominant Ship Type Segment: The commercial shipping segment currently constitutes the largest share of the marine battery market, although the defense segment is expected to witness strong growth in the coming years, driven by the increasing adoption of electric and hybrid propulsion systems in naval vessels.
Key Drivers for Dominant Regions/Segments:
- Asia-Pacific: Strong economic growth, large shipbuilding industry, government support for clean energy technologies.
- Lithium-ion Batteries: High energy density, longer lifespan, environmentally friendly characteristics, declining cost.
- Commercial Shipping: Large fleet size, increasing demand for fuel-efficient and emission-reducing vessels.
Marine Battery Industry Product Developments
Recent product innovations include the development of high-energy-density lithium-ion batteries with improved safety features, advanced battery management systems (BMS), and fast-charging capabilities. These advancements are enhancing the performance and reliability of marine battery systems, addressing concerns related to safety, lifespan, and charging infrastructure. The market is witnessing a shift towards modular battery systems, allowing for flexible configurations and easier maintenance. These advancements are improving the overall market fit and competitive advantages of various battery technologies.
Report Scope & Segmentation Analysis
This report segments the marine battery market by battery type (Lithium-ion, Nickel-Cadmium, Fuel Cell, Lead Acid) and ship type (Commercial, Defense). Each segment's growth projections, market size, and competitive dynamics are analyzed in detail.
- Lithium-ion: Projected to experience the fastest growth due to its high energy density and environmental benefits, with a significant increase in market share.
- Nickel-Cadmium: A mature market segment, experiencing gradual decline due to the rise of lithium-ion batteries.
- Fuel Cell: A niche segment with high growth potential, driven by advancements in fuel cell technology and increasing demand for zero-emission vessels.
- Lead Acid: A traditional market segment with a decreasing market share as lithium-ion and other battery technologies gain popularity.
- Commercial: The largest segment by market size, driven by the high volume of commercial shipping vessels.
- Defense: A smaller but rapidly growing segment, driven by increasing demand for electric and hybrid propulsion systems in naval vessels.
Key Drivers of Marine Battery Industry Growth
Several factors are driving the growth of the marine battery industry, including:
- Stringent environmental regulations: International Maritime Organization (IMO) regulations aimed at reducing greenhouse gas emissions from ships are compelling the adoption of cleaner energy solutions.
- Technological advancements: Advances in lithium-ion battery technology, particularly in energy density and lifespan, are making electric and hybrid propulsion systems more viable.
- Decreasing battery costs: The declining cost of lithium-ion batteries is making them increasingly competitive compared to traditional fuel sources.
- Government incentives: Several governments are providing incentives to encourage the adoption of electric and hybrid vessels.
Challenges in the Marine Battery Industry Sector
The marine battery industry faces several challenges, including:
- High initial investment costs: The cost of implementing electric and hybrid propulsion systems can be high, posing a barrier to adoption for some operators.
- Limited charging infrastructure: The lack of widespread charging infrastructure for marine batteries can hinder the adoption of electric vessels.
- Safety concerns: Concerns about the safety of lithium-ion batteries, particularly related to fire hazards, need to be addressed to ensure widespread adoption.
- Supply chain disruptions: Disruptions to the supply chain can affect the availability and cost of battery materials.
Emerging Opportunities in Marine Battery Industry
Emerging opportunities include:
- Development of advanced battery management systems (BMS): Improved BMS will enhance battery safety, performance, and lifespan.
- Expansion of charging infrastructure: Investments in charging infrastructure will facilitate the wider adoption of electric and hybrid vessels.
- Development of hybrid propulsion systems: Hybrid systems combine battery power with traditional fuel sources, offering a balanced solution.
- Growth of the defense sector: The increasing demand for electric and hybrid propulsion systems in naval vessels presents a significant growth opportunity.
Leading Players in the Marine Battery Industry Market
- EnerSys
- Leclanche SA
- Toshiba Corporation
- HBL Power System
- Furukawa Battery Solutions
- Siemens AG
- BorgWarner Inc
- Wärtsilä
- Saft
- Exide Technologies
Key Developments in Marine Battery Industry Industry
- October 2022: ABS (American Bureau of Shipping) and CATL (Contemporary Amperex Technology Co., Limited) signed a cooperation agreement to research lithium battery propulsion for next-generation vessels, focusing on safety-related technologies. This signifies a major step towards standardizing lithium-ion battery technology for marine applications and should accelerate adoption.
- January 2022: Vision Marine Technologies partnered with Octillion Power Systems to develop a custom high-voltage 35 kW battery pack for the recreational boating market. This indicates growing interest in battery-powered recreational vessels and signals an expansion into a new segment.
Strategic Outlook for Marine Battery Industry Market
The marine battery market is poised for significant growth over the next decade, driven by increasing demand for sustainable and efficient maritime transportation. Technological advancements, favorable government policies, and rising environmental concerns are key catalysts for market expansion. Opportunities exist for companies to invest in R&D, develop innovative battery technologies, and expand their market presence in emerging regions. The industry's future hinges on overcoming challenges related to cost, safety, and infrastructure development, requiring collaboration among stakeholders to unlock the full potential of electric and hybrid propulsion systems.
Marine Battery Industry Segmentation
-
1. Battery
- 1.1. Lithium-ion
- 1.2. Nickel-Cadmium
- 1.3. Fuel Cell
- 1.4. Lead Acid
-
2. Ship Type
- 2.1. Commercial
- 2.2. Defense
Marine Battery Industry Segmentation By Geography
-
1. North America
- 1.1. United States
- 1.2. Canada
-
2. Europe
- 2.1. Germany
- 2.2. United Kingdom
- 2.3. France
- 2.4. Russia
- 2.5. Rest of Europe
-
3. Asia Pacific
- 3.1. India
- 3.2. China
- 3.3. Japan
- 3.4. South Korea
- 3.5. Rest of Asia Pacific
-
4. Latin America
- 4.1. Brazil
- 4.2. Rest of Latin America
-
5. Middle East and Africa
- 5.1. United Arab Emirates
- 5.2. Saudi Arabia
- 5.3. Israel
- 5.4. South Africa
- 5.5. Rest of Middle East and Africa
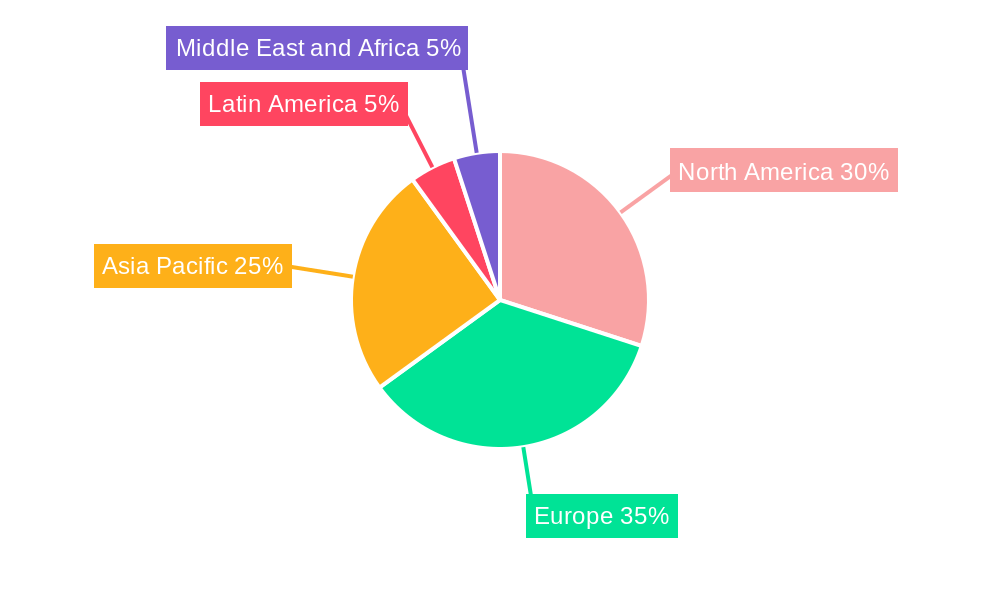
Marine Battery Industry Regional Market Share
Geographic Coverage of Marine Battery Industry
Marine Battery Industry REPORT HIGHLIGHTS
| Aspects | Details |
|---|---|
| Study Period | 2020-2034 |
| Base Year | 2025 |
| Estimated Year | 2026 |
| Forecast Period | 2026-2034 |
| Historical Period | 2020-2025 |
| Growth Rate | CAGR of 17.89% from 2020-2034 |
| Segmentation |
|
Table of Contents
- 1. Introduction
- 1.1. Research Scope
- 1.2. Market Segmentation
- 1.3. Research Objective
- 1.4. Definitions and Assumptions
- 2. Executive Summary
- 2.1. Market Snapshot
- 3. Market Dynamics
- 3.1. Market Drivers
- 3.2. Market Restrains
- 3.3. Market Trends
- 3.4. Market Opportunities
- 4. Market Factor Analysis
- 4.1. Porters Five Forces
- 4.1.1. Bargaining Power of Suppliers
- 4.1.2. Bargaining Power of Buyers
- 4.1.3. Threat of New Entrants
- 4.1.4. Threat of Substitutes
- 4.1.5. Competitive Rivalry
- 4.2. PESTEL analysis
- 4.3. BCG Analysis
- 4.3.1. Stars (High Growth, High Market Share)
- 4.3.2. Cash Cows (Low Growth, High Market Share)
- 4.3.3. Question Mark (High Growth, Low Market Share)
- 4.3.4. Dogs (Low Growth, Low Market Share)
- 4.4. Ansoff Matrix Analysis
- 4.5. Supply Chain Analysis
- 4.6. Regulatory Landscape
- 4.7. Current Market Potential and Opportunity Assessment (TAM–SAM–SOM Framework)
- 4.8. RAX Analyst Note
- 4.1. Porters Five Forces
- 5. Market Analysis, Insights and Forecast 2021-2033
- 5.1. Market Analysis, Insights and Forecast - by Battery
- 5.1.1. Lithium-ion
- 5.1.2. Nickel-Cadmium
- 5.1.3. Fuel Cell
- 5.1.4. Lead Acid
- 5.2. Market Analysis, Insights and Forecast - by Ship Type
- 5.2.1. Commercial
- 5.2.2. Defense
- 5.3. Market Analysis, Insights and Forecast - by Region
- 5.3.1. North America
- 5.3.2. Europe
- 5.3.3. Asia Pacific
- 5.3.4. Latin America
- 5.3.5. Middle East and Africa
- 5.1. Market Analysis, Insights and Forecast - by Battery
- 6. Global Marine Battery Industry Analysis, Insights and Forecast, 2021-2033
- 6.1. Market Analysis, Insights and Forecast - by Battery
- 6.1.1. Lithium-ion
- 6.1.2. Nickel-Cadmium
- 6.1.3. Fuel Cell
- 6.1.4. Lead Acid
- 6.2. Market Analysis, Insights and Forecast - by Ship Type
- 6.2.1. Commercial
- 6.2.2. Defense
- 6.1. Market Analysis, Insights and Forecast - by Battery
- 7. North America Marine Battery Industry Analysis, Insights and Forecast, 2020-2032
- 7.1. Market Analysis, Insights and Forecast - by Battery
- 7.1.1. Lithium-ion
- 7.1.2. Nickel-Cadmium
- 7.1.3. Fuel Cell
- 7.1.4. Lead Acid
- 7.2. Market Analysis, Insights and Forecast - by Ship Type
- 7.2.1. Commercial
- 7.2.2. Defense
- 7.1. Market Analysis, Insights and Forecast - by Battery
- 8. Europe Marine Battery Industry Analysis, Insights and Forecast, 2020-2032
- 8.1. Market Analysis, Insights and Forecast - by Battery
- 8.1.1. Lithium-ion
- 8.1.2. Nickel-Cadmium
- 8.1.3. Fuel Cell
- 8.1.4. Lead Acid
- 8.2. Market Analysis, Insights and Forecast - by Ship Type
- 8.2.1. Commercial
- 8.2.2. Defense
- 8.1. Market Analysis, Insights and Forecast - by Battery
- 9. Asia Pacific Marine Battery Industry Analysis, Insights and Forecast, 2020-2032
- 9.1. Market Analysis, Insights and Forecast - by Battery
- 9.1.1. Lithium-ion
- 9.1.2. Nickel-Cadmium
- 9.1.3. Fuel Cell
- 9.1.4. Lead Acid
- 9.2. Market Analysis, Insights and Forecast - by Ship Type
- 9.2.1. Commercial
- 9.2.2. Defense
- 9.1. Market Analysis, Insights and Forecast - by Battery
- 10. Latin America Marine Battery Industry Analysis, Insights and Forecast, 2020-2032
- 10.1. Market Analysis, Insights and Forecast - by Battery
- 10.1.1. Lithium-ion
- 10.1.2. Nickel-Cadmium
- 10.1.3. Fuel Cell
- 10.1.4. Lead Acid
- 10.2. Market Analysis, Insights and Forecast - by Ship Type
- 10.2.1. Commercial
- 10.2.2. Defense
- 10.1. Market Analysis, Insights and Forecast - by Battery
- 11. Middle East and Africa Marine Battery Industry Analysis, Insights and Forecast, 2020-2032
- 11.1. Market Analysis, Insights and Forecast - by Battery
- 11.1.1. Lithium-ion
- 11.1.2. Nickel-Cadmium
- 11.1.3. Fuel Cell
- 11.1.4. Lead Acid
- 11.2. Market Analysis, Insights and Forecast - by Ship Type
- 11.2.1. Commercial
- 11.2.2. Defense
- 11.1. Market Analysis, Insights and Forecast - by Battery
- 12. Competitive Analysis
- 12.1. Company Profiles
- 12.1.1 EnerSys
- 12.1.1.1. Company Overview
- 12.1.1.2. Products
- 12.1.1.3. Company Financials
- 12.1.1.4. SWOT Analysis
- 12.1.2 Leclanche SA
- 12.1.2.1. Company Overview
- 12.1.2.2. Products
- 12.1.2.3. Company Financials
- 12.1.2.4. SWOT Analysis
- 12.1.3 Toshiba Corporation
- 12.1.3.1. Company Overview
- 12.1.3.2. Products
- 12.1.3.3. Company Financials
- 12.1.3.4. SWOT Analysis
- 12.1.4 HBL Power System
- 12.1.4.1. Company Overview
- 12.1.4.2. Products
- 12.1.4.3. Company Financials
- 12.1.4.4. SWOT Analysis
- 12.1.5 Furukawa Battery Solutions
- 12.1.5.1. Company Overview
- 12.1.5.2. Products
- 12.1.5.3. Company Financials
- 12.1.5.4. SWOT Analysis
- 12.1.6 Siemens AG
- 12.1.6.1. Company Overview
- 12.1.6.2. Products
- 12.1.6.3. Company Financials
- 12.1.6.4. SWOT Analysis
- 12.1.7 BorgWarner Inc
- 12.1.7.1. Company Overview
- 12.1.7.2. Products
- 12.1.7.3. Company Financials
- 12.1.7.4. SWOT Analysis
- 12.1.8 Wartsila
- 12.1.8.1. Company Overview
- 12.1.8.2. Products
- 12.1.8.3. Company Financials
- 12.1.8.4. SWOT Analysis
- 12.1.9 Saft
- 12.1.9.1. Company Overview
- 12.1.9.2. Products
- 12.1.9.3. Company Financials
- 12.1.9.4. SWOT Analysis
- 12.1.10 Exide Technologies
- 12.1.10.1. Company Overview
- 12.1.10.2. Products
- 12.1.10.3. Company Financials
- 12.1.10.4. SWOT Analysis
- 12.1.1 EnerSys
- 12.2. Market Entropy
- 12.2.1 Company's Key Areas Served
- 12.2.2 Recent Developments
- 12.3. Company Market Share Analysis 2025
- 12.3.1 Top 5 Companies Market Share Analysis
- 12.3.2 Top 3 Companies Market Share Analysis
- 12.4. List of Potential Customers
- 13. Research Methodology
List of Figures
- Figure 1: Global Marine Battery Industry Revenue Breakdown (billion, %) by Region 2025 & 2033
- Figure 2: North America Marine Battery Industry Revenue (billion), by Battery 2025 & 2033
- Figure 3: North America Marine Battery Industry Revenue Share (%), by Battery 2025 & 2033
- Figure 4: North America Marine Battery Industry Revenue (billion), by Ship Type 2025 & 2033
- Figure 5: North America Marine Battery Industry Revenue Share (%), by Ship Type 2025 & 2033
- Figure 6: North America Marine Battery Industry Revenue (billion), by Country 2025 & 2033
- Figure 7: North America Marine Battery Industry Revenue Share (%), by Country 2025 & 2033
- Figure 8: Europe Marine Battery Industry Revenue (billion), by Battery 2025 & 2033
- Figure 9: Europe Marine Battery Industry Revenue Share (%), by Battery 2025 & 2033
- Figure 10: Europe Marine Battery Industry Revenue (billion), by Ship Type 2025 & 2033
- Figure 11: Europe Marine Battery Industry Revenue Share (%), by Ship Type 2025 & 2033
- Figure 12: Europe Marine Battery Industry Revenue (billion), by Country 2025 & 2033
- Figure 13: Europe Marine Battery Industry Revenue Share (%), by Country 2025 & 2033
- Figure 14: Asia Pacific Marine Battery Industry Revenue (billion), by Battery 2025 & 2033
- Figure 15: Asia Pacific Marine Battery Industry Revenue Share (%), by Battery 2025 & 2033
- Figure 16: Asia Pacific Marine Battery Industry Revenue (billion), by Ship Type 2025 & 2033
- Figure 17: Asia Pacific Marine Battery Industry Revenue Share (%), by Ship Type 2025 & 2033
- Figure 18: Asia Pacific Marine Battery Industry Revenue (billion), by Country 2025 & 2033
- Figure 19: Asia Pacific Marine Battery Industry Revenue Share (%), by Country 2025 & 2033
- Figure 20: Latin America Marine Battery Industry Revenue (billion), by Battery 2025 & 2033
- Figure 21: Latin America Marine Battery Industry Revenue Share (%), by Battery 2025 & 2033
- Figure 22: Latin America Marine Battery Industry Revenue (billion), by Ship Type 2025 & 2033
- Figure 23: Latin America Marine Battery Industry Revenue Share (%), by Ship Type 2025 & 2033
- Figure 24: Latin America Marine Battery Industry Revenue (billion), by Country 2025 & 2033
- Figure 25: Latin America Marine Battery Industry Revenue Share (%), by Country 2025 & 2033
- Figure 26: Middle East and Africa Marine Battery Industry Revenue (billion), by Battery 2025 & 2033
- Figure 27: Middle East and Africa Marine Battery Industry Revenue Share (%), by Battery 2025 & 2033
- Figure 28: Middle East and Africa Marine Battery Industry Revenue (billion), by Ship Type 2025 & 2033
- Figure 29: Middle East and Africa Marine Battery Industry Revenue Share (%), by Ship Type 2025 & 2033
- Figure 30: Middle East and Africa Marine Battery Industry Revenue (billion), by Country 2025 & 2033
- Figure 31: Middle East and Africa Marine Battery Industry Revenue Share (%), by Country 2025 & 2033
List of Tables
- Table 1: Global Marine Battery Industry Revenue billion Forecast, by Battery 2020 & 2033
- Table 2: Global Marine Battery Industry Revenue billion Forecast, by Ship Type 2020 & 2033
- Table 3: Global Marine Battery Industry Revenue billion Forecast, by Region 2020 & 2033
- Table 4: Global Marine Battery Industry Revenue billion Forecast, by Battery 2020 & 2033
- Table 5: Global Marine Battery Industry Revenue billion Forecast, by Ship Type 2020 & 2033
- Table 6: Global Marine Battery Industry Revenue billion Forecast, by Country 2020 & 2033
- Table 7: United States Marine Battery Industry Revenue (billion) Forecast, by Application 2020 & 2033
- Table 8: Canada Marine Battery Industry Revenue (billion) Forecast, by Application 2020 & 2033
- Table 9: Global Marine Battery Industry Revenue billion Forecast, by Battery 2020 & 2033
- Table 10: Global Marine Battery Industry Revenue billion Forecast, by Ship Type 2020 & 2033
- Table 11: Global Marine Battery Industry Revenue billion Forecast, by Country 2020 & 2033
- Table 12: Germany Marine Battery Industry Revenue (billion) Forecast, by Application 2020 & 2033
- Table 13: United Kingdom Marine Battery Industry Revenue (billion) Forecast, by Application 2020 & 2033
- Table 14: France Marine Battery Industry Revenue (billion) Forecast, by Application 2020 & 2033
- Table 15: Russia Marine Battery Industry Revenue (billion) Forecast, by Application 2020 & 2033
- Table 16: Rest of Europe Marine Battery Industry Revenue (billion) Forecast, by Application 2020 & 2033
- Table 17: Global Marine Battery Industry Revenue billion Forecast, by Battery 2020 & 2033
- Table 18: Global Marine Battery Industry Revenue billion Forecast, by Ship Type 2020 & 2033
- Table 19: Global Marine Battery Industry Revenue billion Forecast, by Country 2020 & 2033
- Table 20: India Marine Battery Industry Revenue (billion) Forecast, by Application 2020 & 2033
- Table 21: China Marine Battery Industry Revenue (billion) Forecast, by Application 2020 & 2033
- Table 22: Japan Marine Battery Industry Revenue (billion) Forecast, by Application 2020 & 2033
- Table 23: South Korea Marine Battery Industry Revenue (billion) Forecast, by Application 2020 & 2033
- Table 24: Rest of Asia Pacific Marine Battery Industry Revenue (billion) Forecast, by Application 2020 & 2033
- Table 25: Global Marine Battery Industry Revenue billion Forecast, by Battery 2020 & 2033
- Table 26: Global Marine Battery Industry Revenue billion Forecast, by Ship Type 2020 & 2033
- Table 27: Global Marine Battery Industry Revenue billion Forecast, by Country 2020 & 2033
- Table 28: Brazil Marine Battery Industry Revenue (billion) Forecast, by Application 2020 & 2033
- Table 29: Rest of Latin America Marine Battery Industry Revenue (billion) Forecast, by Application 2020 & 2033
- Table 30: Global Marine Battery Industry Revenue billion Forecast, by Battery 2020 & 2033
- Table 31: Global Marine Battery Industry Revenue billion Forecast, by Ship Type 2020 & 2033
- Table 32: Global Marine Battery Industry Revenue billion Forecast, by Country 2020 & 2033
- Table 33: United Arab Emirates Marine Battery Industry Revenue (billion) Forecast, by Application 2020 & 2033
- Table 34: Saudi Arabia Marine Battery Industry Revenue (billion) Forecast, by Application 2020 & 2033
- Table 35: Israel Marine Battery Industry Revenue (billion) Forecast, by Application 2020 & 2033
- Table 36: South Africa Marine Battery Industry Revenue (billion) Forecast, by Application 2020 & 2033
- Table 37: Rest of Middle East and Africa Marine Battery Industry Revenue (billion) Forecast, by Application 2020 & 2033
Frequently Asked Questions
1. What is the projected Compound Annual Growth Rate (CAGR) of the Marine Battery Industry?
The projected CAGR is approximately 17.89%.
2. Which companies are prominent players in the Marine Battery Industry?
Key companies in the market include EnerSys, Leclanche SA, Toshiba Corporation, HBL Power System, Furukawa Battery Solutions, Siemens AG, BorgWarner Inc, Wartsila, Saft, Exide Technologies.
3. What are the main segments of the Marine Battery Industry?
The market segments include Battery, Ship Type.
4. Can you provide details about the market size?
The market size is estimated to be USD 1.54 billion as of 2022.
5. What are some drivers contributing to market growth?
Increasing Adoption of 2-wheelers across the Globe.
6. What are the notable trends driving market growth?
Lithium-ion Segment is Projected to Highest Growth During the Forecast Period.
7. Are there any restraints impacting market growth?
Rise in demand of Electric Vehicles.
8. Can you provide examples of recent developments in the market?
October 2022: ABS signed a cooperation agreement with Contemporary Amperex Technology Co., Limited (CATL) to work together and research lithium battery propulsion for next-generation vessels. Under the agreement, the two companies would carry out research on the technical standards for battery-powered vessels, which includes key safety-related technologies such as the charging system, power battery compartment layout, propulsion system, and fire control.
9. What pricing options are available for accessing the report?
Pricing options include single-user, multi-user, and enterprise licenses priced at USD 4750, USD 5250, and USD 8750 respectively.
10. Is the market size provided in terms of value or volume?
The market size is provided in terms of value, measured in billion.
11. Are there any specific market keywords associated with the report?
Yes, the market keyword associated with the report is "Marine Battery Industry," which aids in identifying and referencing the specific market segment covered.
12. How do I determine which pricing option suits my needs best?
The pricing options vary based on user requirements and access needs. Individual users may opt for single-user licenses, while businesses requiring broader access may choose multi-user or enterprise licenses for cost-effective access to the report.
13. Are there any additional resources or data provided in the Marine Battery Industry report?
While the report offers comprehensive insights, it's advisable to review the specific contents or supplementary materials provided to ascertain if additional resources or data are available.
14. How can I stay updated on further developments or reports in the Marine Battery Industry?
To stay informed about further developments, trends, and reports in the Marine Battery Industry, consider subscribing to industry newsletters, following relevant companies and organizations, or regularly checking reputable industry news sources and publications.
Methodology
Step 1 - Identification of Relevant Samples Size from Population Database


Step 2 - Approaches for Defining Global Market Size (Value, Volume* & Price*)

Note*: In applicable scenarios
Step 3 - Data Sources
Primary Research
- Web Analytics
- Survey Reports
- Research Institute
- Latest Research Reports
- Opinion Leaders
Secondary Research
- Annual Reports
- White Paper
- Latest Press Release
- Industry Association
- Paid Database
- Investor Presentations

Step 4 - Data Triangulation
Involves using different sources of information in order to increase the validity of a study
These sources are likely to be stakeholders in a program - participants, other researchers, program staff, other community members, and so on.
Then we put all data in single framework & apply various statistical tools to find out the dynamic on the market.
During the analysis stage, feedback from the stakeholder groups would be compared to determine areas of agreement as well as areas of divergence