Key Insights
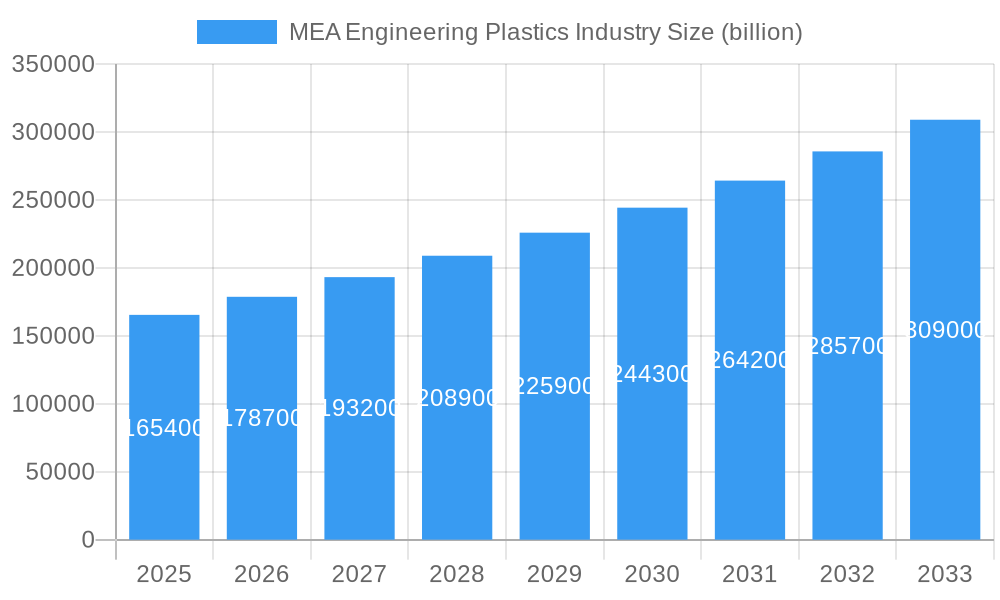
The Middle East and Africa (MEA) engineering plastics market is poised for robust expansion, driven by escalating demand across diverse industrial sectors. The market is projected to reach an estimated $165.4 billion by 2025, exhibiting a compelling Compound Annual Growth Rate (CAGR) of 8.1% throughout the forecast period of 2025-2033. This significant growth is fueled by the increasing adoption of lightweight and high-performance materials in the automotive and transportation sector, aiming to enhance fuel efficiency and reduce emissions. Furthermore, the booming construction industry, particularly in developing economies within the region, is a key contributor, with engineering plastics finding extensive use in building components, insulation, and infrastructure development. The burgeoning consumer goods market and the rapid advancements in the electrical and electronics sector, necessitating durable and advanced materials, are also pivotal growth drivers. Innovations in material science and the development of specialized engineering plastics tailored for specific applications are further propelling market penetration.
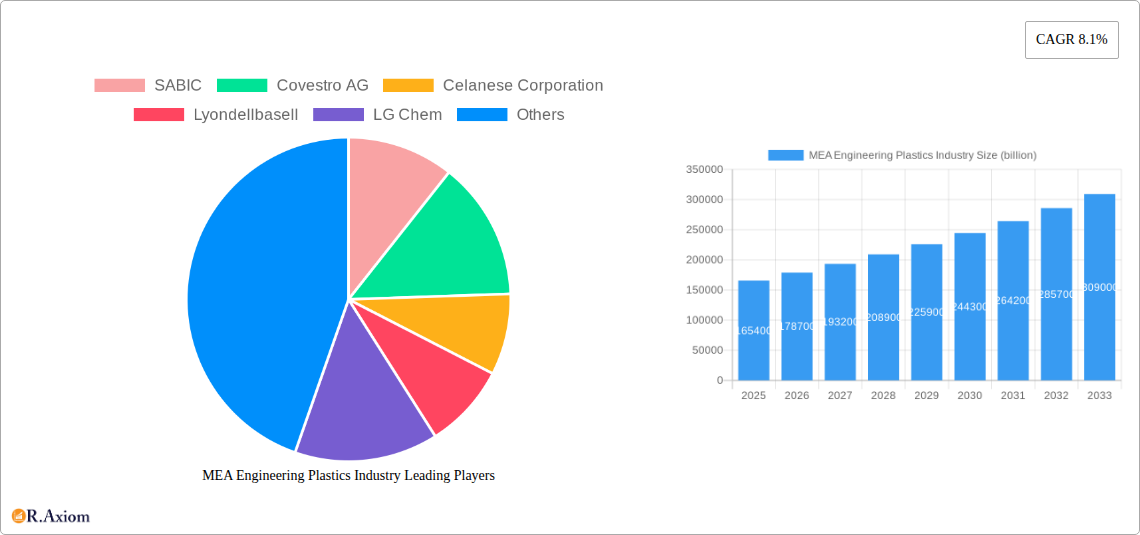
MEA Engineering Plastics Industry Market Size (In Billion)
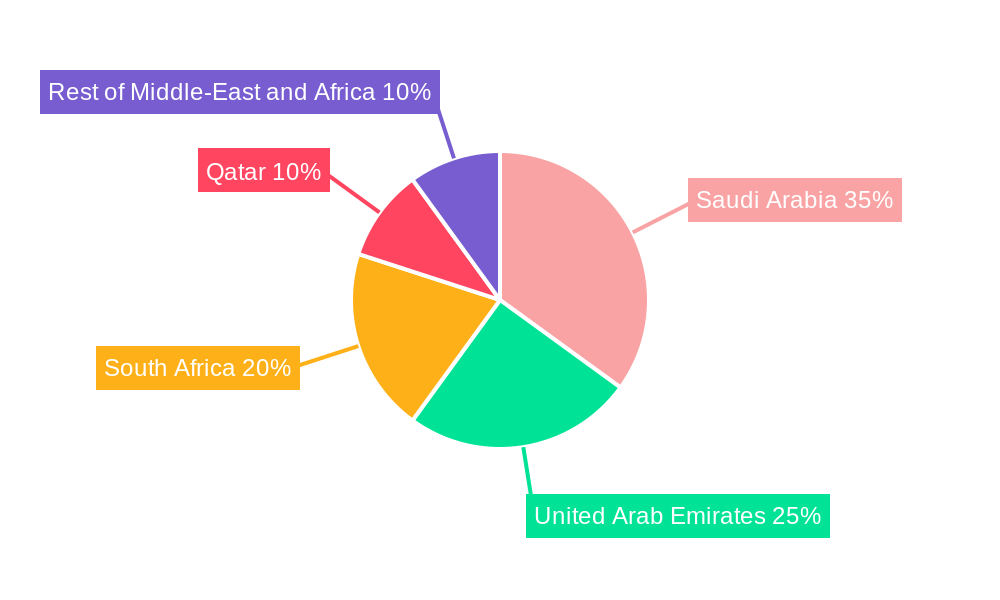
The MEA engineering plastics landscape is characterized by a dynamic interplay of trends and challenges. While the region benefits from substantial infrastructure projects and a growing manufacturing base, certain restraints, such as fluctuating raw material prices and the availability of skilled labor, warrant strategic attention. Key product segments like Polycarbonate (PC), Polyethylene Terephthalate (PET), and Polypropylene (PP) are witnessing substantial demand due to their versatile properties and cost-effectiveness. The increasing focus on sustainability is also driving the demand for recyclable and bio-based engineering plastics. Geographically, Saudi Arabia and the United Arab Emirates are emerging as prominent hubs, owing to their strong economic growth and diversification initiatives. The market's future trajectory will be shaped by strategic collaborations, technological advancements, and the ability of manufacturers to address the evolving needs of industries and regulatory landscapes across the diverse MEA region.
MEA Engineering Plastics Industry Company Market Share
MEA Engineering Plastics Industry Market Research Report: Comprehensive Analysis and Future Outlook
This report provides an in-depth analysis of the Middle East and Africa (MEA) Engineering Plastics industry, offering detailed insights into market dynamics, key trends, growth drivers, challenges, and opportunities. Covering the period from 2019 to 2033, with a base year of 2025 and a forecast period of 2025-2033, this comprehensive study is designed to equip industry stakeholders with actionable intelligence for strategic decision-making. The MEA engineering plastics market is projected to witness significant expansion, driven by increasing demand across diverse end-use sectors such as automotive, electronics, and construction. The report delves into product type segmentation, application-specific demand, and regional market variations, highlighting the evolving competitive landscape and emerging growth avenues.
MEA Engineering Plastics Industry Market Concentration & Innovation
The MEA engineering plastics market exhibits a moderate to high degree of concentration, with a few dominant global players holding substantial market share. The presence of major chemical manufacturers like SABIC, Covestro AG, Celanese Corporation, and LyondellBasell underscores this concentration. Innovation plays a pivotal role in shaping the competitive landscape, with companies investing heavily in research and development to introduce high-performance materials that cater to increasingly stringent industry requirements. Key innovation drivers include the pursuit of lighter, stronger, and more sustainable engineering plastics, particularly for the automotive and aerospace sectors. Regulatory frameworks, while varying across countries, are increasingly focused on environmental compliance and product safety, influencing material development and adoption. Product substitutes, though present, often fall short of the specialized performance characteristics offered by engineering plastics in demanding applications. End-user trends point towards a growing demand for advanced materials with enhanced thermal resistance, chemical inertness, and mechanical strength. Mergers and acquisitions (M&A) activities are a significant aspect of market dynamics, with strategic partnerships and acquisitions aimed at expanding product portfolios, market reach, and technological capabilities. For instance, M&A deals valued in the billions of dollars have been observed as companies seek to consolidate their positions and gain a competitive edge. The report details specific M&A events and their impact on market share distribution.
MEA Engineering Plastics Industry Industry Trends & Insights
The MEA engineering plastics market is poised for robust growth, driven by several interconnected factors. A primary growth driver is the burgeoning automotive sector, particularly in regions like the UAE and Saudi Arabia, where investments in local manufacturing and the adoption of lightweight, fuel-efficient vehicles are on the rise. This translates into a significant demand for engineering plastics like Polycarbonate (PC), ABS, and Polyamides for interior and exterior components. Technological disruptions, such as advancements in additive manufacturing (3D printing) using engineering plastics, are opening new application possibilities and reshaping product design across industries. Consumer preferences are increasingly shifting towards durable, aesthetically pleasing, and eco-friendly products, which engineering plastics are well-positioned to meet. For example, the demand for high-clarity and impact-resistant plastics in consumer electronics and packaging is growing. Competitive dynamics are characterized by intense R&D efforts, strategic collaborations, and a focus on cost-effectiveness. The overall market is projected to grow at a Compound Annual Growth Rate (CAGR) of approximately 7.5% from 2025 to 2033, with market penetration expected to increase significantly in emerging economies within the MEA region. The increasing adoption of sophisticated materials in building and construction, particularly for insulation and high-performance components, also contributes to market expansion. Furthermore, the growing medical device industry in the region, requiring biocompatible and sterilizable engineering plastics, presents a substantial growth opportunity.
Dominant Markets & Segments in MEA Engineering Plastics Industry
The MEA Engineering Plastics Industry is characterized by distinct dominant markets and segments, each driven by unique economic policies, infrastructure development, and consumer demands.
Dominant Geography: Saudi Arabia is emerging as a dominant market within the MEA region, propelled by substantial government investments in industrial diversification under initiatives like Saudi Vision 2030. This includes the expansion of the automotive manufacturing sector and significant infrastructure projects in construction, creating a high demand for various engineering plastics. The United Arab Emirates also holds a strong position, particularly in the automotive and electronics sectors, supported by its robust trade and logistics infrastructure.
- Key Drivers for Dominant Geography:
- Economic Policies: Government-backed industrialization programs and foreign direct investment incentives.
- Infrastructure Development: Large-scale construction projects and advancements in transportation networks.
- End-User Industry Growth: Expansion of automotive manufacturing, electronics assembly, and the petrochemical industry itself.
Dominant Product Type: Polycarbonate (PC) is a leading product segment due to its exceptional impact resistance, optical clarity, and thermal stability. Its widespread application in automotive glazing, electronic enclosures, and construction materials drives its dominance. Polyamides (PA) are also highly significant, particularly in automotive under-the-hood applications and industrial machinery, owing to their excellent mechanical properties and chemical resistance. Styrene Copolymers (ABS & SAN) are widely used in consumer goods and electronics due to their balance of properties and cost-effectiveness.
- Key Drivers for Dominant Product Types:
- Performance Requirements: Demand for high impact strength, heat resistance, and chemical inertness in critical applications.
- Lightweighting Trends: Replacement of traditional materials like metal and glass in automotive and aerospace.
- Cost-Effectiveness: Balancing superior performance with economic viability for mass-market applications.
Dominant Application: The Automotive and Transportation sector is the primary application driving the MEA engineering plastics market. The increasing focus on lightweighting vehicles for improved fuel efficiency and emission reduction fuels the demand for engineering plastics in various components, from interior trims to structural parts. Electrical and Electronics is another significant segment, with the growing consumer electronics market and the expansion of smart city initiatives requiring advanced materials for housings, connectors, and components.
- Key Drivers for Dominant Applications:
- Automotive Industry Growth: Increasing vehicle production and the demand for advanced, lighter materials.
- Consumer Electronics Penetration: Rising disposable incomes and the adoption of new electronic devices.
- Urbanization and Infrastructure: Demand for durable and high-performance materials in construction and infrastructure projects.
The Rest of Middle-East and Africa also presents significant untapped potential, with countries like Egypt and Nigeria showing promising growth trajectories in their respective industrial sectors. The report provides detailed market size estimations and competitive dynamics for each of these segments.
MEA Engineering Plastics Industry Product Developments
Product innovations in MEA engineering plastics are focused on enhancing material performance, sustainability, and application versatility. Key developments include the introduction of advanced composites with superior strength-to-weight ratios for automotive structural components, and the creation of bio-based or recycled engineering plastics to meet growing environmental concerns. Companies are also developing specialized grades of polymers like PEEK and PPS for high-temperature and chemically aggressive environments in the industrial sector. The competitive advantage lies in offering tailor-made solutions that address specific end-user needs, leading to improved product longevity, reduced energy consumption, and enhanced recyclability.
Report Scope & Segmentation Analysis
This report segments the MEA Engineering Plastics Industry based on Product Type, Application, and Geography. The Product Type segmentation includes Fluoropolymers, Polycarbonate (PC), Polyethylene Terephthalate (PET), Polybutylene Terephthalate (PBT), Polyacetal/ Polyoxymethylene, Polymethyl Methacrylate (PMMA), Polyphenylene Oxide, Polyphenylene Sulfide (PPS), Styrene Copolymers (ABS & SAN), Liquid Crystal Polymers (LCP), Polyether Ether Ketone (PEEK), Polyimides (PI), and Polyamides. The Application segmentation covers Automotive and Transportation, Building and Construction, Consumer Goods, Electrical and Electronics, Industrial and Machinery, Packaging, and Medical. Geographically, the market is analyzed across Saudi Arabia, South Africa, Qatar, United Arab Emirates, and the Rest of Middle-East and Africa. Each segment is analyzed for its market size, projected growth rates, and key competitive dynamics, with specific insights into market penetration and future potential.
Key Drivers of MEA Engineering Plastics Industry Growth
The growth of the MEA Engineering Plastics industry is propelled by several key factors. Firstly, the expanding automotive sector, driven by increasing vehicle production and the demand for lightweighting, is a primary catalyst. Secondly, significant investments in infrastructure development and construction projects across the region fuel the demand for durable and high-performance materials. Thirdly, the burgeoning electronics and consumer goods sectors, coupled with rising disposable incomes, contribute to a greater adoption of engineering plastics. Technological advancements, such as the development of advanced polymer grades with superior mechanical and thermal properties, and the increasing focus on sustainability and recyclability, are also crucial growth enablers. Government initiatives promoting industrial diversification and manufacturing are further stimulating market expansion.
Challenges in the MEA Engineering Plastics Industry Sector
Despite the robust growth prospects, the MEA Engineering Plastics industry faces several challenges. Regulatory hurdles, including evolving environmental standards and import/export regulations, can impact market access and operational costs. Supply chain disruptions, exacerbated by geopolitical factors and logistical complexities within the vast MEA region, can lead to price volatility and delivery delays. Intense competition from both global and regional players, coupled with the availability of lower-cost commodity plastics, presents a constant pressure on profit margins. Furthermore, a lack of skilled labor and the need for specialized technical expertise in handling and processing certain engineering plastics can hinder widespread adoption in some sectors. Fluctuations in raw material prices also pose a significant challenge to consistent pricing strategies.
Emerging Opportunities in MEA Engineering Plastics Industry
The MEA Engineering Plastics industry is ripe with emerging opportunities. The rapidly growing renewable energy sector, particularly solar power, presents a demand for durable and weather-resistant engineering plastics in solar panel components. The expansion of the healthcare sector and the increasing demand for sophisticated medical devices create a significant market for biocompatible and sterilizable engineering plastics. The push towards sustainable manufacturing and circular economy principles opens avenues for the development and adoption of bio-based and recycled engineering plastics. Furthermore, the growing middle class and increasing urbanization in many African nations represent a vast, untapped market for consumer goods and construction materials utilizing engineering plastics. The development of localized manufacturing capabilities and the adoption of advanced processing technologies will further unlock these opportunities.
Leading Players in the MEA Engineering Plastics Industry Market
- SABIC
- Covestro AG
- Celanese Corporation
- LyondellBasell
- LG Chem
- DuPont
- Solvay
- Evonik Industries AG
- Eastman Chemical Company
- 3M
- Chemtura Corporation
- Chevron Phillips Chemical
- Arkema SA
- LANXESS
- Nova Chemicals Corporation
- Ashland Inc
- PolyOne Corporation
- BASF SE
Key Developments in MEA Engineering Plastics Industry Industry
- 2023: SABIC launches a new range of high-performance polycarbonates with enhanced UV resistance for automotive applications.
- 2023: Covestro AG announces expansion plans for its polymer production facility in the UAE to meet growing regional demand.
- 2024: LyondellBasell invests in a new compounding facility in Saudi Arabia to cater to the growing automotive sector.
- 2024: Celanese Corporation acquires a specialty polymers business to strengthen its portfolio in advanced materials for electronics.
- 2024: LG Chem expands its R&D capabilities in engineering plastics, focusing on sustainable solutions for the MEA market.
Strategic Outlook for MEA Engineering Plastics Industry Market
The strategic outlook for the MEA Engineering Plastics Industry is highly positive, characterized by sustained growth and evolving market dynamics. Future market potential will be significantly shaped by the continued expansion of key end-use industries like automotive and electronics, coupled with the growing emphasis on sustainability and lightweighting. Companies that focus on developing innovative, high-performance, and eco-friendly engineering plastic solutions, while also investing in local production and distribution networks, are best positioned for success. Strategic partnerships, M&A activities, and a keen understanding of regional regulatory landscapes will be crucial for navigating the competitive environment. The increasing adoption of advanced materials in emerging economies within the MEA region presents a substantial opportunity for market penetration and long-term growth.
MEA Engineering Plastics Industry Segmentation
-
1. Product Type
- 1.1. Fluoropolymers
- 1.2. Polycarbonate (PC)
- 1.3. Polyethylene Terephthalate (PET)
- 1.4. Polybutylene Terephthalate (PBT)
- 1.5. Polyacetal/ Polyoxymethylene
- 1.6. Polymethyl Methacrylate (PMMA)
- 1.7. Polyphenylene Oxide
- 1.8. Polyphenylene Sulfide (PPS)
- 1.9. Styrene Copolymers (ABS & SAN)
- 1.10. Liquid Crystal Polymers (LCP)
- 1.11. Polyether Ether Ketone (PEEK)
- 1.12. Polyimides (PI)
- 1.13. Polyamides
-
2. Application
- 2.1. Automotive and Transportation
- 2.2. Building and Construction
- 2.3. Consumer Goods
- 2.4. Electrical and Electronics
- 2.5. Industrial and Machinery
- 2.6. Packaging
- 2.7. Medical
-
3. Geography
- 3.1. Saudi Arabia
- 3.2. South Africa
- 3.3. Qatar
- 3.4. United Arab Emirates
- 3.5. Rest of Middle-East and Africa
MEA Engineering Plastics Industry Segmentation By Geography
- 1. Saudi Arabia
- 2. South Africa
- 3. Qatar
- 4. United Arab Emirates
- 5. Rest of Middle East and Africa
MEA Engineering Plastics Industry Regional Market Share
Geographic Coverage of MEA Engineering Plastics Industry
MEA Engineering Plastics Industry REPORT HIGHLIGHTS
| Aspects | Details |
|---|---|
| Study Period | 2020-2034 |
| Base Year | 2025 |
| Estimated Year | 2026 |
| Forecast Period | 2026-2034 |
| Historical Period | 2020-2025 |
| Growth Rate | CAGR of 4.1% from 2020-2034 |
| Segmentation |
|
Table of Contents
- 1. Introduction
- 1.1. Research Scope
- 1.2. Market Segmentation
- 1.3. Research Objective
- 1.4. Definitions and Assumptions
- 2. Executive Summary
- 2.1. Market Snapshot
- 3. Market Dynamics
- 3.1. Market Drivers
- 3.2. Market Restrains
- 3.3. Market Trends
- 3.4. Market Opportunities
- 4. Market Factor Analysis
- 4.1. Porters Five Forces
- 4.1.1. Bargaining Power of Suppliers
- 4.1.2. Bargaining Power of Buyers
- 4.1.3. Threat of New Entrants
- 4.1.4. Threat of Substitutes
- 4.1.5. Competitive Rivalry
- 4.2. PESTEL analysis
- 4.3. BCG Analysis
- 4.3.1. Stars (High Growth, High Market Share)
- 4.3.2. Cash Cows (Low Growth, High Market Share)
- 4.3.3. Question Mark (High Growth, Low Market Share)
- 4.3.4. Dogs (Low Growth, Low Market Share)
- 4.4. Ansoff Matrix Analysis
- 4.5. Supply Chain Analysis
- 4.6. Regulatory Landscape
- 4.7. Current Market Potential and Opportunity Assessment (TAM–SAM–SOM Framework)
- 4.8. RAX Analyst Note
- 4.1. Porters Five Forces
- 5. Market Analysis, Insights and Forecast 2021-2033
- 5.1. Market Analysis, Insights and Forecast - by Product Type
- 5.1.1. Fluoropolymers
- 5.1.2. Polycarbonate (PC)
- 5.1.3. Polyethylene Terephthalate (PET)
- 5.1.4. Polybutylene Terephthalate (PBT)
- 5.1.5. Polyacetal/ Polyoxymethylene
- 5.1.6. Polymethyl Methacrylate (PMMA)
- 5.1.7. Polyphenylene Oxide
- 5.1.8. Polyphenylene Sulfide (PPS)
- 5.1.9. Styrene Copolymers (ABS & SAN)
- 5.1.10. Liquid Crystal Polymers (LCP)
- 5.1.11. Polyether Ether Ketone (PEEK)
- 5.1.12. Polyimides (PI)
- 5.1.13. Polyamides
- 5.2. Market Analysis, Insights and Forecast - by Application
- 5.2.1. Automotive and Transportation
- 5.2.2. Building and Construction
- 5.2.3. Consumer Goods
- 5.2.4. Electrical and Electronics
- 5.2.5. Industrial and Machinery
- 5.2.6. Packaging
- 5.2.7. Medical
- 5.3. Market Analysis, Insights and Forecast - by Geography
- 5.3.1. Saudi Arabia
- 5.3.2. South Africa
- 5.3.3. Qatar
- 5.3.4. United Arab Emirates
- 5.3.5. Rest of Middle-East and Africa
- 5.4. Market Analysis, Insights and Forecast - by Region
- 5.4.1. Saudi Arabia
- 5.4.2. South Africa
- 5.4.3. Qatar
- 5.4.4. United Arab Emirates
- 5.4.5. Rest of Middle East and Africa
- 5.1. Market Analysis, Insights and Forecast - by Product Type
- 6. Global MEA Engineering Plastics Industry Analysis, Insights and Forecast, 2021-2033
- 6.1. Market Analysis, Insights and Forecast - by Product Type
- 6.1.1. Fluoropolymers
- 6.1.2. Polycarbonate (PC)
- 6.1.3. Polyethylene Terephthalate (PET)
- 6.1.4. Polybutylene Terephthalate (PBT)
- 6.1.5. Polyacetal/ Polyoxymethylene
- 6.1.6. Polymethyl Methacrylate (PMMA)
- 6.1.7. Polyphenylene Oxide
- 6.1.8. Polyphenylene Sulfide (PPS)
- 6.1.9. Styrene Copolymers (ABS & SAN)
- 6.1.10. Liquid Crystal Polymers (LCP)
- 6.1.11. Polyether Ether Ketone (PEEK)
- 6.1.12. Polyimides (PI)
- 6.1.13. Polyamides
- 6.2. Market Analysis, Insights and Forecast - by Application
- 6.2.1. Automotive and Transportation
- 6.2.2. Building and Construction
- 6.2.3. Consumer Goods
- 6.2.4. Electrical and Electronics
- 6.2.5. Industrial and Machinery
- 6.2.6. Packaging
- 6.2.7. Medical
- 6.3. Market Analysis, Insights and Forecast - by Geography
- 6.3.1. Saudi Arabia
- 6.3.2. South Africa
- 6.3.3. Qatar
- 6.3.4. United Arab Emirates
- 6.3.5. Rest of Middle-East and Africa
- 6.1. Market Analysis, Insights and Forecast - by Product Type
- 7. Saudi Arabia MEA Engineering Plastics Industry Analysis, Insights and Forecast, 2020-2032
- 7.1. Market Analysis, Insights and Forecast - by Product Type
- 7.1.1. Fluoropolymers
- 7.1.2. Polycarbonate (PC)
- 7.1.3. Polyethylene Terephthalate (PET)
- 7.1.4. Polybutylene Terephthalate (PBT)
- 7.1.5. Polyacetal/ Polyoxymethylene
- 7.1.6. Polymethyl Methacrylate (PMMA)
- 7.1.7. Polyphenylene Oxide
- 7.1.8. Polyphenylene Sulfide (PPS)
- 7.1.9. Styrene Copolymers (ABS & SAN)
- 7.1.10. Liquid Crystal Polymers (LCP)
- 7.1.11. Polyether Ether Ketone (PEEK)
- 7.1.12. Polyimides (PI)
- 7.1.13. Polyamides
- 7.2. Market Analysis, Insights and Forecast - by Application
- 7.2.1. Automotive and Transportation
- 7.2.2. Building and Construction
- 7.2.3. Consumer Goods
- 7.2.4. Electrical and Electronics
- 7.2.5. Industrial and Machinery
- 7.2.6. Packaging
- 7.2.7. Medical
- 7.3. Market Analysis, Insights and Forecast - by Geography
- 7.3.1. Saudi Arabia
- 7.3.2. South Africa
- 7.3.3. Qatar
- 7.3.4. United Arab Emirates
- 7.3.5. Rest of Middle-East and Africa
- 7.1. Market Analysis, Insights and Forecast - by Product Type
- 8. South Africa MEA Engineering Plastics Industry Analysis, Insights and Forecast, 2020-2032
- 8.1. Market Analysis, Insights and Forecast - by Product Type
- 8.1.1. Fluoropolymers
- 8.1.2. Polycarbonate (PC)
- 8.1.3. Polyethylene Terephthalate (PET)
- 8.1.4. Polybutylene Terephthalate (PBT)
- 8.1.5. Polyacetal/ Polyoxymethylene
- 8.1.6. Polymethyl Methacrylate (PMMA)
- 8.1.7. Polyphenylene Oxide
- 8.1.8. Polyphenylene Sulfide (PPS)
- 8.1.9. Styrene Copolymers (ABS & SAN)
- 8.1.10. Liquid Crystal Polymers (LCP)
- 8.1.11. Polyether Ether Ketone (PEEK)
- 8.1.12. Polyimides (PI)
- 8.1.13. Polyamides
- 8.2. Market Analysis, Insights and Forecast - by Application
- 8.2.1. Automotive and Transportation
- 8.2.2. Building and Construction
- 8.2.3. Consumer Goods
- 8.2.4. Electrical and Electronics
- 8.2.5. Industrial and Machinery
- 8.2.6. Packaging
- 8.2.7. Medical
- 8.3. Market Analysis, Insights and Forecast - by Geography
- 8.3.1. Saudi Arabia
- 8.3.2. South Africa
- 8.3.3. Qatar
- 8.3.4. United Arab Emirates
- 8.3.5. Rest of Middle-East and Africa
- 8.1. Market Analysis, Insights and Forecast - by Product Type
- 9. Qatar MEA Engineering Plastics Industry Analysis, Insights and Forecast, 2020-2032
- 9.1. Market Analysis, Insights and Forecast - by Product Type
- 9.1.1. Fluoropolymers
- 9.1.2. Polycarbonate (PC)
- 9.1.3. Polyethylene Terephthalate (PET)
- 9.1.4. Polybutylene Terephthalate (PBT)
- 9.1.5. Polyacetal/ Polyoxymethylene
- 9.1.6. Polymethyl Methacrylate (PMMA)
- 9.1.7. Polyphenylene Oxide
- 9.1.8. Polyphenylene Sulfide (PPS)
- 9.1.9. Styrene Copolymers (ABS & SAN)
- 9.1.10. Liquid Crystal Polymers (LCP)
- 9.1.11. Polyether Ether Ketone (PEEK)
- 9.1.12. Polyimides (PI)
- 9.1.13. Polyamides
- 9.2. Market Analysis, Insights and Forecast - by Application
- 9.2.1. Automotive and Transportation
- 9.2.2. Building and Construction
- 9.2.3. Consumer Goods
- 9.2.4. Electrical and Electronics
- 9.2.5. Industrial and Machinery
- 9.2.6. Packaging
- 9.2.7. Medical
- 9.3. Market Analysis, Insights and Forecast - by Geography
- 9.3.1. Saudi Arabia
- 9.3.2. South Africa
- 9.3.3. Qatar
- 9.3.4. United Arab Emirates
- 9.3.5. Rest of Middle-East and Africa
- 9.1. Market Analysis, Insights and Forecast - by Product Type
- 10. United Arab Emirates MEA Engineering Plastics Industry Analysis, Insights and Forecast, 2020-2032
- 10.1. Market Analysis, Insights and Forecast - by Product Type
- 10.1.1. Fluoropolymers
- 10.1.2. Polycarbonate (PC)
- 10.1.3. Polyethylene Terephthalate (PET)
- 10.1.4. Polybutylene Terephthalate (PBT)
- 10.1.5. Polyacetal/ Polyoxymethylene
- 10.1.6. Polymethyl Methacrylate (PMMA)
- 10.1.7. Polyphenylene Oxide
- 10.1.8. Polyphenylene Sulfide (PPS)
- 10.1.9. Styrene Copolymers (ABS & SAN)
- 10.1.10. Liquid Crystal Polymers (LCP)
- 10.1.11. Polyether Ether Ketone (PEEK)
- 10.1.12. Polyimides (PI)
- 10.1.13. Polyamides
- 10.2. Market Analysis, Insights and Forecast - by Application
- 10.2.1. Automotive and Transportation
- 10.2.2. Building and Construction
- 10.2.3. Consumer Goods
- 10.2.4. Electrical and Electronics
- 10.2.5. Industrial and Machinery
- 10.2.6. Packaging
- 10.2.7. Medical
- 10.3. Market Analysis, Insights and Forecast - by Geography
- 10.3.1. Saudi Arabia
- 10.3.2. South Africa
- 10.3.3. Qatar
- 10.3.4. United Arab Emirates
- 10.3.5. Rest of Middle-East and Africa
- 10.1. Market Analysis, Insights and Forecast - by Product Type
- 11. Rest of Middle East and Africa MEA Engineering Plastics Industry Analysis, Insights and Forecast, 2020-2032
- 11.1. Market Analysis, Insights and Forecast - by Product Type
- 11.1.1. Fluoropolymers
- 11.1.2. Polycarbonate (PC)
- 11.1.3. Polyethylene Terephthalate (PET)
- 11.1.4. Polybutylene Terephthalate (PBT)
- 11.1.5. Polyacetal/ Polyoxymethylene
- 11.1.6. Polymethyl Methacrylate (PMMA)
- 11.1.7. Polyphenylene Oxide
- 11.1.8. Polyphenylene Sulfide (PPS)
- 11.1.9. Styrene Copolymers (ABS & SAN)
- 11.1.10. Liquid Crystal Polymers (LCP)
- 11.1.11. Polyether Ether Ketone (PEEK)
- 11.1.12. Polyimides (PI)
- 11.1.13. Polyamides
- 11.2. Market Analysis, Insights and Forecast - by Application
- 11.2.1. Automotive and Transportation
- 11.2.2. Building and Construction
- 11.2.3. Consumer Goods
- 11.2.4. Electrical and Electronics
- 11.2.5. Industrial and Machinery
- 11.2.6. Packaging
- 11.2.7. Medical
- 11.3. Market Analysis, Insights and Forecast - by Geography
- 11.3.1. Saudi Arabia
- 11.3.2. South Africa
- 11.3.3. Qatar
- 11.3.4. United Arab Emirates
- 11.3.5. Rest of Middle-East and Africa
- 11.1. Market Analysis, Insights and Forecast - by Product Type
- 12. Competitive Analysis
- 12.1. Company Profiles
- 12.1.1 SABIC
- 12.1.1.1. Company Overview
- 12.1.1.2. Products
- 12.1.1.3. Company Financials
- 12.1.1.4. SWOT Analysis
- 12.1.2 Covestro AG
- 12.1.2.1. Company Overview
- 12.1.2.2. Products
- 12.1.2.3. Company Financials
- 12.1.2.4. SWOT Analysis
- 12.1.3 Celanese Corporation
- 12.1.3.1. Company Overview
- 12.1.3.2. Products
- 12.1.3.3. Company Financials
- 12.1.3.4. SWOT Analysis
- 12.1.4 Lyondellbasell
- 12.1.4.1. Company Overview
- 12.1.4.2. Products
- 12.1.4.3. Company Financials
- 12.1.4.4. SWOT Analysis
- 12.1.5 LG Chem
- 12.1.5.1. Company Overview
- 12.1.5.2. Products
- 12.1.5.3. Company Financials
- 12.1.5.4. SWOT Analysis
- 12.1.6 DuPont
- 12.1.6.1. Company Overview
- 12.1.6.2. Products
- 12.1.6.3. Company Financials
- 12.1.6.4. SWOT Analysis
- 12.1.7 Solvay*List Not Exhaustive
- 12.1.7.1. Company Overview
- 12.1.7.2. Products
- 12.1.7.3. Company Financials
- 12.1.7.4. SWOT Analysis
- 12.1.8 Evonik Industries AG
- 12.1.8.1. Company Overview
- 12.1.8.2. Products
- 12.1.8.3. Company Financials
- 12.1.8.4. SWOT Analysis
- 12.1.9 Eastman Chemical Company
- 12.1.9.1. Company Overview
- 12.1.9.2. Products
- 12.1.9.3. Company Financials
- 12.1.9.4. SWOT Analysis
- 12.1.10 3M
- 12.1.10.1. Company Overview
- 12.1.10.2. Products
- 12.1.10.3. Company Financials
- 12.1.10.4. SWOT Analysis
- 12.1.11 Chemtura Corporation
- 12.1.11.1. Company Overview
- 12.1.11.2. Products
- 12.1.11.3. Company Financials
- 12.1.11.4. SWOT Analysis
- 12.1.12 Chevron Phillips Chemical
- 12.1.12.1. Company Overview
- 12.1.12.2. Products
- 12.1.12.3. Company Financials
- 12.1.12.4. SWOT Analysis
- 12.1.13 Arkema SA
- 12.1.13.1. Company Overview
- 12.1.13.2. Products
- 12.1.13.3. Company Financials
- 12.1.13.4. SWOT Analysis
- 12.1.14 LANXESS
- 12.1.14.1. Company Overview
- 12.1.14.2. Products
- 12.1.14.3. Company Financials
- 12.1.14.4. SWOT Analysis
- 12.1.15 Nova Chemicals Corporation
- 12.1.15.1. Company Overview
- 12.1.15.2. Products
- 12.1.15.3. Company Financials
- 12.1.15.4. SWOT Analysis
- 12.1.16 Ashland Inc
- 12.1.16.1. Company Overview
- 12.1.16.2. Products
- 12.1.16.3. Company Financials
- 12.1.16.4. SWOT Analysis
- 12.1.17 PolyOne Corporation
- 12.1.17.1. Company Overview
- 12.1.17.2. Products
- 12.1.17.3. Company Financials
- 12.1.17.4. SWOT Analysis
- 12.1.18 BASF SE
- 12.1.18.1. Company Overview
- 12.1.18.2. Products
- 12.1.18.3. Company Financials
- 12.1.18.4. SWOT Analysis
- 12.1.1 SABIC
- 12.2. Market Entropy
- 12.2.1 Company's Key Areas Served
- 12.2.2 Recent Developments
- 12.3. Company Market Share Analysis 2025
- 12.3.1 Top 5 Companies Market Share Analysis
- 12.3.2 Top 3 Companies Market Share Analysis
- 12.4. List of Potential Customers
- 13. Research Methodology
List of Figures
- Figure 1: Global MEA Engineering Plastics Industry Revenue Breakdown (billion, %) by Region 2025 & 2033
- Figure 2: Saudi Arabia MEA Engineering Plastics Industry Revenue (billion), by Product Type 2025 & 2033
- Figure 3: Saudi Arabia MEA Engineering Plastics Industry Revenue Share (%), by Product Type 2025 & 2033
- Figure 4: Saudi Arabia MEA Engineering Plastics Industry Revenue (billion), by Application 2025 & 2033
- Figure 5: Saudi Arabia MEA Engineering Plastics Industry Revenue Share (%), by Application 2025 & 2033
- Figure 6: Saudi Arabia MEA Engineering Plastics Industry Revenue (billion), by Geography 2025 & 2033
- Figure 7: Saudi Arabia MEA Engineering Plastics Industry Revenue Share (%), by Geography 2025 & 2033
- Figure 8: Saudi Arabia MEA Engineering Plastics Industry Revenue (billion), by Country 2025 & 2033
- Figure 9: Saudi Arabia MEA Engineering Plastics Industry Revenue Share (%), by Country 2025 & 2033
- Figure 10: South Africa MEA Engineering Plastics Industry Revenue (billion), by Product Type 2025 & 2033
- Figure 11: South Africa MEA Engineering Plastics Industry Revenue Share (%), by Product Type 2025 & 2033
- Figure 12: South Africa MEA Engineering Plastics Industry Revenue (billion), by Application 2025 & 2033
- Figure 13: South Africa MEA Engineering Plastics Industry Revenue Share (%), by Application 2025 & 2033
- Figure 14: South Africa MEA Engineering Plastics Industry Revenue (billion), by Geography 2025 & 2033
- Figure 15: South Africa MEA Engineering Plastics Industry Revenue Share (%), by Geography 2025 & 2033
- Figure 16: South Africa MEA Engineering Plastics Industry Revenue (billion), by Country 2025 & 2033
- Figure 17: South Africa MEA Engineering Plastics Industry Revenue Share (%), by Country 2025 & 2033
- Figure 18: Qatar MEA Engineering Plastics Industry Revenue (billion), by Product Type 2025 & 2033
- Figure 19: Qatar MEA Engineering Plastics Industry Revenue Share (%), by Product Type 2025 & 2033
- Figure 20: Qatar MEA Engineering Plastics Industry Revenue (billion), by Application 2025 & 2033
- Figure 21: Qatar MEA Engineering Plastics Industry Revenue Share (%), by Application 2025 & 2033
- Figure 22: Qatar MEA Engineering Plastics Industry Revenue (billion), by Geography 2025 & 2033
- Figure 23: Qatar MEA Engineering Plastics Industry Revenue Share (%), by Geography 2025 & 2033
- Figure 24: Qatar MEA Engineering Plastics Industry Revenue (billion), by Country 2025 & 2033
- Figure 25: Qatar MEA Engineering Plastics Industry Revenue Share (%), by Country 2025 & 2033
- Figure 26: United Arab Emirates MEA Engineering Plastics Industry Revenue (billion), by Product Type 2025 & 2033
- Figure 27: United Arab Emirates MEA Engineering Plastics Industry Revenue Share (%), by Product Type 2025 & 2033
- Figure 28: United Arab Emirates MEA Engineering Plastics Industry Revenue (billion), by Application 2025 & 2033
- Figure 29: United Arab Emirates MEA Engineering Plastics Industry Revenue Share (%), by Application 2025 & 2033
- Figure 30: United Arab Emirates MEA Engineering Plastics Industry Revenue (billion), by Geography 2025 & 2033
- Figure 31: United Arab Emirates MEA Engineering Plastics Industry Revenue Share (%), by Geography 2025 & 2033
- Figure 32: United Arab Emirates MEA Engineering Plastics Industry Revenue (billion), by Country 2025 & 2033
- Figure 33: United Arab Emirates MEA Engineering Plastics Industry Revenue Share (%), by Country 2025 & 2033
- Figure 34: Rest of Middle East and Africa MEA Engineering Plastics Industry Revenue (billion), by Product Type 2025 & 2033
- Figure 35: Rest of Middle East and Africa MEA Engineering Plastics Industry Revenue Share (%), by Product Type 2025 & 2033
- Figure 36: Rest of Middle East and Africa MEA Engineering Plastics Industry Revenue (billion), by Application 2025 & 2033
- Figure 37: Rest of Middle East and Africa MEA Engineering Plastics Industry Revenue Share (%), by Application 2025 & 2033
- Figure 38: Rest of Middle East and Africa MEA Engineering Plastics Industry Revenue (billion), by Geography 2025 & 2033
- Figure 39: Rest of Middle East and Africa MEA Engineering Plastics Industry Revenue Share (%), by Geography 2025 & 2033
- Figure 40: Rest of Middle East and Africa MEA Engineering Plastics Industry Revenue (billion), by Country 2025 & 2033
- Figure 41: Rest of Middle East and Africa MEA Engineering Plastics Industry Revenue Share (%), by Country 2025 & 2033
List of Tables
- Table 1: Global MEA Engineering Plastics Industry Revenue billion Forecast, by Product Type 2020 & 2033
- Table 2: Global MEA Engineering Plastics Industry Revenue billion Forecast, by Application 2020 & 2033
- Table 3: Global MEA Engineering Plastics Industry Revenue billion Forecast, by Geography 2020 & 2033
- Table 4: Global MEA Engineering Plastics Industry Revenue billion Forecast, by Region 2020 & 2033
- Table 5: Global MEA Engineering Plastics Industry Revenue billion Forecast, by Product Type 2020 & 2033
- Table 6: Global MEA Engineering Plastics Industry Revenue billion Forecast, by Application 2020 & 2033
- Table 7: Global MEA Engineering Plastics Industry Revenue billion Forecast, by Geography 2020 & 2033
- Table 8: Global MEA Engineering Plastics Industry Revenue billion Forecast, by Country 2020 & 2033
- Table 9: Global MEA Engineering Plastics Industry Revenue billion Forecast, by Product Type 2020 & 2033
- Table 10: Global MEA Engineering Plastics Industry Revenue billion Forecast, by Application 2020 & 2033
- Table 11: Global MEA Engineering Plastics Industry Revenue billion Forecast, by Geography 2020 & 2033
- Table 12: Global MEA Engineering Plastics Industry Revenue billion Forecast, by Country 2020 & 2033
- Table 13: Global MEA Engineering Plastics Industry Revenue billion Forecast, by Product Type 2020 & 2033
- Table 14: Global MEA Engineering Plastics Industry Revenue billion Forecast, by Application 2020 & 2033
- Table 15: Global MEA Engineering Plastics Industry Revenue billion Forecast, by Geography 2020 & 2033
- Table 16: Global MEA Engineering Plastics Industry Revenue billion Forecast, by Country 2020 & 2033
- Table 17: Global MEA Engineering Plastics Industry Revenue billion Forecast, by Product Type 2020 & 2033
- Table 18: Global MEA Engineering Plastics Industry Revenue billion Forecast, by Application 2020 & 2033
- Table 19: Global MEA Engineering Plastics Industry Revenue billion Forecast, by Geography 2020 & 2033
- Table 20: Global MEA Engineering Plastics Industry Revenue billion Forecast, by Country 2020 & 2033
- Table 21: Global MEA Engineering Plastics Industry Revenue billion Forecast, by Product Type 2020 & 2033
- Table 22: Global MEA Engineering Plastics Industry Revenue billion Forecast, by Application 2020 & 2033
- Table 23: Global MEA Engineering Plastics Industry Revenue billion Forecast, by Geography 2020 & 2033
- Table 24: Global MEA Engineering Plastics Industry Revenue billion Forecast, by Country 2020 & 2033
Frequently Asked Questions
1. What is the projected Compound Annual Growth Rate (CAGR) of the MEA Engineering Plastics Industry?
The projected CAGR is approximately 4.1%.
2. Which companies are prominent players in the MEA Engineering Plastics Industry?
Key companies in the market include SABIC, Covestro AG, Celanese Corporation, Lyondellbasell, LG Chem, DuPont, Solvay*List Not Exhaustive, Evonik Industries AG, Eastman Chemical Company, 3M, Chemtura Corporation, Chevron Phillips Chemical, Arkema SA, LANXESS, Nova Chemicals Corporation, Ashland Inc, PolyOne Corporation, BASF SE.
3. What are the main segments of the MEA Engineering Plastics Industry?
The market segments include Product Type, Application, Geography.
4. Can you provide details about the market size?
The market size is estimated to be USD 107.17 billion as of 2022.
5. What are some drivers contributing to market growth?
; Growing Purchasing Power in the Countries; Engineering Plastics Replacing Traditional Materials.
6. What are the notable trends driving market growth?
Polyethylene Terephthalate (PET): The Most Used Engineering Plastic.
7. Are there any restraints impacting market growth?
; Volatility in Raw Material Prices; Other Restraints.
8. Can you provide examples of recent developments in the market?
N/A
9. What pricing options are available for accessing the report?
Pricing options include single-user, multi-user, and enterprise licenses priced at USD 4750, USD 5250, and USD 8750 respectively.
10. Is the market size provided in terms of value or volume?
The market size is provided in terms of value, measured in billion.
11. Are there any specific market keywords associated with the report?
Yes, the market keyword associated with the report is "MEA Engineering Plastics Industry," which aids in identifying and referencing the specific market segment covered.
12. How do I determine which pricing option suits my needs best?
The pricing options vary based on user requirements and access needs. Individual users may opt for single-user licenses, while businesses requiring broader access may choose multi-user or enterprise licenses for cost-effective access to the report.
13. Are there any additional resources or data provided in the MEA Engineering Plastics Industry report?
While the report offers comprehensive insights, it's advisable to review the specific contents or supplementary materials provided to ascertain if additional resources or data are available.
14. How can I stay updated on further developments or reports in the MEA Engineering Plastics Industry?
To stay informed about further developments, trends, and reports in the MEA Engineering Plastics Industry, consider subscribing to industry newsletters, following relevant companies and organizations, or regularly checking reputable industry news sources and publications.
Methodology
Step 1 - Identification of Relevant Samples Size from Population Database


Step 2 - Approaches for Defining Global Market Size (Value, Volume* & Price*)

Note*: In applicable scenarios
Step 3 - Data Sources
Primary Research
- Web Analytics
- Survey Reports
- Research Institute
- Latest Research Reports
- Opinion Leaders
Secondary Research
- Annual Reports
- White Paper
- Latest Press Release
- Industry Association
- Paid Database
- Investor Presentations

Step 4 - Data Triangulation
Involves using different sources of information in order to increase the validity of a study
These sources are likely to be stakeholders in a program - participants, other researchers, program staff, other community members, and so on.
Then we put all data in single framework & apply various statistical tools to find out the dynamic on the market.
During the analysis stage, feedback from the stakeholder groups would be compared to determine areas of agreement as well as areas of divergence

