

Key Insights
The Middle East and Africa (MEA) paper and paperboard industry is poised for robust expansion, projected at a Compound Annual Growth Rate (CAGR) of 4.28% between 2025 and 2033. This growth trajectory is primarily fueled by escalating demand from the rapidly expanding food and beverage sector, encompassing both processed foods and beverages. The region's demographic surge and rising disposable incomes are directly translating into increased consumption and, consequently, higher packaging requirements. The burgeoning e-commerce landscape further bolsters demand for corrugated boxes and other paper-based packaging solutions. The industry's evolution is also propelled by a growing emphasis on sustainable packaging, driven by heightened consumer environmental awareness and more stringent governmental regulations. Key challenges include volatility in raw material prices, particularly pulp, and potential supply chain disruptions. Market segmentation indicates that processed foods currently dominate market share, closely followed by beverages and fresh food and produce. Geographically, the United Arab Emirates and Saudi Arabia lead market expansion, benefiting from strong economic activity and advanced infrastructure. Turkey also presents significant growth opportunities, contributing to the overall MEA paper and paperboard industry's development. Sustained economic progress, increased consumer spending, and the widespread adoption of eco-friendly packaging are critical for continued industry growth.
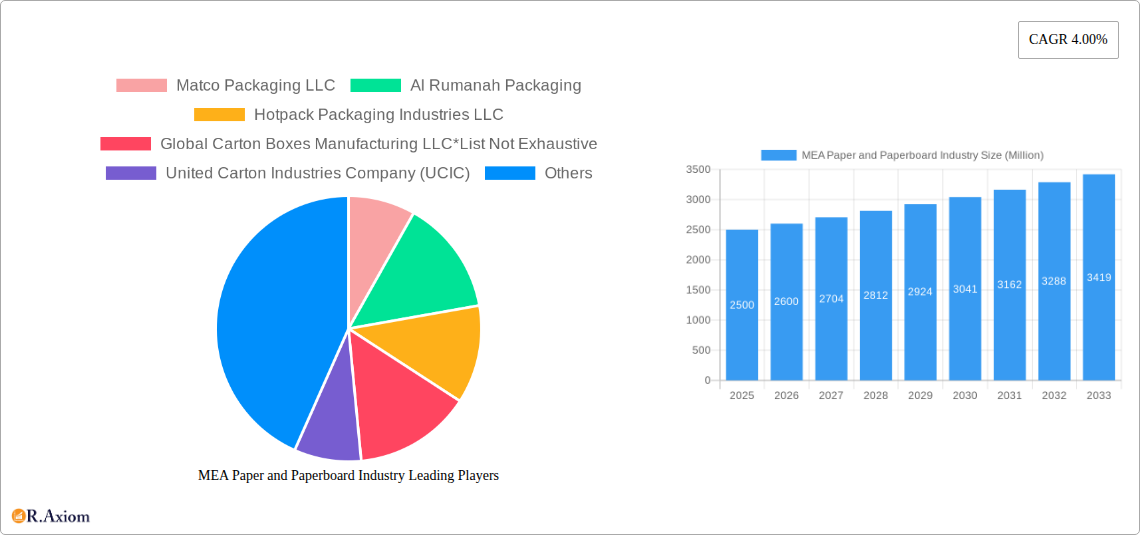
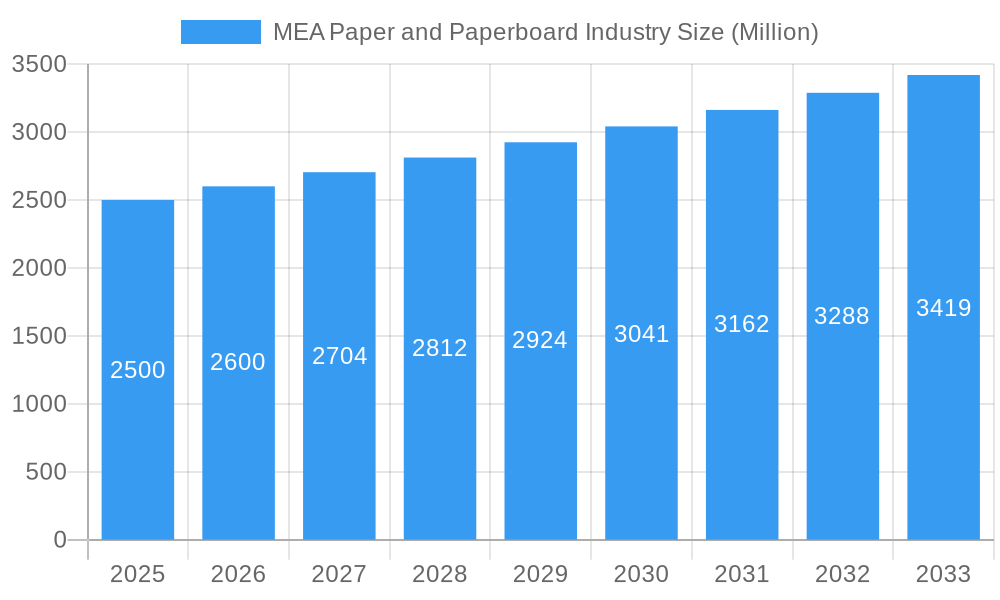
MEA Paper and Paperboard Industry Market Size (In Billion)
The MEA paper and paperboard market is estimated to reach approximately 337.64 billion in the base year 2025. This market size is projected to grow steadily throughout the forecast period. Leading industry participants, including Matco Packaging LLC, Al Rumanah Packaging, and Hotpack Packaging Industries LLC, are strategically positioned to leverage this growth. However, the competitive landscape is intensifying with the presence of both established global entities and agile local enterprises. Future success will be contingent upon strategic innovation, operational efficiency, and a steadfast commitment to sustainability, encompassing the utilization of recycled materials and minimizing environmental impact.
MEA Paper and Paperboard Industry Company Market Share
MEA Paper and Paperboard Industry: A Comprehensive Market Report (2019-2033)
This comprehensive report provides an in-depth analysis of the Middle East and Africa (MEA) paper and paperboard industry, offering valuable insights for stakeholders seeking to understand market dynamics, growth opportunities, and competitive landscapes. The study period covers 2019-2033, with 2025 as the base and estimated year. The forecast period extends from 2025 to 2033, encompassing historical data from 2019-2024. The report utilizes extensive data analysis to provide accurate market sizing and growth projections in millions.
MEA Paper and Paperboard Industry Market Concentration & Innovation
This section analyzes the MEA paper and paperboard market's concentration, innovation drivers, regulatory landscape, substitute products, end-user trends, and mergers and acquisitions (M&A) activities. The market exhibits a moderately concentrated structure, with several large players and numerous smaller regional players competing. Key players include Matco Packaging LLC, Al Rumanah Packaging, Hotpack Packaging Industries LLC, Global Carton Boxes Manufacturing LLC, United Carton Industries Company (UCIC), IFFCO, Tarboosh Packaging Co LLC, Green Packaging Boxes Ind LLC, Arabian Packaging Co LLC, and International Paper. However, the market share of each player is currently unavailable (xx).
Innovation is driven by the demand for sustainable packaging solutions, advancements in printing technologies, and the rise of e-commerce. Regulatory frameworks, including environmental regulations and import/export policies, significantly impact the industry. The primary substitute for paper and paperboard is plastic, though its environmental impact is driving a shift toward sustainable alternatives. End-user trends, such as the increasing demand for convenience and personalized packaging, are influencing product development. M&A activity has been moderate, with deal values totaling approximately xx Million in the period 2019-2024.
MEA Paper and Paperboard Industry Industry Trends & Insights
The MEA paper and paperboard market is experiencing robust growth, driven by factors such as rising population, urbanization, and increasing disposable incomes. The CAGR for the period 2025-2033 is projected at xx%. Technological advancements, particularly in automated packaging and printing technologies, are transforming production efficiency. Consumer preferences are shifting towards sustainable and eco-friendly packaging, presenting both challenges and opportunities. Competitive dynamics are shaped by price competition, product differentiation, and brand loyalty. Market penetration of sustainable packaging solutions is currently at xx% and expected to increase to xx% by 2033.
Dominant Markets & Segments in MEA Paper and Paperboard Industry
The UAE currently dominates the MEA paper and paperboard market, driven by robust economic growth, advanced infrastructure, and a large consumer base. Saudi Arabia is another major market, while Turkey and the rest of MEA are showing significant potential.
By End-user Industry:
- Processed Foods: This segment is the largest, driven by the growing demand for packaged food products.
- Fresh Food and Produce: This segment is experiencing strong growth due to the rise of organized retail and supermarket chains.
- Beverages: The beverage industry is a significant consumer of paperboard packaging.
- Paper Products: This includes stationery, tissue paper, and other paper-based products.
- Electrical Products: This segment utilizes paperboard for insulation and packaging.
- Other End-user Industries: This includes pharmaceutical, cosmetic, and other sectors.
By Country:
- United Arab Emirates: Strong economic growth and advanced infrastructure drive market dominance.
- Saudi Arabia: Large population and significant investment in infrastructure support high demand.
- Turkey: A large and diversified economy fuels substantial growth in the paper and paperboard sector.
- Rest of Middle East and Africa: This region is characterized by diverse growth rates and market conditions.
MEA Paper and Paperboard Industry Product Developments
Recent product innovations focus on sustainable materials, such as recycled paperboard and biodegradable alternatives. Advances in printing technologies enable enhanced packaging designs and improved branding opportunities. The market is witnessing a growing adoption of lightweight and flexible packaging solutions to reduce transportation costs and environmental impact. These developments cater to the increasing demand for eco-friendly and cost-effective packaging options.
Report Scope & Segmentation Analysis
This report segments the MEA paper and paperboard market by end-user industry (Processed Foods, Fresh Food and Produce, Beverages, Paper Products, Electrical Products, Other End-user Industries) and by country (United Arab Emirates, Saudi Arabia, Turkey, Rest of Middle East and Africa). Each segment's growth projections, market size (in Millions), and competitive dynamics are analyzed separately. The report provides a detailed breakdown of market sizes for each segment and forecasts its future growth based on current trends and projections. Competitive analysis for each segment includes a review of major players, their market share, and their strategic initiatives.
Key Drivers of MEA Paper and Paperboard Industry Growth
Growth in the MEA paper and paperboard industry is propelled by several factors. The rising population and urbanization are creating significant demand for packaged goods. Economic growth in several MEA countries is driving consumer spending, boosting demand for packaged products. Government initiatives promoting sustainable packaging solutions are also influencing market growth. Finally, advancements in packaging technologies are enhancing efficiency and creating new product possibilities.
Challenges in the MEA Paper and Paperboard Industry Sector
The MEA paper and paperboard industry faces challenges such as fluctuations in raw material prices, rising energy costs impacting production expenses, and environmental regulations requiring sustainable practices. Competition from alternative packaging materials, like plastic, poses a threat, as does the need to manage supply chain complexities and logistics across diverse geographical regions. These factors can influence production costs and profitability. For example, a xx% increase in raw material costs in 2024 led to a xx% decrease in profit margins for some companies.
Emerging Opportunities in MEA Paper and Paperboard Industry
The MEA paper and paperboard industry presents numerous opportunities. The rising demand for sustainable packaging solutions opens avenues for innovative, eco-friendly products. The growth of e-commerce is increasing demand for efficient packaging solutions. Expansion into new markets within the MEA region presents growth potential. Moreover, technological advancements, such as smart packaging, offer new opportunities for value-added products.
Leading Players in the MEA Paper and Paperboard Industry Market
- Matco Packaging LLC
- Al Rumanah Packaging
- Hotpack Packaging Industries LLC
- Global Carton Boxes Manufacturing LLC
- United Carton Industries Company (UCIC)
- IFFCO
- Tarboosh Packaging Co LLC
- Green Packaging Boxes Ind LLC
- Arabian Packaging Co LLC
- International Paper
Key Developments in MEA Paper and Paperboard Industry Industry
- Jan 2023: Hotpack Packaging Industries LLC launched a new line of sustainable packaging solutions.
- Oct 2022: Matco Packaging LLC acquired a smaller regional packaging company, expanding its market reach.
- Further key developments (specific dates and details) are unavailable (xx).
Strategic Outlook for MEA Paper and Paperboard Industry Market
The MEA paper and paperboard market is poised for significant growth over the forecast period. Continued urbanization and economic expansion will drive demand for packaged goods. The focus on sustainable packaging will create opportunities for companies that can offer environmentally friendly solutions. The adoption of new technologies will enhance efficiency and product innovation. Overall, the market outlook is positive, with strong growth potential for innovative and adaptable companies.
MEA Paper and Paperboard Industry Segmentation
-
1. Type
- 1.1. Printing and Writing
- 1.2. Newsprint
- 1.3. Tissue
- 1.4. Cartonboard
- 1.5. Containerboard
- 1.6. Other Types
-
2. End-user Industry
- 2.1. Processed Foods
- 2.2. Fresh Food and Produces
- 2.3. Beverages
- 2.4. Paper Products
- 2.5. Electrical Products
- 2.6. Other End-user Industries
MEA Paper and Paperboard Industry Segmentation By Geography
-
1. North America
- 1.1. United States
- 1.2. Canada
- 1.3. Mexico
-
2. South America
- 2.1. Brazil
- 2.2. Argentina
- 2.3. Rest of South America
-
3. Europe
- 3.1. United Kingdom
- 3.2. Germany
- 3.3. France
- 3.4. Italy
- 3.5. Spain
- 3.6. Russia
- 3.7. Benelux
- 3.8. Nordics
- 3.9. Rest of Europe
-
4. Middle East & Africa
- 4.1. Turkey
- 4.2. Israel
- 4.3. GCC
- 4.4. North Africa
- 4.5. South Africa
- 4.6. Rest of Middle East & Africa
-
5. Asia Pacific
- 5.1. China
- 5.2. India
- 5.3. Japan
- 5.4. South Korea
- 5.5. ASEAN
- 5.6. Oceania
- 5.7. Rest of Asia Pacific
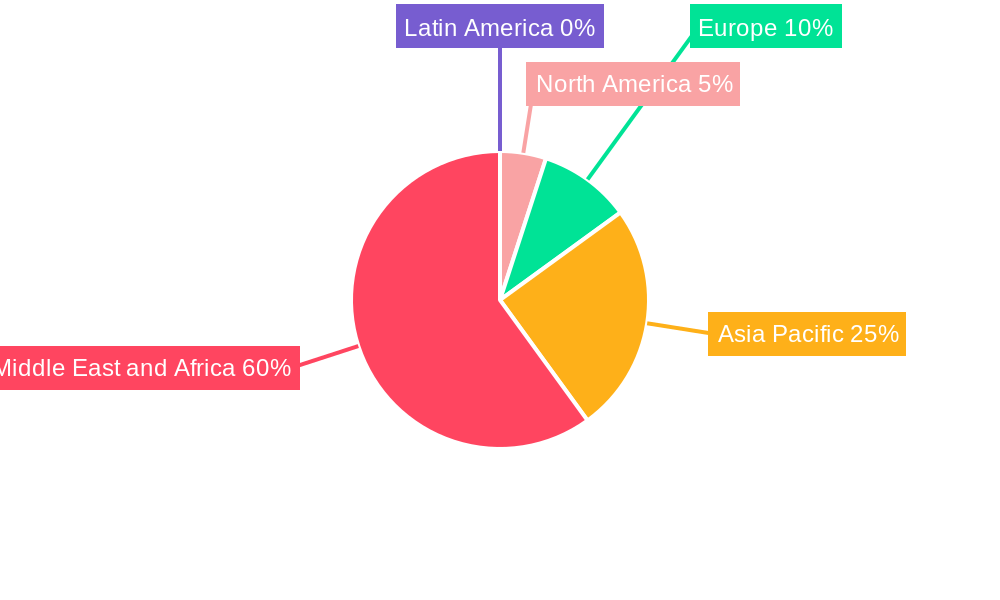
MEA Paper and Paperboard Industry Regional Market Share
Geographic Coverage of MEA Paper and Paperboard Industry
MEA Paper and Paperboard Industry REPORT HIGHLIGHTS
| Aspects | Details |
|---|---|
| Study Period | 2020-2034 |
| Base Year | 2025 |
| Estimated Year | 2026 |
| Forecast Period | 2026-2034 |
| Historical Period | 2020-2025 |
| Growth Rate | CAGR of 4.28% from 2020-2034 |
| Segmentation |
|
Table of Contents
- 1. Introduction
- 1.1. Research Scope
- 1.2. Market Segmentation
- 1.3. Research Objective
- 1.4. Definitions and Assumptions
- 2. Executive Summary
- 2.1. Market Snapshot
- 3. Market Dynamics
- 3.1. Market Drivers
- 3.2. Market Restrains
- 3.3. Market Trends
- 3.4. Market Opportunities
- 4. Market Factor Analysis
- 4.1. Porters Five Forces
- 4.1.1. Bargaining Power of Suppliers
- 4.1.2. Bargaining Power of Buyers
- 4.1.3. Threat of New Entrants
- 4.1.4. Threat of Substitutes
- 4.1.5. Competitive Rivalry
- 4.2. PESTEL analysis
- 4.3. BCG Analysis
- 4.3.1. Stars (High Growth, High Market Share)
- 4.3.2. Cash Cows (Low Growth, High Market Share)
- 4.3.3. Question Mark (High Growth, Low Market Share)
- 4.3.4. Dogs (Low Growth, Low Market Share)
- 4.4. Ansoff Matrix Analysis
- 4.5. Supply Chain Analysis
- 4.6. Regulatory Landscape
- 4.7. Current Market Potential and Opportunity Assessment (TAM–SAM–SOM Framework)
- 4.8. RAX Analyst Note
- 4.1. Porters Five Forces
- 5. Market Analysis, Insights and Forecast 2021-2033
- 5.1. Market Analysis, Insights and Forecast - by Type
- 5.1.1. Printing and Writing
- 5.1.2. Newsprint
- 5.1.3. Tissue
- 5.1.4. Cartonboard
- 5.1.5. Containerboard
- 5.1.6. Other Types
- 5.2. Market Analysis, Insights and Forecast - by End-user Industry
- 5.2.1. Processed Foods
- 5.2.2. Fresh Food and Produces
- 5.2.3. Beverages
- 5.2.4. Paper Products
- 5.2.5. Electrical Products
- 5.2.6. Other End-user Industries
- 5.3. Market Analysis, Insights and Forecast - by Region
- 5.3.1. North America
- 5.3.2. South America
- 5.3.3. Europe
- 5.3.4. Middle East & Africa
- 5.3.5. Asia Pacific
- 5.1. Market Analysis, Insights and Forecast - by Type
- 6. Global MEA Paper and Paperboard Industry Analysis, Insights and Forecast, 2021-2033
- 6.1. Market Analysis, Insights and Forecast - by Type
- 6.1.1. Printing and Writing
- 6.1.2. Newsprint
- 6.1.3. Tissue
- 6.1.4. Cartonboard
- 6.1.5. Containerboard
- 6.1.6. Other Types
- 6.2. Market Analysis, Insights and Forecast - by End-user Industry
- 6.2.1. Processed Foods
- 6.2.2. Fresh Food and Produces
- 6.2.3. Beverages
- 6.2.4. Paper Products
- 6.2.5. Electrical Products
- 6.2.6. Other End-user Industries
- 6.1. Market Analysis, Insights and Forecast - by Type
- 7. North America MEA Paper and Paperboard Industry Analysis, Insights and Forecast, 2020-2032
- 7.1. Market Analysis, Insights and Forecast - by Type
- 7.1.1. Printing and Writing
- 7.1.2. Newsprint
- 7.1.3. Tissue
- 7.1.4. Cartonboard
- 7.1.5. Containerboard
- 7.1.6. Other Types
- 7.2. Market Analysis, Insights and Forecast - by End-user Industry
- 7.2.1. Processed Foods
- 7.2.2. Fresh Food and Produces
- 7.2.3. Beverages
- 7.2.4. Paper Products
- 7.2.5. Electrical Products
- 7.2.6. Other End-user Industries
- 7.1. Market Analysis, Insights and Forecast - by Type
- 8. South America MEA Paper and Paperboard Industry Analysis, Insights and Forecast, 2020-2032
- 8.1. Market Analysis, Insights and Forecast - by Type
- 8.1.1. Printing and Writing
- 8.1.2. Newsprint
- 8.1.3. Tissue
- 8.1.4. Cartonboard
- 8.1.5. Containerboard
- 8.1.6. Other Types
- 8.2. Market Analysis, Insights and Forecast - by End-user Industry
- 8.2.1. Processed Foods
- 8.2.2. Fresh Food and Produces
- 8.2.3. Beverages
- 8.2.4. Paper Products
- 8.2.5. Electrical Products
- 8.2.6. Other End-user Industries
- 8.1. Market Analysis, Insights and Forecast - by Type
- 9. Europe MEA Paper and Paperboard Industry Analysis, Insights and Forecast, 2020-2032
- 9.1. Market Analysis, Insights and Forecast - by Type
- 9.1.1. Printing and Writing
- 9.1.2. Newsprint
- 9.1.3. Tissue
- 9.1.4. Cartonboard
- 9.1.5. Containerboard
- 9.1.6. Other Types
- 9.2. Market Analysis, Insights and Forecast - by End-user Industry
- 9.2.1. Processed Foods
- 9.2.2. Fresh Food and Produces
- 9.2.3. Beverages
- 9.2.4. Paper Products
- 9.2.5. Electrical Products
- 9.2.6. Other End-user Industries
- 9.1. Market Analysis, Insights and Forecast - by Type
- 10. Middle East & Africa MEA Paper and Paperboard Industry Analysis, Insights and Forecast, 2020-2032
- 10.1. Market Analysis, Insights and Forecast - by Type
- 10.1.1. Printing and Writing
- 10.1.2. Newsprint
- 10.1.3. Tissue
- 10.1.4. Cartonboard
- 10.1.5. Containerboard
- 10.1.6. Other Types
- 10.2. Market Analysis, Insights and Forecast - by End-user Industry
- 10.2.1. Processed Foods
- 10.2.2. Fresh Food and Produces
- 10.2.3. Beverages
- 10.2.4. Paper Products
- 10.2.5. Electrical Products
- 10.2.6. Other End-user Industries
- 10.1. Market Analysis, Insights and Forecast - by Type
- 11. Asia Pacific MEA Paper and Paperboard Industry Analysis, Insights and Forecast, 2020-2032
- 11.1. Market Analysis, Insights and Forecast - by Type
- 11.1.1. Printing and Writing
- 11.1.2. Newsprint
- 11.1.3. Tissue
- 11.1.4. Cartonboard
- 11.1.5. Containerboard
- 11.1.6. Other Types
- 11.2. Market Analysis, Insights and Forecast - by End-user Industry
- 11.2.1. Processed Foods
- 11.2.2. Fresh Food and Produces
- 11.2.3. Beverages
- 11.2.4. Paper Products
- 11.2.5. Electrical Products
- 11.2.6. Other End-user Industries
- 11.1. Market Analysis, Insights and Forecast - by Type
- 12. Competitive Analysis
- 12.1. Company Profiles
- 12.1.1 Matco Packaging LLC
- 12.1.1.1. Company Overview
- 12.1.1.2. Products
- 12.1.1.3. Company Financials
- 12.1.1.4. SWOT Analysis
- 12.1.2 Al Rumanah Packaging
- 12.1.2.1. Company Overview
- 12.1.2.2. Products
- 12.1.2.3. Company Financials
- 12.1.2.4. SWOT Analysis
- 12.1.3 Hotpack Packaging Industries LLC
- 12.1.3.1. Company Overview
- 12.1.3.2. Products
- 12.1.3.3. Company Financials
- 12.1.3.4. SWOT Analysis
- 12.1.4 Global Carton Boxes Manufacturing LLC*List Not Exhaustive
- 12.1.4.1. Company Overview
- 12.1.4.2. Products
- 12.1.4.3. Company Financials
- 12.1.4.4. SWOT Analysis
- 12.1.5 United Carton Industries Company (UCIC)
- 12.1.5.1. Company Overview
- 12.1.5.2. Products
- 12.1.5.3. Company Financials
- 12.1.5.4. SWOT Analysis
- 12.1.6 IFFCO
- 12.1.6.1. Company Overview
- 12.1.6.2. Products
- 12.1.6.3. Company Financials
- 12.1.6.4. SWOT Analysis
- 12.1.7 Tarboosh Packaging Co LLC
- 12.1.7.1. Company Overview
- 12.1.7.2. Products
- 12.1.7.3. Company Financials
- 12.1.7.4. SWOT Analysis
- 12.1.8 Green Packaging Boxes Ind LLC
- 12.1.8.1. Company Overview
- 12.1.8.2. Products
- 12.1.8.3. Company Financials
- 12.1.8.4. SWOT Analysis
- 12.1.9 Arabian Packaging Co LLC
- 12.1.9.1. Company Overview
- 12.1.9.2. Products
- 12.1.9.3. Company Financials
- 12.1.9.4. SWOT Analysis
- 12.1.10 International Paper
- 12.1.10.1. Company Overview
- 12.1.10.2. Products
- 12.1.10.3. Company Financials
- 12.1.10.4. SWOT Analysis
- 12.1.1 Matco Packaging LLC
- 12.2. Market Entropy
- 12.2.1 Company's Key Areas Served
- 12.2.2 Recent Developments
- 12.3. Company Market Share Analysis 2025
- 12.3.1 Top 5 Companies Market Share Analysis
- 12.3.2 Top 3 Companies Market Share Analysis
- 12.4. List of Potential Customers
- 13. Research Methodology
List of Figures
- Figure 1: Global MEA Paper and Paperboard Industry Revenue Breakdown (billion, %) by Region 2025 & 2033
- Figure 2: North America MEA Paper and Paperboard Industry Revenue (billion), by Type 2025 & 2033
- Figure 3: North America MEA Paper and Paperboard Industry Revenue Share (%), by Type 2025 & 2033
- Figure 4: North America MEA Paper and Paperboard Industry Revenue (billion), by End-user Industry 2025 & 2033
- Figure 5: North America MEA Paper and Paperboard Industry Revenue Share (%), by End-user Industry 2025 & 2033
- Figure 6: North America MEA Paper and Paperboard Industry Revenue (billion), by Country 2025 & 2033
- Figure 7: North America MEA Paper and Paperboard Industry Revenue Share (%), by Country 2025 & 2033
- Figure 8: South America MEA Paper and Paperboard Industry Revenue (billion), by Type 2025 & 2033
- Figure 9: South America MEA Paper and Paperboard Industry Revenue Share (%), by Type 2025 & 2033
- Figure 10: South America MEA Paper and Paperboard Industry Revenue (billion), by End-user Industry 2025 & 2033
- Figure 11: South America MEA Paper and Paperboard Industry Revenue Share (%), by End-user Industry 2025 & 2033
- Figure 12: South America MEA Paper and Paperboard Industry Revenue (billion), by Country 2025 & 2033
- Figure 13: South America MEA Paper and Paperboard Industry Revenue Share (%), by Country 2025 & 2033
- Figure 14: Europe MEA Paper and Paperboard Industry Revenue (billion), by Type 2025 & 2033
- Figure 15: Europe MEA Paper and Paperboard Industry Revenue Share (%), by Type 2025 & 2033
- Figure 16: Europe MEA Paper and Paperboard Industry Revenue (billion), by End-user Industry 2025 & 2033
- Figure 17: Europe MEA Paper and Paperboard Industry Revenue Share (%), by End-user Industry 2025 & 2033
- Figure 18: Europe MEA Paper and Paperboard Industry Revenue (billion), by Country 2025 & 2033
- Figure 19: Europe MEA Paper and Paperboard Industry Revenue Share (%), by Country 2025 & 2033
- Figure 20: Middle East & Africa MEA Paper and Paperboard Industry Revenue (billion), by Type 2025 & 2033
- Figure 21: Middle East & Africa MEA Paper and Paperboard Industry Revenue Share (%), by Type 2025 & 2033
- Figure 22: Middle East & Africa MEA Paper and Paperboard Industry Revenue (billion), by End-user Industry 2025 & 2033
- Figure 23: Middle East & Africa MEA Paper and Paperboard Industry Revenue Share (%), by End-user Industry 2025 & 2033
- Figure 24: Middle East & Africa MEA Paper and Paperboard Industry Revenue (billion), by Country 2025 & 2033
- Figure 25: Middle East & Africa MEA Paper and Paperboard Industry Revenue Share (%), by Country 2025 & 2033
- Figure 26: Asia Pacific MEA Paper and Paperboard Industry Revenue (billion), by Type 2025 & 2033
- Figure 27: Asia Pacific MEA Paper and Paperboard Industry Revenue Share (%), by Type 2025 & 2033
- Figure 28: Asia Pacific MEA Paper and Paperboard Industry Revenue (billion), by End-user Industry 2025 & 2033
- Figure 29: Asia Pacific MEA Paper and Paperboard Industry Revenue Share (%), by End-user Industry 2025 & 2033
- Figure 30: Asia Pacific MEA Paper and Paperboard Industry Revenue (billion), by Country 2025 & 2033
- Figure 31: Asia Pacific MEA Paper and Paperboard Industry Revenue Share (%), by Country 2025 & 2033
List of Tables
- Table 1: Global MEA Paper and Paperboard Industry Revenue billion Forecast, by Type 2020 & 2033
- Table 2: Global MEA Paper and Paperboard Industry Revenue billion Forecast, by End-user Industry 2020 & 2033
- Table 3: Global MEA Paper and Paperboard Industry Revenue billion Forecast, by Region 2020 & 2033
- Table 4: Global MEA Paper and Paperboard Industry Revenue billion Forecast, by Type 2020 & 2033
- Table 5: Global MEA Paper and Paperboard Industry Revenue billion Forecast, by End-user Industry 2020 & 2033
- Table 6: Global MEA Paper and Paperboard Industry Revenue billion Forecast, by Country 2020 & 2033
- Table 7: United States MEA Paper and Paperboard Industry Revenue (billion) Forecast, by Application 2020 & 2033
- Table 8: Canada MEA Paper and Paperboard Industry Revenue (billion) Forecast, by Application 2020 & 2033
- Table 9: Mexico MEA Paper and Paperboard Industry Revenue (billion) Forecast, by Application 2020 & 2033
- Table 10: Global MEA Paper and Paperboard Industry Revenue billion Forecast, by Type 2020 & 2033
- Table 11: Global MEA Paper and Paperboard Industry Revenue billion Forecast, by End-user Industry 2020 & 2033
- Table 12: Global MEA Paper and Paperboard Industry Revenue billion Forecast, by Country 2020 & 2033
- Table 13: Brazil MEA Paper and Paperboard Industry Revenue (billion) Forecast, by Application 2020 & 2033
- Table 14: Argentina MEA Paper and Paperboard Industry Revenue (billion) Forecast, by Application 2020 & 2033
- Table 15: Rest of South America MEA Paper and Paperboard Industry Revenue (billion) Forecast, by Application 2020 & 2033
- Table 16: Global MEA Paper and Paperboard Industry Revenue billion Forecast, by Type 2020 & 2033
- Table 17: Global MEA Paper and Paperboard Industry Revenue billion Forecast, by End-user Industry 2020 & 2033
- Table 18: Global MEA Paper and Paperboard Industry Revenue billion Forecast, by Country 2020 & 2033
- Table 19: United Kingdom MEA Paper and Paperboard Industry Revenue (billion) Forecast, by Application 2020 & 2033
- Table 20: Germany MEA Paper and Paperboard Industry Revenue (billion) Forecast, by Application 2020 & 2033
- Table 21: France MEA Paper and Paperboard Industry Revenue (billion) Forecast, by Application 2020 & 2033
- Table 22: Italy MEA Paper and Paperboard Industry Revenue (billion) Forecast, by Application 2020 & 2033
- Table 23: Spain MEA Paper and Paperboard Industry Revenue (billion) Forecast, by Application 2020 & 2033
- Table 24: Russia MEA Paper and Paperboard Industry Revenue (billion) Forecast, by Application 2020 & 2033
- Table 25: Benelux MEA Paper and Paperboard Industry Revenue (billion) Forecast, by Application 2020 & 2033
- Table 26: Nordics MEA Paper and Paperboard Industry Revenue (billion) Forecast, by Application 2020 & 2033
- Table 27: Rest of Europe MEA Paper and Paperboard Industry Revenue (billion) Forecast, by Application 2020 & 2033
- Table 28: Global MEA Paper and Paperboard Industry Revenue billion Forecast, by Type 2020 & 2033
- Table 29: Global MEA Paper and Paperboard Industry Revenue billion Forecast, by End-user Industry 2020 & 2033
- Table 30: Global MEA Paper and Paperboard Industry Revenue billion Forecast, by Country 2020 & 2033
- Table 31: Turkey MEA Paper and Paperboard Industry Revenue (billion) Forecast, by Application 2020 & 2033
- Table 32: Israel MEA Paper and Paperboard Industry Revenue (billion) Forecast, by Application 2020 & 2033
- Table 33: GCC MEA Paper and Paperboard Industry Revenue (billion) Forecast, by Application 2020 & 2033
- Table 34: North Africa MEA Paper and Paperboard Industry Revenue (billion) Forecast, by Application 2020 & 2033
- Table 35: South Africa MEA Paper and Paperboard Industry Revenue (billion) Forecast, by Application 2020 & 2033
- Table 36: Rest of Middle East & Africa MEA Paper and Paperboard Industry Revenue (billion) Forecast, by Application 2020 & 2033
- Table 37: Global MEA Paper and Paperboard Industry Revenue billion Forecast, by Type 2020 & 2033
- Table 38: Global MEA Paper and Paperboard Industry Revenue billion Forecast, by End-user Industry 2020 & 2033
- Table 39: Global MEA Paper and Paperboard Industry Revenue billion Forecast, by Country 2020 & 2033
- Table 40: China MEA Paper and Paperboard Industry Revenue (billion) Forecast, by Application 2020 & 2033
- Table 41: India MEA Paper and Paperboard Industry Revenue (billion) Forecast, by Application 2020 & 2033
- Table 42: Japan MEA Paper and Paperboard Industry Revenue (billion) Forecast, by Application 2020 & 2033
- Table 43: South Korea MEA Paper and Paperboard Industry Revenue (billion) Forecast, by Application 2020 & 2033
- Table 44: ASEAN MEA Paper and Paperboard Industry Revenue (billion) Forecast, by Application 2020 & 2033
- Table 45: Oceania MEA Paper and Paperboard Industry Revenue (billion) Forecast, by Application 2020 & 2033
- Table 46: Rest of Asia Pacific MEA Paper and Paperboard Industry Revenue (billion) Forecast, by Application 2020 & 2033
Frequently Asked Questions
1. What is the projected Compound Annual Growth Rate (CAGR) of the MEA Paper and Paperboard Industry?
The projected CAGR is approximately 4.28%.
2. Which companies are prominent players in the MEA Paper and Paperboard Industry?
Key companies in the market include Matco Packaging LLC, Al Rumanah Packaging, Hotpack Packaging Industries LLC, Global Carton Boxes Manufacturing LLC*List Not Exhaustive, United Carton Industries Company (UCIC), IFFCO, Tarboosh Packaging Co LLC, Green Packaging Boxes Ind LLC, Arabian Packaging Co LLC, International Paper.
3. What are the main segments of the MEA Paper and Paperboard Industry?
The market segments include Type, End-user Industry.
4. Can you provide details about the market size?
The market size is estimated to be USD 337.64 billion as of 2022.
5. What are some drivers contributing to market growth?
Introduction of Advanced Packaging Technologies to Increase Sales; Increasing Demand for Packaging from Logistics and Transportation.
6. What are the notable trends driving market growth?
Container Board to Witness the Fastest Market Growth.
7. Are there any restraints impacting market growth?
High Costs and Import Duties Pose a Challenge for New Customers; Fluctuations in Raw Material Prices.
8. Can you provide examples of recent developments in the market?
N/A
9. What pricing options are available for accessing the report?
Pricing options include single-user, multi-user, and enterprise licenses priced at USD 4750, USD 4950, and USD 6800 respectively.
10. Is the market size provided in terms of value or volume?
The market size is provided in terms of value, measured in billion.
11. Are there any specific market keywords associated with the report?
Yes, the market keyword associated with the report is "MEA Paper and Paperboard Industry," which aids in identifying and referencing the specific market segment covered.
12. How do I determine which pricing option suits my needs best?
The pricing options vary based on user requirements and access needs. Individual users may opt for single-user licenses, while businesses requiring broader access may choose multi-user or enterprise licenses for cost-effective access to the report.
13. Are there any additional resources or data provided in the MEA Paper and Paperboard Industry report?
While the report offers comprehensive insights, it's advisable to review the specific contents or supplementary materials provided to ascertain if additional resources or data are available.
14. How can I stay updated on further developments or reports in the MEA Paper and Paperboard Industry?
To stay informed about further developments, trends, and reports in the MEA Paper and Paperboard Industry, consider subscribing to industry newsletters, following relevant companies and organizations, or regularly checking reputable industry news sources and publications.
Methodology
Step 1 - Identification of Relevant Samples Size from Population Database


Step 2 - Approaches for Defining Global Market Size (Value, Volume* & Price*)

Note*: In applicable scenarios
Step 3 - Data Sources
Primary Research
- Web Analytics
- Survey Reports
- Research Institute
- Latest Research Reports
- Opinion Leaders
Secondary Research
- Annual Reports
- White Paper
- Latest Press Release
- Industry Association
- Paid Database
- Investor Presentations

Step 4 - Data Triangulation
Involves using different sources of information in order to increase the validity of a study
These sources are likely to be stakeholders in a program - participants, other researchers, program staff, other community members, and so on.
Then we put all data in single framework & apply various statistical tools to find out the dynamic on the market.
During the analysis stage, feedback from the stakeholder groups would be compared to determine areas of agreement as well as areas of divergence