Key Insights
The Middle East and Africa (MEA) plastic packaging market is projected for significant expansion, anticipated to reach 4.65 million by 2025, and is expected to grow at a Compound Annual Growth Rate (CAGR) of 3.76% from 2025 to 2033. This growth is propelled by demographic shifts, including population expansion and rising disposable incomes, alongside an expanding middle class. Key demand drivers include the increasing need for safe and convenient packaging in the food & beverage, healthcare, and cosmetics industries. Technological advancements in sustainable and eco-friendly plastic packaging solutions are further contributing to market growth. Urbanization and the proliferation of modern retail formats across the region necessitate advanced packaging to enhance product integrity and shelf life. Economic diversification in MEA nations is also boosting industrial output, consequently increasing demand for industrial plastic packaging.
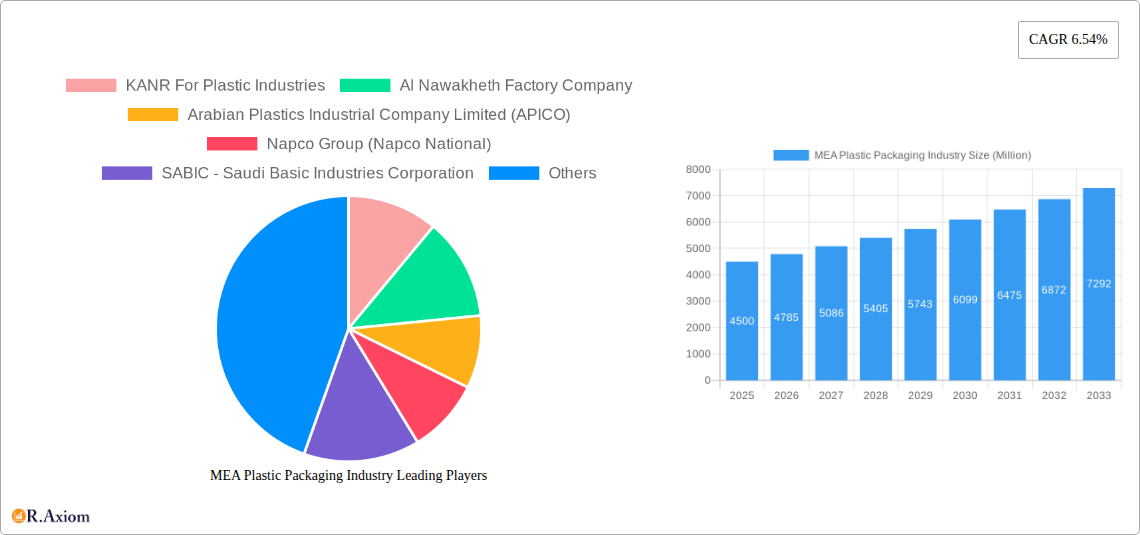
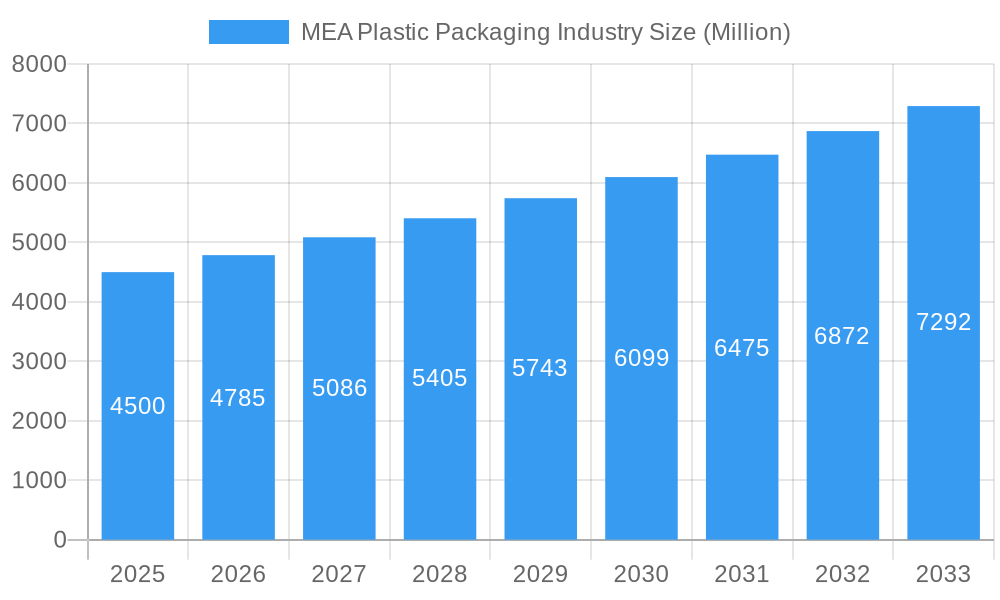
MEA Plastic Packaging Industry Market Size (In Million)
Key trends influencing the MEA plastic packaging sector include a strong preference for flexible packaging due to its cost-effectiveness, versatility, and reduced material consumption. Within rigid packaging, Polyethylene Terephthalate (PET) is anticipated to lead, primarily for beverage bottles and food containers. The cosmetics and personal care segment is witnessing a rise in demand for premium and aesthetically pleasing packaging. Market challenges include mounting environmental concerns, evolving government regulations on plastic waste management, and fluctuating raw material costs, which may affect profitability. Nevertheless, the inherent benefits of plastic packaging, such as durability, cost-efficiency, and superior performance, are expected to maintain its market leadership. The competitive environment features a mix of large multinational corporations and numerous local enterprises, actively pursuing market share through innovation and strategic collaborations.
MEA Plastic Packaging Industry Company Market Share
MEA Plastic Packaging Industry Market Concentration & Innovation
The MEA plastic packaging market exhibits a moderate to high concentration, with a few dominant players controlling significant market share, estimated at over 65%. Key contributors to this concentration include industry giants like SABIC - Saudi Basic Industries Corporation, Napco Group (Napco National), and Zamil Plastic Industries Co. These companies leverage economies of scale, extensive distribution networks, and significant R&D investments to maintain their leadership. Innovation in the MEA plastic packaging sector is primarily driven by the pursuit of sustainability, enhanced barrier properties for extended shelf life, and cost-effective manufacturing processes. Regulatory frameworks are evolving, with an increasing focus on plastic waste management and circular economy initiatives, influencing product development and material choices. While product substitutes like glass and metal packaging exist, plastic's versatility, cost-effectiveness, and lightweight properties continue to make it a preferred choice across diverse end-user industries. End-user trends, particularly the burgeoning demand from the food & beverage and healthcare sectors, are powerful innovation drivers. Mergers and acquisition (M&A) activities, though not extensively documented in the public domain for this region, are anticipated to play a crucial role in consolidating market share and fostering technological advancements, with estimated deal values potentially reaching hundreds of millions of dollars.
- Market Concentration: Over 65% controlled by top players.
- Key Innovation Drivers: Sustainability, barrier properties, cost-efficiency.
- Regulatory Influence: Growing emphasis on waste management and circular economy.
- End-User Demand: Significant push from food & beverage and healthcare sectors.
- M&A Potential: Expected to drive consolidation and innovation, with potential deal values in the hundreds of millions.
MEA Plastic Packaging Industry Industry Trends & Insights
The MEA plastic packaging market is poised for robust growth, driven by a confluence of accelerating economic development, expanding populations, and evolving consumer lifestyles. The compound annual growth rate (CAGR) is projected to be a healthy XX%, reflecting the region's increasing demand for packaged goods across various sectors. Market penetration is steadily increasing, particularly in emerging economies within the MEA region, as access to modern retail formats and consumer goods expands. Technological disruptions are playing a pivotal role, with advancements in materials science leading to the development of lighter, stronger, and more sustainable plastic packaging solutions. This includes innovations in bio-based plastics and enhanced recyclability. Consumer preferences are shifting towards convenience, safety, and sustainability. This translates into a demand for innovative packaging designs that offer extended shelf life, tamper-evident features, and are environmentally responsible. The competitive dynamics within the MEA plastic packaging landscape are characterized by a blend of large multinational corporations with a strong regional presence and a growing number of local manufacturers catering to specific market needs. Strategic partnerships and collaborations, such as the recent initiative involving SABIC, are becoming increasingly important for driving innovation and market reach. The emphasis on reducing the environmental impact of plastic packaging is a defining trend, spurring investments in recycling infrastructure and the development of circular economy models. The growing middle class in countries like Saudi Arabia and the United Arab Emirates, coupled with increased disposable income, is fueling consumption of processed foods, beverages, and personal care products, thereby directly boosting the demand for plastic packaging. Furthermore, the healthcare sector's expansion, driven by government initiatives and an aging population, is creating a significant need for sterile and protective plastic packaging solutions for pharmaceuticals and medical devices. The e-commerce boom also contributes to the demand for resilient and versatile plastic packaging for shipping and logistics.
Dominant Markets & Segments in MEA Plastic Packaging Industry
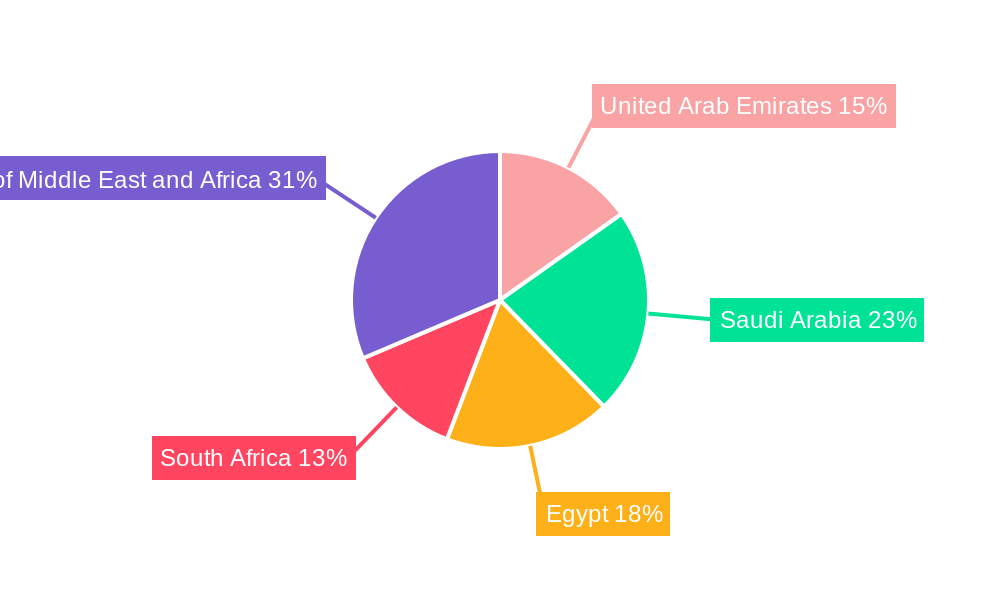
The MEA plastic packaging industry is characterized by significant dominance within specific geographical markets and product segments, driven by a complex interplay of economic policies, infrastructure development, and consumer behavior. Saudi Arabia and the United Arab Emirates consistently emerge as the leading markets, propelled by strong economic diversification strategies, substantial investments in manufacturing, and a relatively high disposable income among their populations. These nations are at the forefront of adopting advanced packaging technologies and sustainable practices.
Dominant Regions and Countries:
- Saudi Arabia: Benefits from large-scale petrochemical production, supportive government policies for industrial growth, and a substantial domestic market for packaged goods.
- United Arab Emirates: A global trade hub with advanced logistics infrastructure, driving demand for packaging across its thriving retail, tourism, and e-commerce sectors.
- Egypt: Possesses a large and growing population, making it a significant consumer market for food and beverage packaging. Economic reforms are further bolstering its industrial capabilities.
- South Africa: A mature market with well-established industrial sectors, including food and beverage and healthcare, which are major consumers of plastic packaging.
Dominant Segments by Packaging Type:
- Rigid Packaging:
- By Material: Polyethylene (PE), particularly HDPE and LDPE, dominates due to its versatility, cost-effectiveness, and wide range of applications. Polypropylene (PP) is also a key material, especially for tubs, cups, and containers requiring higher heat resistance and rigidity. Polyethylene Terephthalate (PET) is crucial for beverage bottles and jars.
- By End-user Industry: The Food and Beverage sector represents the largest consumer of rigid plastic packaging, driven by the demand for bottles, jars, tubs, and trays for a wide array of products. The Cosmetics and Personal Care industry also contributes significantly, utilizing attractive and functional rigid containers.
- Flexible Packaging:
- Polyethene (PE), in various forms like LDPE and LLDPE, is the predominant material for pouches, bags, and films due to its excellent barrier properties, flexibility, and cost. Bi-orientated Polypropylene (BOPP) films are also widely used for their clarity, strength, and printability, particularly in snack food and confectionery packaging.
Dominant Segments by Product:
- Bottles and Jars: This segment holds a substantial market share, driven by the beverage, food, and pharmaceutical industries.
- Pouches: A rapidly growing segment, especially for convenience foods, snacks, and personal care products, offering light-weighting and design flexibility.
- Tubs, Cups, Bowls, and Trays: Essential for dairy products, ready-to-eat meals, and takeout food services, witnessing consistent demand.
Key Drivers of Dominance:
- Economic Policies: Government incentives for manufacturing and industrial development in countries like Saudi Arabia and UAE.
- Infrastructure Development: Advanced logistics, cold chain facilities, and retail networks in key urban centers.
- Consumer Demographics: Growing middle class, urbanization, and increasing demand for convenience and processed foods.
- Raw Material Availability: Proximity to major petrochemical producers, particularly in the GCC region, influences cost competitiveness.
- Technological Adoption: Early adoption of advanced manufacturing technologies and sustainable packaging solutions.
MEA Plastic Packaging Industry Product Developments
Product developments in the MEA plastic packaging industry are increasingly focused on enhancing functionality, sustainability, and consumer appeal. Innovations include the introduction of advanced barrier materials for extended shelf life of perishable goods, the development of lightweight yet robust designs to reduce material consumption and transportation costs, and the integration of smart packaging features for traceability and authentication. There's a significant surge in the adoption of recycled content, particularly post-consumer recycled (PCR) materials, and the exploration of biodegradable and compostable alternatives. Companies are also investing in novel closure systems, easy-open features, and improved aesthetics to meet evolving consumer demands. These advancements offer competitive advantages by aligning with environmental regulations and consumer preferences for sustainable solutions.
Report Scope & Segmentation Analysis
This report provides a comprehensive analysis of the MEA Plastic Packaging Industry. The market is segmented by Packaging Type, encompassing Rigid Packaging and Flexible Packaging. Rigid packaging is further categorized by Material (Polyethylene (PE), Polyethylene Terephthalate (PET), Polypropylene (PP), Polystyrene (PS) and Expanded Polystyrene (EPS), Polyvinyl Chloride (PVC)) and by End-user Industry (Food, Beverage, Healthcare and Pharmaceutical, Cosmetics and Personal Care, Other End-user Industries). Flexible packaging is segmented by Material (Polyethene (PE), Bi-orientated Polypropylene (BOPP), Cast Polypropylene (CPP), Other Flexible Plastic Packaging Materials). The report also details the Product segmentation, including Bottles and Jars, Tubs, Cups, Bowls, and Trays, Intermediate Bulk Containers, Pouches, and Other Products. Geographically, the analysis covers the United Arab Emirates, Saudi Arabia, Egypt, South Africa, and the Rest of Middle East and Africa. Each segment is analyzed for its market size, growth projections, and competitive dynamics, offering a detailed view of the industry's landscape.
Key Drivers of MEA Plastic Packaging Industry Growth
Several key drivers are propelling the growth of the MEA plastic packaging industry.
- Economic Growth and Urbanization: Rising disposable incomes and the expanding middle class in countries like Saudi Arabia and the UAE are increasing consumer demand for packaged goods.
- Population Growth: A burgeoning population across the MEA region necessitates increased production and consumption of a wide range of products requiring effective packaging.
- Technological Advancements: Innovations in plastic materials, processing technologies, and sustainable packaging solutions are driving adoption and creating new market opportunities.
- Evolving Consumer Preferences: Growing demand for convenience, longer shelf life, and aesthetically pleasing packaging solutions is a significant market catalyst.
- Government Initiatives: Support for local manufacturing, industrial diversification, and infrastructure development in key MEA countries is fostering industry expansion.
Challenges in the MEA Plastic Packaging Industry Sector
Despite robust growth, the MEA plastic packaging industry faces several challenges.
- Environmental Concerns and Regulations: Increasing global and local pressure to reduce plastic waste and single-use plastics is leading to stricter regulations and a demand for sustainable alternatives, requiring significant investment in R&D and infrastructure.
- Volatile Raw Material Prices: Fluctuations in the prices of crude oil and its derivatives, key feedstocks for plastic production, can impact manufacturing costs and profitability.
- Supply Chain Disruptions: Geopolitical instability and global logistics challenges can affect the availability and cost of raw materials and finished products.
- Competition from Substitutes: While plastic offers numerous advantages, competition from materials like glass, metal, and paper-based packaging persists, especially in specific applications.
- Infrastructure Gaps: In some developing regions within MEA, inadequate waste management and recycling infrastructure can hinder the adoption of circular economy models.
Emerging Opportunities in MEA Plastic Packaging Industry
The MEA plastic packaging industry is ripe with emerging opportunities.
- Sustainable and Circular Packaging Solutions: The growing demand for recyclable, biodegradable, and compostable packaging presents a significant growth avenue. Investment in advanced recycling technologies and the use of recycled content (PCR) is a key opportunity.
- Growth in E-commerce: The rapid expansion of e-commerce across the region fuels the demand for durable, lightweight, and protective packaging solutions for shipping and logistics.
- Healthcare and Pharmaceutical Sector Expansion: Government investments in healthcare infrastructure and the growing demand for pharmaceuticals and medical devices create a substantial need for specialized, high-barrier, and sterile plastic packaging.
- Premiumization in Cosmetics and Personal Care: The rising disposable income and demand for premium beauty products drive the need for aesthetically sophisticated and functional plastic packaging.
- Emerging Markets within MEA: Untapped potential in less developed markets within the broader MEA region offers opportunities for market penetration and expansion of basic packaging solutions.
Leading Players in the MEA Plastic Packaging Industry Market
- KANR For Plastic Industries
- Al Nawakheth Factory Company
- Arabian Plastics Industrial Company Limited (APICO)
- Napco Group (Napco National)
- SABIC - Saudi Basic Industries Corporation
- Zamil Plastic Industries Co
- Sealed Air Corporation (Sealed Air Saudi Arabia)
- Takween Advanced Industries
- AL-Ghandoura Co Manuf Plastic GhanPlast
- Saudi Arabian Packaging Industry WLL (SAPIN)
- Saudi Plastic Factory Company
- Arnon Plastic Industry Co Ltd
- Plastico SPS
- Coloredsun
- National Plastic Factory LLC
- Packaging Products Company (PPC)
Key Developments in MEA Plastic Packaging Industry Industry
- June 2022: Sabic, a global leader in the chemical industry, joined forces with Heinz, Tesco, and Berry in an innovative recycling trial in the United Kingdom designed to close the loop on soft plastic food packaging. Flexible plastic packaging collected from Tesco stores has been used to produce certified circular polypropylene (PP) from Sabic's Trucircle portfolio for microwavable Heinz Beanz Snap Pots, made from 39% recycled soft plastic. Consumers are encouraged to return the soft plastic packaging to collection points at Tesco stores.
Strategic Outlook for MEA Plastic Packaging Industry Market
The strategic outlook for the MEA plastic packaging industry is characterized by continued growth driven by increasing consumer demand, technological advancements, and a growing emphasis on sustainability. Companies that can effectively innovate in areas like circular economy solutions, lightweighting, and enhanced functionality will be well-positioned for success. Strategic partnerships and investments in recycling infrastructure will be crucial for navigating regulatory landscapes and meeting evolving consumer preferences. The expanding food & beverage and healthcare sectors, coupled with the burgeoning e-commerce market, will continue to be significant growth catalysts, offering ample opportunities for both established players and new entrants to capture market share and drive industry innovation.
MEA Plastic Packaging Industry Segmentation
-
1. Packaging Type
-
1.1. Rigid
-
1.1.1. By Material
- 1.1.1.1. Polyethylene (PE)
- 1.1.1.2. Polyethylene Terephthalate (PET)
- 1.1.1.3. Polypropylene (PP)
- 1.1.1.4. Polystyrene (PS) and Expanded Polystyrene (EPS)
- 1.1.1.5. Polyvinyl Chloride (PVC)
-
1.1.2. By End-user Industry
- 1.1.2.1. Food
- 1.1.2.2. Beverage
- 1.1.2.3. Healthcare and Pharmaceutical
- 1.1.2.4. Cosmetics and Personal Care
- 1.1.2.5. Other End-user Industries
-
1.1.1. By Material
-
1.2. Flexible
- 1.2.1. Polyethene (PE)
- 1.2.2. Bi-orientated Polypropylene (BOPP)
- 1.2.3. Cast Polypropylene (CPP)
- 1.2.4. Other Flexible Plastic Packaging Materials
-
1.1. Rigid
-
2. Product
- 2.1. Bottles and Jars
- 2.2. Tubs, Cups, Bowls, and Trays
- 2.3. Intermediate Bulk Containers
- 2.4. Pouches
- 2.5. Other Products
-
3. Geography
- 3.1. United Arab Emirates
- 3.2. Saudi Arabia
- 3.3. Egypt
- 3.4. South Africa
- 3.5. Rest of Middle East and Africa
MEA Plastic Packaging Industry Segmentation By Geography
- 1. United Arab Emirates
- 2. Saudi Arabia
- 3. Egypt
- 4. South Africa
- 5. Rest of Middle East and Africa
MEA Plastic Packaging Industry Regional Market Share
Geographic Coverage of MEA Plastic Packaging Industry
MEA Plastic Packaging Industry REPORT HIGHLIGHTS
| Aspects | Details |
|---|---|
| Study Period | 2020-2034 |
| Base Year | 2025 |
| Estimated Year | 2026 |
| Forecast Period | 2026-2034 |
| Historical Period | 2020-2025 |
| Growth Rate | CAGR of 3.76% from 2020-2034 |
| Segmentation |
|
Table of Contents
- 1. Introduction
- 1.1. Research Scope
- 1.2. Market Segmentation
- 1.3. Research Objective
- 1.4. Definitions and Assumptions
- 2. Executive Summary
- 2.1. Market Snapshot
- 3. Market Dynamics
- 3.1. Market Drivers
- 3.2. Market Restrains
- 3.3. Market Trends
- 3.4. Market Opportunities
- 4. Market Factor Analysis
- 4.1. Porters Five Forces
- 4.1.1. Bargaining Power of Suppliers
- 4.1.2. Bargaining Power of Buyers
- 4.1.3. Threat of New Entrants
- 4.1.4. Threat of Substitutes
- 4.1.5. Competitive Rivalry
- 4.2. PESTEL analysis
- 4.3. BCG Analysis
- 4.3.1. Stars (High Growth, High Market Share)
- 4.3.2. Cash Cows (Low Growth, High Market Share)
- 4.3.3. Question Mark (High Growth, Low Market Share)
- 4.3.4. Dogs (Low Growth, Low Market Share)
- 4.4. Ansoff Matrix Analysis
- 4.5. Supply Chain Analysis
- 4.6. Regulatory Landscape
- 4.7. Current Market Potential and Opportunity Assessment (TAM–SAM–SOM Framework)
- 4.8. RAX Analyst Note
- 4.1. Porters Five Forces
- 5. Market Analysis, Insights and Forecast 2021-2033
- 5.1. Market Analysis, Insights and Forecast - by Packaging Type
- 5.1.1. Rigid
- 5.1.1.1. By Material
- 5.1.1.1.1. Polyethylene (PE)
- 5.1.1.1.2. Polyethylene Terephthalate (PET)
- 5.1.1.1.3. Polypropylene (PP)
- 5.1.1.1.4. Polystyrene (PS) and Expanded Polystyrene (EPS)
- 5.1.1.1.5. Polyvinyl Chloride (PVC)
- 5.1.1.2. By End-user Industry
- 5.1.1.2.1. Food
- 5.1.1.2.2. Beverage
- 5.1.1.2.3. Healthcare and Pharmaceutical
- 5.1.1.2.4. Cosmetics and Personal Care
- 5.1.1.2.5. Other End-user Industries
- 5.1.1.1. By Material
- 5.1.2. Flexible
- 5.1.2.1. Polyethene (PE)
- 5.1.2.2. Bi-orientated Polypropylene (BOPP)
- 5.1.2.3. Cast Polypropylene (CPP)
- 5.1.2.4. Other Flexible Plastic Packaging Materials
- 5.1.1. Rigid
- 5.2. Market Analysis, Insights and Forecast - by Product
- 5.2.1. Bottles and Jars
- 5.2.2. Tubs, Cups, Bowls, and Trays
- 5.2.3. Intermediate Bulk Containers
- 5.2.4. Pouches
- 5.2.5. Other Products
- 5.3. Market Analysis, Insights and Forecast - by Geography
- 5.3.1. United Arab Emirates
- 5.3.2. Saudi Arabia
- 5.3.3. Egypt
- 5.3.4. South Africa
- 5.3.5. Rest of Middle East and Africa
- 5.4. Market Analysis, Insights and Forecast - by Region
- 5.4.1. United Arab Emirates
- 5.4.2. Saudi Arabia
- 5.4.3. Egypt
- 5.4.4. South Africa
- 5.4.5. Rest of Middle East and Africa
- 5.1. Market Analysis, Insights and Forecast - by Packaging Type
- 6. Global MEA Plastic Packaging Industry Analysis, Insights and Forecast, 2021-2033
- 6.1. Market Analysis, Insights and Forecast - by Packaging Type
- 6.1.1. Rigid
- 6.1.1.1. By Material
- 6.1.1.1.1. Polyethylene (PE)
- 6.1.1.1.2. Polyethylene Terephthalate (PET)
- 6.1.1.1.3. Polypropylene (PP)
- 6.1.1.1.4. Polystyrene (PS) and Expanded Polystyrene (EPS)
- 6.1.1.1.5. Polyvinyl Chloride (PVC)
- 6.1.1.2. By End-user Industry
- 6.1.1.2.1. Food
- 6.1.1.2.2. Beverage
- 6.1.1.2.3. Healthcare and Pharmaceutical
- 6.1.1.2.4. Cosmetics and Personal Care
- 6.1.1.2.5. Other End-user Industries
- 6.1.1.1. By Material
- 6.1.2. Flexible
- 6.1.2.1. Polyethene (PE)
- 6.1.2.2. Bi-orientated Polypropylene (BOPP)
- 6.1.2.3. Cast Polypropylene (CPP)
- 6.1.2.4. Other Flexible Plastic Packaging Materials
- 6.1.1. Rigid
- 6.2. Market Analysis, Insights and Forecast - by Product
- 6.2.1. Bottles and Jars
- 6.2.2. Tubs, Cups, Bowls, and Trays
- 6.2.3. Intermediate Bulk Containers
- 6.2.4. Pouches
- 6.2.5. Other Products
- 6.3. Market Analysis, Insights and Forecast - by Geography
- 6.3.1. United Arab Emirates
- 6.3.2. Saudi Arabia
- 6.3.3. Egypt
- 6.3.4. South Africa
- 6.3.5. Rest of Middle East and Africa
- 6.1. Market Analysis, Insights and Forecast - by Packaging Type
- 7. United Arab Emirates MEA Plastic Packaging Industry Analysis, Insights and Forecast, 2020-2032
- 7.1. Market Analysis, Insights and Forecast - by Packaging Type
- 7.1.1. Rigid
- 7.1.1.1. By Material
- 7.1.1.1.1. Polyethylene (PE)
- 7.1.1.1.2. Polyethylene Terephthalate (PET)
- 7.1.1.1.3. Polypropylene (PP)
- 7.1.1.1.4. Polystyrene (PS) and Expanded Polystyrene (EPS)
- 7.1.1.1.5. Polyvinyl Chloride (PVC)
- 7.1.1.2. By End-user Industry
- 7.1.1.2.1. Food
- 7.1.1.2.2. Beverage
- 7.1.1.2.3. Healthcare and Pharmaceutical
- 7.1.1.2.4. Cosmetics and Personal Care
- 7.1.1.2.5. Other End-user Industries
- 7.1.1.1. By Material
- 7.1.2. Flexible
- 7.1.2.1. Polyethene (PE)
- 7.1.2.2. Bi-orientated Polypropylene (BOPP)
- 7.1.2.3. Cast Polypropylene (CPP)
- 7.1.2.4. Other Flexible Plastic Packaging Materials
- 7.1.1. Rigid
- 7.2. Market Analysis, Insights and Forecast - by Product
- 7.2.1. Bottles and Jars
- 7.2.2. Tubs, Cups, Bowls, and Trays
- 7.2.3. Intermediate Bulk Containers
- 7.2.4. Pouches
- 7.2.5. Other Products
- 7.3. Market Analysis, Insights and Forecast - by Geography
- 7.3.1. United Arab Emirates
- 7.3.2. Saudi Arabia
- 7.3.3. Egypt
- 7.3.4. South Africa
- 7.3.5. Rest of Middle East and Africa
- 7.1. Market Analysis, Insights and Forecast - by Packaging Type
- 8. Saudi Arabia MEA Plastic Packaging Industry Analysis, Insights and Forecast, 2020-2032
- 8.1. Market Analysis, Insights and Forecast - by Packaging Type
- 8.1.1. Rigid
- 8.1.1.1. By Material
- 8.1.1.1.1. Polyethylene (PE)
- 8.1.1.1.2. Polyethylene Terephthalate (PET)
- 8.1.1.1.3. Polypropylene (PP)
- 8.1.1.1.4. Polystyrene (PS) and Expanded Polystyrene (EPS)
- 8.1.1.1.5. Polyvinyl Chloride (PVC)
- 8.1.1.2. By End-user Industry
- 8.1.1.2.1. Food
- 8.1.1.2.2. Beverage
- 8.1.1.2.3. Healthcare and Pharmaceutical
- 8.1.1.2.4. Cosmetics and Personal Care
- 8.1.1.2.5. Other End-user Industries
- 8.1.1.1. By Material
- 8.1.2. Flexible
- 8.1.2.1. Polyethene (PE)
- 8.1.2.2. Bi-orientated Polypropylene (BOPP)
- 8.1.2.3. Cast Polypropylene (CPP)
- 8.1.2.4. Other Flexible Plastic Packaging Materials
- 8.1.1. Rigid
- 8.2. Market Analysis, Insights and Forecast - by Product
- 8.2.1. Bottles and Jars
- 8.2.2. Tubs, Cups, Bowls, and Trays
- 8.2.3. Intermediate Bulk Containers
- 8.2.4. Pouches
- 8.2.5. Other Products
- 8.3. Market Analysis, Insights and Forecast - by Geography
- 8.3.1. United Arab Emirates
- 8.3.2. Saudi Arabia
- 8.3.3. Egypt
- 8.3.4. South Africa
- 8.3.5. Rest of Middle East and Africa
- 8.1. Market Analysis, Insights and Forecast - by Packaging Type
- 9. Egypt MEA Plastic Packaging Industry Analysis, Insights and Forecast, 2020-2032
- 9.1. Market Analysis, Insights and Forecast - by Packaging Type
- 9.1.1. Rigid
- 9.1.1.1. By Material
- 9.1.1.1.1. Polyethylene (PE)
- 9.1.1.1.2. Polyethylene Terephthalate (PET)
- 9.1.1.1.3. Polypropylene (PP)
- 9.1.1.1.4. Polystyrene (PS) and Expanded Polystyrene (EPS)
- 9.1.1.1.5. Polyvinyl Chloride (PVC)
- 9.1.1.2. By End-user Industry
- 9.1.1.2.1. Food
- 9.1.1.2.2. Beverage
- 9.1.1.2.3. Healthcare and Pharmaceutical
- 9.1.1.2.4. Cosmetics and Personal Care
- 9.1.1.2.5. Other End-user Industries
- 9.1.1.1. By Material
- 9.1.2. Flexible
- 9.1.2.1. Polyethene (PE)
- 9.1.2.2. Bi-orientated Polypropylene (BOPP)
- 9.1.2.3. Cast Polypropylene (CPP)
- 9.1.2.4. Other Flexible Plastic Packaging Materials
- 9.1.1. Rigid
- 9.2. Market Analysis, Insights and Forecast - by Product
- 9.2.1. Bottles and Jars
- 9.2.2. Tubs, Cups, Bowls, and Trays
- 9.2.3. Intermediate Bulk Containers
- 9.2.4. Pouches
- 9.2.5. Other Products
- 9.3. Market Analysis, Insights and Forecast - by Geography
- 9.3.1. United Arab Emirates
- 9.3.2. Saudi Arabia
- 9.3.3. Egypt
- 9.3.4. South Africa
- 9.3.5. Rest of Middle East and Africa
- 9.1. Market Analysis, Insights and Forecast - by Packaging Type
- 10. South Africa MEA Plastic Packaging Industry Analysis, Insights and Forecast, 2020-2032
- 10.1. Market Analysis, Insights and Forecast - by Packaging Type
- 10.1.1. Rigid
- 10.1.1.1. By Material
- 10.1.1.1.1. Polyethylene (PE)
- 10.1.1.1.2. Polyethylene Terephthalate (PET)
- 10.1.1.1.3. Polypropylene (PP)
- 10.1.1.1.4. Polystyrene (PS) and Expanded Polystyrene (EPS)
- 10.1.1.1.5. Polyvinyl Chloride (PVC)
- 10.1.1.2. By End-user Industry
- 10.1.1.2.1. Food
- 10.1.1.2.2. Beverage
- 10.1.1.2.3. Healthcare and Pharmaceutical
- 10.1.1.2.4. Cosmetics and Personal Care
- 10.1.1.2.5. Other End-user Industries
- 10.1.1.1. By Material
- 10.1.2. Flexible
- 10.1.2.1. Polyethene (PE)
- 10.1.2.2. Bi-orientated Polypropylene (BOPP)
- 10.1.2.3. Cast Polypropylene (CPP)
- 10.1.2.4. Other Flexible Plastic Packaging Materials
- 10.1.1. Rigid
- 10.2. Market Analysis, Insights and Forecast - by Product
- 10.2.1. Bottles and Jars
- 10.2.2. Tubs, Cups, Bowls, and Trays
- 10.2.3. Intermediate Bulk Containers
- 10.2.4. Pouches
- 10.2.5. Other Products
- 10.3. Market Analysis, Insights and Forecast - by Geography
- 10.3.1. United Arab Emirates
- 10.3.2. Saudi Arabia
- 10.3.3. Egypt
- 10.3.4. South Africa
- 10.3.5. Rest of Middle East and Africa
- 10.1. Market Analysis, Insights and Forecast - by Packaging Type
- 11. Rest of Middle East and Africa MEA Plastic Packaging Industry Analysis, Insights and Forecast, 2020-2032
- 11.1. Market Analysis, Insights and Forecast - by Packaging Type
- 11.1.1. Rigid
- 11.1.1.1. By Material
- 11.1.1.1.1. Polyethylene (PE)
- 11.1.1.1.2. Polyethylene Terephthalate (PET)
- 11.1.1.1.3. Polypropylene (PP)
- 11.1.1.1.4. Polystyrene (PS) and Expanded Polystyrene (EPS)
- 11.1.1.1.5. Polyvinyl Chloride (PVC)
- 11.1.1.2. By End-user Industry
- 11.1.1.2.1. Food
- 11.1.1.2.2. Beverage
- 11.1.1.2.3. Healthcare and Pharmaceutical
- 11.1.1.2.4. Cosmetics and Personal Care
- 11.1.1.2.5. Other End-user Industries
- 11.1.1.1. By Material
- 11.1.2. Flexible
- 11.1.2.1. Polyethene (PE)
- 11.1.2.2. Bi-orientated Polypropylene (BOPP)
- 11.1.2.3. Cast Polypropylene (CPP)
- 11.1.2.4. Other Flexible Plastic Packaging Materials
- 11.1.1. Rigid
- 11.2. Market Analysis, Insights and Forecast - by Product
- 11.2.1. Bottles and Jars
- 11.2.2. Tubs, Cups, Bowls, and Trays
- 11.2.3. Intermediate Bulk Containers
- 11.2.4. Pouches
- 11.2.5. Other Products
- 11.3. Market Analysis, Insights and Forecast - by Geography
- 11.3.1. United Arab Emirates
- 11.3.2. Saudi Arabia
- 11.3.3. Egypt
- 11.3.4. South Africa
- 11.3.5. Rest of Middle East and Africa
- 11.1. Market Analysis, Insights and Forecast - by Packaging Type
- 12. Competitive Analysis
- 12.1. Company Profiles
- 12.1.1 KANR For Plastic Industries
- 12.1.1.1. Company Overview
- 12.1.1.2. Products
- 12.1.1.3. Company Financials
- 12.1.1.4. SWOT Analysis
- 12.1.2 Al Nawakheth Factory Company
- 12.1.2.1. Company Overview
- 12.1.2.2. Products
- 12.1.2.3. Company Financials
- 12.1.2.4. SWOT Analysis
- 12.1.3 Arabian Plastics Industrial Company Limited (APICO)
- 12.1.3.1. Company Overview
- 12.1.3.2. Products
- 12.1.3.3. Company Financials
- 12.1.3.4. SWOT Analysis
- 12.1.4 Napco Group (Napco National)
- 12.1.4.1. Company Overview
- 12.1.4.2. Products
- 12.1.4.3. Company Financials
- 12.1.4.4. SWOT Analysis
- 12.1.5 SABIC - Saudi Basic Industries Corporation
- 12.1.5.1. Company Overview
- 12.1.5.2. Products
- 12.1.5.3. Company Financials
- 12.1.5.4. SWOT Analysis
- 12.1.6 Zamil Plastic Industries Co
- 12.1.6.1. Company Overview
- 12.1.6.2. Products
- 12.1.6.3. Company Financials
- 12.1.6.4. SWOT Analysis
- 12.1.7 Sealed Air Corporation (Sealed Air Saudi Arabia)*List Not Exhaustive
- 12.1.7.1. Company Overview
- 12.1.7.2. Products
- 12.1.7.3. Company Financials
- 12.1.7.4. SWOT Analysis
- 12.1.8 Takween Advanced Industries
- 12.1.8.1. Company Overview
- 12.1.8.2. Products
- 12.1.8.3. Company Financials
- 12.1.8.4. SWOT Analysis
- 12.1.9 AL-Ghandoura Co Manuf Plastic GhanPlast)
- 12.1.9.1. Company Overview
- 12.1.9.2. Products
- 12.1.9.3. Company Financials
- 12.1.9.4. SWOT Analysis
- 12.1.10 Saudi Arabian Packaging Industry WLL (SAPIN)
- 12.1.10.1. Company Overview
- 12.1.10.2. Products
- 12.1.10.3. Company Financials
- 12.1.10.4. SWOT Analysis
- 12.1.11 Saudi Plastic Factory Company
- 12.1.11.1. Company Overview
- 12.1.11.2. Products
- 12.1.11.3. Company Financials
- 12.1.11.4. SWOT Analysis
- 12.1.12 Arnon Plastic Industry Co Ltd
- 12.1.12.1. Company Overview
- 12.1.12.2. Products
- 12.1.12.3. Company Financials
- 12.1.12.4. SWOT Analysis
- 12.1.13 Plastico SPS
- 12.1.13.1. Company Overview
- 12.1.13.2. Products
- 12.1.13.3. Company Financials
- 12.1.13.4. SWOT Analysis
- 12.1.14 Coloredsun
- 12.1.14.1. Company Overview
- 12.1.14.2. Products
- 12.1.14.3. Company Financials
- 12.1.14.4. SWOT Analysis
- 12.1.15 National Plastic Factory LLC
- 12.1.15.1. Company Overview
- 12.1.15.2. Products
- 12.1.15.3. Company Financials
- 12.1.15.4. SWOT Analysis
- 12.1.16 Packaging Products Company (PPC)
- 12.1.16.1. Company Overview
- 12.1.16.2. Products
- 12.1.16.3. Company Financials
- 12.1.16.4. SWOT Analysis
- 12.1.1 KANR For Plastic Industries
- 12.2. Market Entropy
- 12.2.1 Company's Key Areas Served
- 12.2.2 Recent Developments
- 12.3. Company Market Share Analysis 2025
- 12.3.1 Top 5 Companies Market Share Analysis
- 12.3.2 Top 3 Companies Market Share Analysis
- 12.4. List of Potential Customers
- 13. Research Methodology
List of Figures
- Figure 1: Global MEA Plastic Packaging Industry Revenue Breakdown (million, %) by Region 2025 & 2033
- Figure 2: United Arab Emirates MEA Plastic Packaging Industry Revenue (million), by Packaging Type 2025 & 2033
- Figure 3: United Arab Emirates MEA Plastic Packaging Industry Revenue Share (%), by Packaging Type 2025 & 2033
- Figure 4: United Arab Emirates MEA Plastic Packaging Industry Revenue (million), by Product 2025 & 2033
- Figure 5: United Arab Emirates MEA Plastic Packaging Industry Revenue Share (%), by Product 2025 & 2033
- Figure 6: United Arab Emirates MEA Plastic Packaging Industry Revenue (million), by Geography 2025 & 2033
- Figure 7: United Arab Emirates MEA Plastic Packaging Industry Revenue Share (%), by Geography 2025 & 2033
- Figure 8: United Arab Emirates MEA Plastic Packaging Industry Revenue (million), by Country 2025 & 2033
- Figure 9: United Arab Emirates MEA Plastic Packaging Industry Revenue Share (%), by Country 2025 & 2033
- Figure 10: Saudi Arabia MEA Plastic Packaging Industry Revenue (million), by Packaging Type 2025 & 2033
- Figure 11: Saudi Arabia MEA Plastic Packaging Industry Revenue Share (%), by Packaging Type 2025 & 2033
- Figure 12: Saudi Arabia MEA Plastic Packaging Industry Revenue (million), by Product 2025 & 2033
- Figure 13: Saudi Arabia MEA Plastic Packaging Industry Revenue Share (%), by Product 2025 & 2033
- Figure 14: Saudi Arabia MEA Plastic Packaging Industry Revenue (million), by Geography 2025 & 2033
- Figure 15: Saudi Arabia MEA Plastic Packaging Industry Revenue Share (%), by Geography 2025 & 2033
- Figure 16: Saudi Arabia MEA Plastic Packaging Industry Revenue (million), by Country 2025 & 2033
- Figure 17: Saudi Arabia MEA Plastic Packaging Industry Revenue Share (%), by Country 2025 & 2033
- Figure 18: Egypt MEA Plastic Packaging Industry Revenue (million), by Packaging Type 2025 & 2033
- Figure 19: Egypt MEA Plastic Packaging Industry Revenue Share (%), by Packaging Type 2025 & 2033
- Figure 20: Egypt MEA Plastic Packaging Industry Revenue (million), by Product 2025 & 2033
- Figure 21: Egypt MEA Plastic Packaging Industry Revenue Share (%), by Product 2025 & 2033
- Figure 22: Egypt MEA Plastic Packaging Industry Revenue (million), by Geography 2025 & 2033
- Figure 23: Egypt MEA Plastic Packaging Industry Revenue Share (%), by Geography 2025 & 2033
- Figure 24: Egypt MEA Plastic Packaging Industry Revenue (million), by Country 2025 & 2033
- Figure 25: Egypt MEA Plastic Packaging Industry Revenue Share (%), by Country 2025 & 2033
- Figure 26: South Africa MEA Plastic Packaging Industry Revenue (million), by Packaging Type 2025 & 2033
- Figure 27: South Africa MEA Plastic Packaging Industry Revenue Share (%), by Packaging Type 2025 & 2033
- Figure 28: South Africa MEA Plastic Packaging Industry Revenue (million), by Product 2025 & 2033
- Figure 29: South Africa MEA Plastic Packaging Industry Revenue Share (%), by Product 2025 & 2033
- Figure 30: South Africa MEA Plastic Packaging Industry Revenue (million), by Geography 2025 & 2033
- Figure 31: South Africa MEA Plastic Packaging Industry Revenue Share (%), by Geography 2025 & 2033
- Figure 32: South Africa MEA Plastic Packaging Industry Revenue (million), by Country 2025 & 2033
- Figure 33: South Africa MEA Plastic Packaging Industry Revenue Share (%), by Country 2025 & 2033
- Figure 34: Rest of Middle East and Africa MEA Plastic Packaging Industry Revenue (million), by Packaging Type 2025 & 2033
- Figure 35: Rest of Middle East and Africa MEA Plastic Packaging Industry Revenue Share (%), by Packaging Type 2025 & 2033
- Figure 36: Rest of Middle East and Africa MEA Plastic Packaging Industry Revenue (million), by Product 2025 & 2033
- Figure 37: Rest of Middle East and Africa MEA Plastic Packaging Industry Revenue Share (%), by Product 2025 & 2033
- Figure 38: Rest of Middle East and Africa MEA Plastic Packaging Industry Revenue (million), by Geography 2025 & 2033
- Figure 39: Rest of Middle East and Africa MEA Plastic Packaging Industry Revenue Share (%), by Geography 2025 & 2033
- Figure 40: Rest of Middle East and Africa MEA Plastic Packaging Industry Revenue (million), by Country 2025 & 2033
- Figure 41: Rest of Middle East and Africa MEA Plastic Packaging Industry Revenue Share (%), by Country 2025 & 2033
List of Tables
- Table 1: Global MEA Plastic Packaging Industry Revenue million Forecast, by Packaging Type 2020 & 2033
- Table 2: Global MEA Plastic Packaging Industry Revenue million Forecast, by Product 2020 & 2033
- Table 3: Global MEA Plastic Packaging Industry Revenue million Forecast, by Geography 2020 & 2033
- Table 4: Global MEA Plastic Packaging Industry Revenue million Forecast, by Region 2020 & 2033
- Table 5: Global MEA Plastic Packaging Industry Revenue million Forecast, by Packaging Type 2020 & 2033
- Table 6: Global MEA Plastic Packaging Industry Revenue million Forecast, by Product 2020 & 2033
- Table 7: Global MEA Plastic Packaging Industry Revenue million Forecast, by Geography 2020 & 2033
- Table 8: Global MEA Plastic Packaging Industry Revenue million Forecast, by Country 2020 & 2033
- Table 9: Global MEA Plastic Packaging Industry Revenue million Forecast, by Packaging Type 2020 & 2033
- Table 10: Global MEA Plastic Packaging Industry Revenue million Forecast, by Product 2020 & 2033
- Table 11: Global MEA Plastic Packaging Industry Revenue million Forecast, by Geography 2020 & 2033
- Table 12: Global MEA Plastic Packaging Industry Revenue million Forecast, by Country 2020 & 2033
- Table 13: Global MEA Plastic Packaging Industry Revenue million Forecast, by Packaging Type 2020 & 2033
- Table 14: Global MEA Plastic Packaging Industry Revenue million Forecast, by Product 2020 & 2033
- Table 15: Global MEA Plastic Packaging Industry Revenue million Forecast, by Geography 2020 & 2033
- Table 16: Global MEA Plastic Packaging Industry Revenue million Forecast, by Country 2020 & 2033
- Table 17: Global MEA Plastic Packaging Industry Revenue million Forecast, by Packaging Type 2020 & 2033
- Table 18: Global MEA Plastic Packaging Industry Revenue million Forecast, by Product 2020 & 2033
- Table 19: Global MEA Plastic Packaging Industry Revenue million Forecast, by Geography 2020 & 2033
- Table 20: Global MEA Plastic Packaging Industry Revenue million Forecast, by Country 2020 & 2033
- Table 21: Global MEA Plastic Packaging Industry Revenue million Forecast, by Packaging Type 2020 & 2033
- Table 22: Global MEA Plastic Packaging Industry Revenue million Forecast, by Product 2020 & 2033
- Table 23: Global MEA Plastic Packaging Industry Revenue million Forecast, by Geography 2020 & 2033
- Table 24: Global MEA Plastic Packaging Industry Revenue million Forecast, by Country 2020 & 2033
Frequently Asked Questions
1. What is the projected Compound Annual Growth Rate (CAGR) of the MEA Plastic Packaging Industry?
The projected CAGR is approximately 3.76%.
2. Which companies are prominent players in the MEA Plastic Packaging Industry?
Key companies in the market include KANR For Plastic Industries, Al Nawakheth Factory Company, Arabian Plastics Industrial Company Limited (APICO), Napco Group (Napco National), SABIC - Saudi Basic Industries Corporation, Zamil Plastic Industries Co, Sealed Air Corporation (Sealed Air Saudi Arabia)*List Not Exhaustive, Takween Advanced Industries, AL-Ghandoura Co Manuf Plastic GhanPlast), Saudi Arabian Packaging Industry WLL (SAPIN), Saudi Plastic Factory Company, Arnon Plastic Industry Co Ltd, Plastico SPS, Coloredsun, National Plastic Factory LLC, Packaging Products Company (PPC).
3. What are the main segments of the MEA Plastic Packaging Industry?
The market segments include Packaging Type, Product, Geography.
4. Can you provide details about the market size?
The market size is estimated to be USD 4.65 million as of 2022.
5. What are some drivers contributing to market growth?
Demand for Oxo-Degradable Plastics.
6. What are the notable trends driving market growth?
Flexible Packaging is Expected to Witness Significant Growth.
7. Are there any restraints impacting market growth?
Environmental Concerns Over Recycling and Safe Disposal and Price Volatility of Raw Materials.
8. Can you provide examples of recent developments in the market?
June 2022: Sabic, a global leader in the chemical industry, joined forces with Heinz, Tesco, and Berry in an innovative recycling trial in the United Kingdom designed to close the loop on soft plastic food packaging. Flexible plastic packaging collected from Tesco stores has been used to produce certified circular polypropylene (PP) from Sabic's Trucircle portfolio for microwavable Heinz Beanz Snap Pots, made from 39% recycled soft plastic. Consumers are encouraged to return the soft plastic packaging to collection points at Tesco stores.
9. What pricing options are available for accessing the report?
Pricing options include single-user, multi-user, and enterprise licenses priced at USD 4750, USD 5250, and USD 8750 respectively.
10. Is the market size provided in terms of value or volume?
The market size is provided in terms of value, measured in million.
11. Are there any specific market keywords associated with the report?
Yes, the market keyword associated with the report is "MEA Plastic Packaging Industry," which aids in identifying and referencing the specific market segment covered.
12. How do I determine which pricing option suits my needs best?
The pricing options vary based on user requirements and access needs. Individual users may opt for single-user licenses, while businesses requiring broader access may choose multi-user or enterprise licenses for cost-effective access to the report.
13. Are there any additional resources or data provided in the MEA Plastic Packaging Industry report?
While the report offers comprehensive insights, it's advisable to review the specific contents or supplementary materials provided to ascertain if additional resources or data are available.
14. How can I stay updated on further developments or reports in the MEA Plastic Packaging Industry?
To stay informed about further developments, trends, and reports in the MEA Plastic Packaging Industry, consider subscribing to industry newsletters, following relevant companies and organizations, or regularly checking reputable industry news sources and publications.
Methodology
Step 1 - Identification of Relevant Samples Size from Population Database


Step 2 - Approaches for Defining Global Market Size (Value, Volume* & Price*)

Note*: In applicable scenarios
Step 3 - Data Sources
Primary Research
- Web Analytics
- Survey Reports
- Research Institute
- Latest Research Reports
- Opinion Leaders
Secondary Research
- Annual Reports
- White Paper
- Latest Press Release
- Industry Association
- Paid Database
- Investor Presentations

Step 4 - Data Triangulation
Involves using different sources of information in order to increase the validity of a study
These sources are likely to be stakeholders in a program - participants, other researchers, program staff, other community members, and so on.
Then we put all data in single framework & apply various statistical tools to find out the dynamic on the market.
During the analysis stage, feedback from the stakeholder groups would be compared to determine areas of agreement as well as areas of divergence

