Key Insights
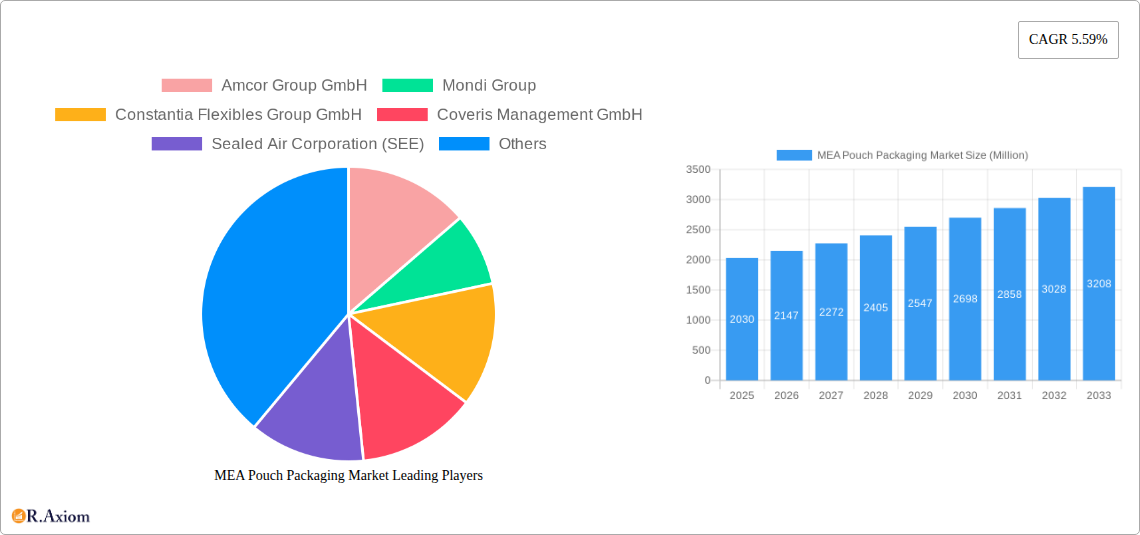
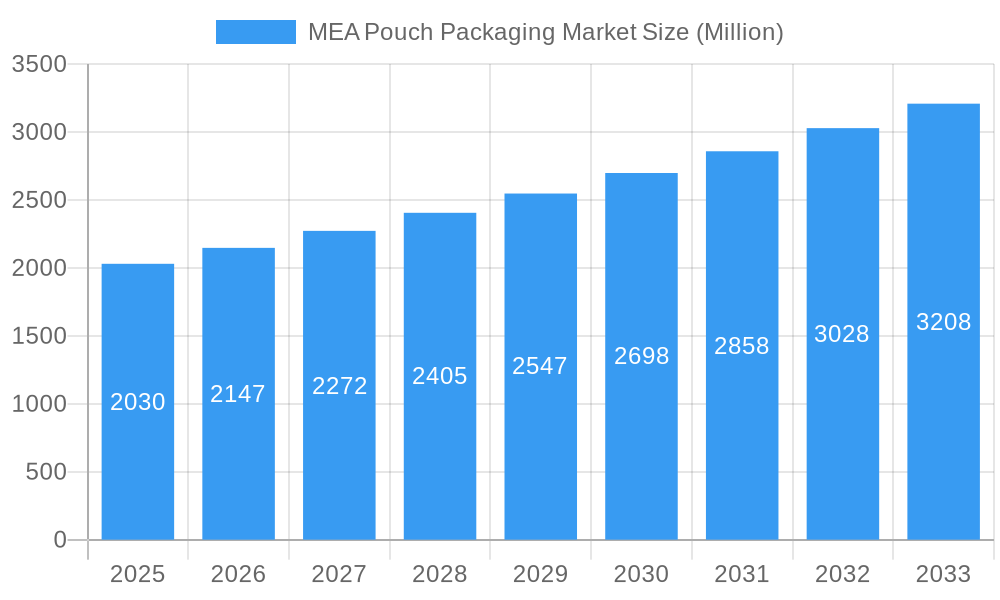
The Middle East and Africa (MEA) pouch packaging market is experiencing robust growth, projected to reach \$2.03 billion in 2025 and maintain a Compound Annual Growth Rate (CAGR) of 5.59% from 2025 to 2033. This expansion is driven by several key factors. The rising demand for convenient and shelf-stable food and beverage products, particularly in rapidly urbanizing regions, fuels the need for efficient and cost-effective packaging solutions like pouches. Furthermore, the increasing adoption of flexible packaging across various sectors, including pharmaceuticals and personal care, contributes significantly to market growth. E-commerce growth and the associated need for lightweight, easy-to-ship packaging further bolster demand. Technological advancements in pouch materials, such as improved barrier properties and sustainable options, also play a crucial role. However, fluctuations in raw material prices and concerns regarding plastic waste management pose challenges to sustained market expansion. Major players like Amcor, Mondi, Constantia Flexibles, and Huhtamaki are actively shaping the market landscape through product innovation and strategic partnerships. The competitive landscape is characterized by both global giants and regional players, leading to continuous innovation in packaging designs and functionalities.
MEA Pouch Packaging Market Market Size (In Billion)
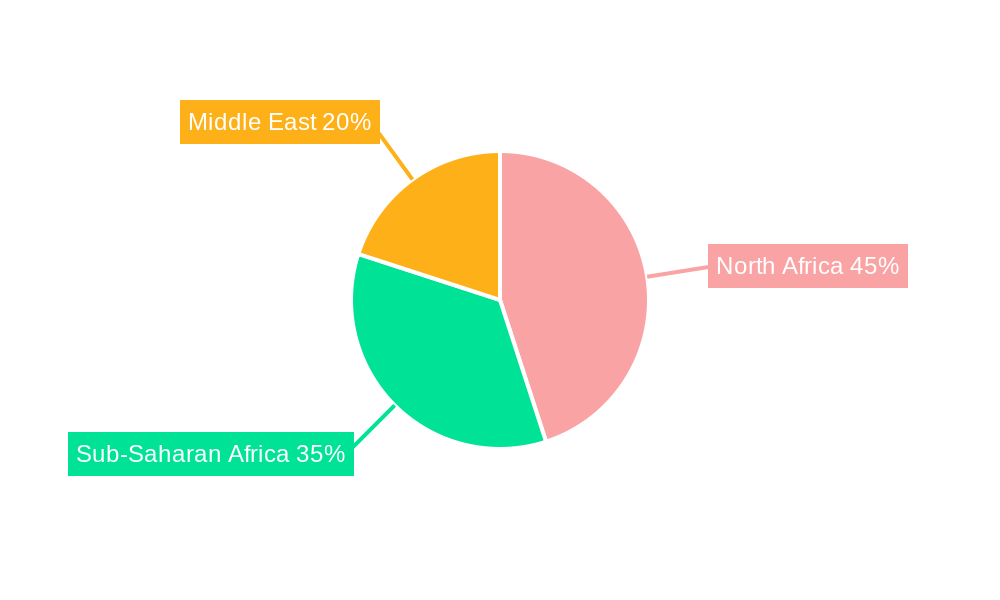
The segment breakdown of the MEA pouch packaging market, while not explicitly provided, can be reasonably inferred. Given the region’s demographic trends, the food and beverage sector likely constitutes the largest segment, followed by personal care and pharmaceuticals. Further segmentation could exist based on pouch material (e.g., stand-up pouches, spouted pouches, doypacks) and packaging type (e.g., laminated pouches, retort pouches). Regional variations within the MEA market are expected, with countries experiencing faster economic growth and rising disposable incomes exhibiting stronger demand for packaged goods. Companies are responding to this by tailoring their offerings to meet specific regional preferences and regulatory requirements. A focus on sustainability is becoming increasingly important, with manufacturers exploring biodegradable and recyclable materials to mitigate environmental impact.
MEA Pouch Packaging Market Company Market Share
MEA Pouch Packaging Market: A Comprehensive Report (2019-2033)
This detailed report provides a comprehensive analysis of the MEA (Middle East and Africa) Pouch Packaging Market, offering actionable insights for industry stakeholders. The study period spans from 2019 to 2033, with 2025 serving as the base and estimated year. The report covers market size, segmentation, growth drivers, challenges, opportunities, and competitive landscape, providing a 360-degree view of this dynamic market expected to reach xx Million by 2033.
MEA Pouch Packaging Market Concentration & Innovation
The MEA pouch packaging market exhibits a moderately concentrated landscape, with key players like Amcor Group GmbH, Mondi Group, Constantia Flexibles Group GmbH, and Sealed Air Corporation (SEE) holding significant market share. However, the presence of regional players and emerging companies fosters competition. Innovation is a key driver, with advancements in materials (e.g., sustainable and recyclable options), flexible packaging technologies (e.g., retort pouches, stand-up pouches), and automation playing a crucial role. Regulatory frameworks concerning food safety and environmental sustainability are influencing packaging choices. The market witnesses significant M&A activity, as seen in recent acquisitions by Ishida Europe, reflecting a consolidation trend and pursuit of technological advancements.
- Market Concentration: Top 5 players hold approximately xx% of the market share (estimated).
- Innovation Drivers: Sustainable materials, advanced packaging technologies, automation.
- Regulatory Landscape: Stringent food safety and environmental regulations are shaping the market.
- Product Substitutes: Rigid packaging alternatives pose a challenge, though pouches offer advantages in terms of cost and convenience.
- End-User Trends: Growing demand for convenience and on-the-go consumption fuels pouch packaging adoption.
- M&A Activity: Recent deals like Ishida Europe's acquisition of NPS (March 2024) demonstrate a consolidation trend, with estimated deal values exceeding xx Million in the past 5 years.
MEA Pouch Packaging Market Industry Trends & Insights
The MEA pouch packaging market is experiencing robust growth, driven by factors like rising disposable incomes, changing consumer preferences towards convenience, and the expanding food and beverage sector. The CAGR during the historical period (2019-2024) was approximately xx%, and is projected to reach xx% during the forecast period (2025-2033). Market penetration in key segments, such as food and beverages, is increasing at a steady pace, surpassing xx% in major markets. Technological disruptions, including advancements in flexible packaging materials and automated filling and sealing machinery are significantly impacting the industry. Competitive dynamics are characterized by both established multinational corporations and regional players vying for market share. Consumer preferences are shifting towards sustainable and recyclable packaging options, putting pressure on manufacturers to innovate and adapt.
Dominant Markets & Segments in MEA Pouch Packaging Market
The food and beverage sector is currently the dominant segment in the MEA pouch packaging market, followed by personal care and pharmaceuticals. Within MEA, countries like [Country A] and [Country B] showcase strong growth due to factors like expanding middle classes and favorable government policies.
- Key Drivers in Dominant Regions:
- [Country A]: Rapid urbanization, rising disposable incomes, favorable government regulations.
- [Country B]: Growing tourism, investment in infrastructure, and strong consumer demand.
- [Country C]: [Add factors for any other country].
The dominance of specific segments is attributed to factors like increasing demand for convenient packaging, rising popularity of ready-to-eat meals, and the growth of the e-commerce industry.
MEA Pouch Packaging Market Product Developments
Recent product innovations focus on sustainable materials like biodegradable and compostable polymers, improved barrier properties to enhance shelf life, and specialized pouches for specific product applications (e.g., retort pouches for heat-sensitive foods). These developments enhance product appeal and meet consumer demand for eco-friendly packaging solutions. Stand-up pouches, offering convenience and shelf visibility, are gaining popularity.
Report Scope & Segmentation Analysis
The report segments the MEA pouch packaging market by material type (plastic, paper, foil, etc.), packaging type (stand-up pouches, sachets, etc.), application (food, beverages, personal care, etc.), and geography. Each segment's market size, growth projections, and competitive landscape are analyzed in detail. Growth projections vary significantly across segments, with sustainable packaging materials showing exceptionally high growth.
Key Drivers of MEA Pouch Packaging Market Growth
Several factors drive the market's growth: rising disposable incomes and expanding middle class across many MEA countries, leading to increased demand for convenient and ready-to-eat foods, and growth of the e-commerce sector, requiring efficient packaging solutions. Government initiatives promoting sustainable packaging also play a vital role. Technological advancements in flexible packaging materials and production technologies further enhance market expansion.
Challenges in the MEA Pouch Packaging Market Sector
Challenges include fluctuating raw material prices, environmental concerns regarding plastic waste, and the need for infrastructure development in some parts of the region to support efficient supply chains. Regulatory hurdles and compliance issues related to food safety and sustainability also pose obstacles. These factors collectively impact profitability and competitiveness. Estimated impact of these challenges resulted in a loss of approximately xx Million in 2024.
Emerging Opportunities in MEA Pouch Packaging Market
Emerging opportunities lie in the adoption of sustainable packaging materials (bioplastics, compostable films), growth of the e-commerce sector leading to increased demand for innovative packaging, and the increasing popularity of functional foods and beverages creating demand for specialized pouches. Focus on advanced automation to improve efficiency also presents notable opportunities.
Leading Players in the MEA Pouch Packaging Market Market
- Amcor Group GmbH
- Mondi Group
- Constantia Flexibles Group GmbH
- Coveris Management GmbH
- Sealed Air Corporation (SEE)
- Huhtamaki Oyj
- Uflex Ltd
- Napco National
- Foster International Packaging
- Emirates Printing Press (LLC)
Key Developments in MEA Pouch Packaging Market Industry
- March 2024: Ishida Europe's acquisition of National Packaging Systems (NPS) expands its African footprint and offers entry-level automation solutions.
- October 2023: ACMA and VOLPAK's expansion into MEA focuses on high-speed liquid packaging solutions, catering to regional demands for pouches and doypacks.
Strategic Outlook for MEA Pouch Packaging Market Market
The MEA pouch packaging market presents significant growth potential driven by evolving consumer preferences, economic growth, and technological innovation. Focus on sustainable solutions, coupled with strategic partnerships and investments in advanced technologies, will be crucial for long-term success. The market is poised for continued expansion, with a significant increase in market size projected over the next decade.
MEA Pouch Packaging Market Segmentation
-
1. Material
-
1.1. Plastic
- 1.1.1. Polyethylene
- 1.1.2. Polypropylene
- 1.1.3. PET
- 1.1.4. PVC
- 1.1.5. EVOH
- 1.1.6. Other Resins
- 1.2. Paper
- 1.3. Aluminum
-
1.1. Plastic
-
2. Type
- 2.1. Standard
- 2.2. Aseptic
- 2.3. Retort
- 2.4. Hot Fill
-
3. Product
- 3.1. Flat (Pillow & Side-Seal)
- 3.2. Stand-up
-
4. End-User Industry
-
4.1. Food
- 4.1.1. Candy & Confectionery
- 4.1.2. Frozen Foods
- 4.1.3. Fresh Produce
- 4.1.4. Dairy Products
- 4.1.5. Dry Foods
- 4.1.6. Meat, Poultry, and Seafood
- 4.1.7. Pet Food
- 4.1.8. Other Fo
- 4.2. Medical and Pharmaceutical
- 4.3. Personal Care and Household Care
- 4.4. Other En
-
4.1. Food
MEA Pouch Packaging Market Segmentation By Geography
-
1. North America
- 1.1. United States
- 1.2. Canada
- 1.3. Mexico
-
2. South America
- 2.1. Brazil
- 2.2. Argentina
- 2.3. Rest of South America
-
3. Europe
- 3.1. United Kingdom
- 3.2. Germany
- 3.3. France
- 3.4. Italy
- 3.5. Spain
- 3.6. Russia
- 3.7. Benelux
- 3.8. Nordics
- 3.9. Rest of Europe
-
4. Middle East & Africa
- 4.1. Turkey
- 4.2. Israel
- 4.3. GCC
- 4.4. North Africa
- 4.5. South Africa
- 4.6. Rest of Middle East & Africa
-
5. Asia Pacific
- 5.1. China
- 5.2. India
- 5.3. Japan
- 5.4. South Korea
- 5.5. ASEAN
- 5.6. Oceania
- 5.7. Rest of Asia Pacific
MEA Pouch Packaging Market Regional Market Share
Geographic Coverage of MEA Pouch Packaging Market
MEA Pouch Packaging Market REPORT HIGHLIGHTS
| Aspects | Details |
|---|---|
| Study Period | 2020-2034 |
| Base Year | 2025 |
| Estimated Year | 2026 |
| Forecast Period | 2026-2034 |
| Historical Period | 2020-2025 |
| Growth Rate | CAGR of 5.59% from 2020-2034 |
| Segmentation |
|
Table of Contents
- 1. Introduction
- 1.1. Research Scope
- 1.2. Market Segmentation
- 1.3. Research Objective
- 1.4. Definitions and Assumptions
- 2. Executive Summary
- 2.1. Market Snapshot
- 3. Market Dynamics
- 3.1. Market Drivers
- 3.2. Market Restrains
- 3.3. Market Trends
- 3.4. Market Opportunities
- 4. Market Factor Analysis
- 4.1. Porters Five Forces
- 4.1.1. Bargaining Power of Suppliers
- 4.1.2. Bargaining Power of Buyers
- 4.1.3. Threat of New Entrants
- 4.1.4. Threat of Substitutes
- 4.1.5. Competitive Rivalry
- 4.2. PESTEL analysis
- 4.3. BCG Analysis
- 4.3.1. Stars (High Growth, High Market Share)
- 4.3.2. Cash Cows (Low Growth, High Market Share)
- 4.3.3. Question Mark (High Growth, Low Market Share)
- 4.3.4. Dogs (Low Growth, Low Market Share)
- 4.4. Ansoff Matrix Analysis
- 4.5. Supply Chain Analysis
- 4.6. Regulatory Landscape
- 4.7. Current Market Potential and Opportunity Assessment (TAM–SAM–SOM Framework)
- 4.8. RAX Analyst Note
- 4.1. Porters Five Forces
- 5. Market Analysis, Insights and Forecast 2021-2033
- 5.1. Market Analysis, Insights and Forecast - by Material
- 5.1.1. Plastic
- 5.1.1.1. Polyethylene
- 5.1.1.2. Polypropylene
- 5.1.1.3. PET
- 5.1.1.4. PVC
- 5.1.1.5. EVOH
- 5.1.1.6. Other Resins
- 5.1.2. Paper
- 5.1.3. Aluminum
- 5.1.1. Plastic
- 5.2. Market Analysis, Insights and Forecast - by Type
- 5.2.1. Standard
- 5.2.2. Aseptic
- 5.2.3. Retort
- 5.2.4. Hot Fill
- 5.3. Market Analysis, Insights and Forecast - by Product
- 5.3.1. Flat (Pillow & Side-Seal)
- 5.3.2. Stand-up
- 5.4. Market Analysis, Insights and Forecast - by End-User Industry
- 5.4.1. Food
- 5.4.1.1. Candy & Confectionery
- 5.4.1.2. Frozen Foods
- 5.4.1.3. Fresh Produce
- 5.4.1.4. Dairy Products
- 5.4.1.5. Dry Foods
- 5.4.1.6. Meat, Poultry, and Seafood
- 5.4.1.7. Pet Food
- 5.4.1.8. Other Fo
- 5.4.2. Medical and Pharmaceutical
- 5.4.3. Personal Care and Household Care
- 5.4.4. Other En
- 5.4.1. Food
- 5.5. Market Analysis, Insights and Forecast - by Region
- 5.5.1. North America
- 5.5.2. South America
- 5.5.3. Europe
- 5.5.4. Middle East & Africa
- 5.5.5. Asia Pacific
- 5.1. Market Analysis, Insights and Forecast - by Material
- 6. Global MEA Pouch Packaging Market Analysis, Insights and Forecast, 2021-2033
- 6.1. Market Analysis, Insights and Forecast - by Material
- 6.1.1. Plastic
- 6.1.1.1. Polyethylene
- 6.1.1.2. Polypropylene
- 6.1.1.3. PET
- 6.1.1.4. PVC
- 6.1.1.5. EVOH
- 6.1.1.6. Other Resins
- 6.1.2. Paper
- 6.1.3. Aluminum
- 6.1.1. Plastic
- 6.2. Market Analysis, Insights and Forecast - by Type
- 6.2.1. Standard
- 6.2.2. Aseptic
- 6.2.3. Retort
- 6.2.4. Hot Fill
- 6.3. Market Analysis, Insights and Forecast - by Product
- 6.3.1. Flat (Pillow & Side-Seal)
- 6.3.2. Stand-up
- 6.4. Market Analysis, Insights and Forecast - by End-User Industry
- 6.4.1. Food
- 6.4.1.1. Candy & Confectionery
- 6.4.1.2. Frozen Foods
- 6.4.1.3. Fresh Produce
- 6.4.1.4. Dairy Products
- 6.4.1.5. Dry Foods
- 6.4.1.6. Meat, Poultry, and Seafood
- 6.4.1.7. Pet Food
- 6.4.1.8. Other Fo
- 6.4.2. Medical and Pharmaceutical
- 6.4.3. Personal Care and Household Care
- 6.4.4. Other En
- 6.4.1. Food
- 6.1. Market Analysis, Insights and Forecast - by Material
- 7. North America MEA Pouch Packaging Market Analysis, Insights and Forecast, 2020-2032
- 7.1. Market Analysis, Insights and Forecast - by Material
- 7.1.1. Plastic
- 7.1.1.1. Polyethylene
- 7.1.1.2. Polypropylene
- 7.1.1.3. PET
- 7.1.1.4. PVC
- 7.1.1.5. EVOH
- 7.1.1.6. Other Resins
- 7.1.2. Paper
- 7.1.3. Aluminum
- 7.1.1. Plastic
- 7.2. Market Analysis, Insights and Forecast - by Type
- 7.2.1. Standard
- 7.2.2. Aseptic
- 7.2.3. Retort
- 7.2.4. Hot Fill
- 7.3. Market Analysis, Insights and Forecast - by Product
- 7.3.1. Flat (Pillow & Side-Seal)
- 7.3.2. Stand-up
- 7.4. Market Analysis, Insights and Forecast - by End-User Industry
- 7.4.1. Food
- 7.4.1.1. Candy & Confectionery
- 7.4.1.2. Frozen Foods
- 7.4.1.3. Fresh Produce
- 7.4.1.4. Dairy Products
- 7.4.1.5. Dry Foods
- 7.4.1.6. Meat, Poultry, and Seafood
- 7.4.1.7. Pet Food
- 7.4.1.8. Other Fo
- 7.4.2. Medical and Pharmaceutical
- 7.4.3. Personal Care and Household Care
- 7.4.4. Other En
- 7.4.1. Food
- 7.1. Market Analysis, Insights and Forecast - by Material
- 8. South America MEA Pouch Packaging Market Analysis, Insights and Forecast, 2020-2032
- 8.1. Market Analysis, Insights and Forecast - by Material
- 8.1.1. Plastic
- 8.1.1.1. Polyethylene
- 8.1.1.2. Polypropylene
- 8.1.1.3. PET
- 8.1.1.4. PVC
- 8.1.1.5. EVOH
- 8.1.1.6. Other Resins
- 8.1.2. Paper
- 8.1.3. Aluminum
- 8.1.1. Plastic
- 8.2. Market Analysis, Insights and Forecast - by Type
- 8.2.1. Standard
- 8.2.2. Aseptic
- 8.2.3. Retort
- 8.2.4. Hot Fill
- 8.3. Market Analysis, Insights and Forecast - by Product
- 8.3.1. Flat (Pillow & Side-Seal)
- 8.3.2. Stand-up
- 8.4. Market Analysis, Insights and Forecast - by End-User Industry
- 8.4.1. Food
- 8.4.1.1. Candy & Confectionery
- 8.4.1.2. Frozen Foods
- 8.4.1.3. Fresh Produce
- 8.4.1.4. Dairy Products
- 8.4.1.5. Dry Foods
- 8.4.1.6. Meat, Poultry, and Seafood
- 8.4.1.7. Pet Food
- 8.4.1.8. Other Fo
- 8.4.2. Medical and Pharmaceutical
- 8.4.3. Personal Care and Household Care
- 8.4.4. Other En
- 8.4.1. Food
- 8.1. Market Analysis, Insights and Forecast - by Material
- 9. Europe MEA Pouch Packaging Market Analysis, Insights and Forecast, 2020-2032
- 9.1. Market Analysis, Insights and Forecast - by Material
- 9.1.1. Plastic
- 9.1.1.1. Polyethylene
- 9.1.1.2. Polypropylene
- 9.1.1.3. PET
- 9.1.1.4. PVC
- 9.1.1.5. EVOH
- 9.1.1.6. Other Resins
- 9.1.2. Paper
- 9.1.3. Aluminum
- 9.1.1. Plastic
- 9.2. Market Analysis, Insights and Forecast - by Type
- 9.2.1. Standard
- 9.2.2. Aseptic
- 9.2.3. Retort
- 9.2.4. Hot Fill
- 9.3. Market Analysis, Insights and Forecast - by Product
- 9.3.1. Flat (Pillow & Side-Seal)
- 9.3.2. Stand-up
- 9.4. Market Analysis, Insights and Forecast - by End-User Industry
- 9.4.1. Food
- 9.4.1.1. Candy & Confectionery
- 9.4.1.2. Frozen Foods
- 9.4.1.3. Fresh Produce
- 9.4.1.4. Dairy Products
- 9.4.1.5. Dry Foods
- 9.4.1.6. Meat, Poultry, and Seafood
- 9.4.1.7. Pet Food
- 9.4.1.8. Other Fo
- 9.4.2. Medical and Pharmaceutical
- 9.4.3. Personal Care and Household Care
- 9.4.4. Other En
- 9.4.1. Food
- 9.1. Market Analysis, Insights and Forecast - by Material
- 10. Middle East & Africa MEA Pouch Packaging Market Analysis, Insights and Forecast, 2020-2032
- 10.1. Market Analysis, Insights and Forecast - by Material
- 10.1.1. Plastic
- 10.1.1.1. Polyethylene
- 10.1.1.2. Polypropylene
- 10.1.1.3. PET
- 10.1.1.4. PVC
- 10.1.1.5. EVOH
- 10.1.1.6. Other Resins
- 10.1.2. Paper
- 10.1.3. Aluminum
- 10.1.1. Plastic
- 10.2. Market Analysis, Insights and Forecast - by Type
- 10.2.1. Standard
- 10.2.2. Aseptic
- 10.2.3. Retort
- 10.2.4. Hot Fill
- 10.3. Market Analysis, Insights and Forecast - by Product
- 10.3.1. Flat (Pillow & Side-Seal)
- 10.3.2. Stand-up
- 10.4. Market Analysis, Insights and Forecast - by End-User Industry
- 10.4.1. Food
- 10.4.1.1. Candy & Confectionery
- 10.4.1.2. Frozen Foods
- 10.4.1.3. Fresh Produce
- 10.4.1.4. Dairy Products
- 10.4.1.5. Dry Foods
- 10.4.1.6. Meat, Poultry, and Seafood
- 10.4.1.7. Pet Food
- 10.4.1.8. Other Fo
- 10.4.2. Medical and Pharmaceutical
- 10.4.3. Personal Care and Household Care
- 10.4.4. Other En
- 10.4.1. Food
- 10.1. Market Analysis, Insights and Forecast - by Material
- 11. Asia Pacific MEA Pouch Packaging Market Analysis, Insights and Forecast, 2020-2032
- 11.1. Market Analysis, Insights and Forecast - by Material
- 11.1.1. Plastic
- 11.1.1.1. Polyethylene
- 11.1.1.2. Polypropylene
- 11.1.1.3. PET
- 11.1.1.4. PVC
- 11.1.1.5. EVOH
- 11.1.1.6. Other Resins
- 11.1.2. Paper
- 11.1.3. Aluminum
- 11.1.1. Plastic
- 11.2. Market Analysis, Insights and Forecast - by Type
- 11.2.1. Standard
- 11.2.2. Aseptic
- 11.2.3. Retort
- 11.2.4. Hot Fill
- 11.3. Market Analysis, Insights and Forecast - by Product
- 11.3.1. Flat (Pillow & Side-Seal)
- 11.3.2. Stand-up
- 11.4. Market Analysis, Insights and Forecast - by End-User Industry
- 11.4.1. Food
- 11.4.1.1. Candy & Confectionery
- 11.4.1.2. Frozen Foods
- 11.4.1.3. Fresh Produce
- 11.4.1.4. Dairy Products
- 11.4.1.5. Dry Foods
- 11.4.1.6. Meat, Poultry, and Seafood
- 11.4.1.7. Pet Food
- 11.4.1.8. Other Fo
- 11.4.2. Medical and Pharmaceutical
- 11.4.3. Personal Care and Household Care
- 11.4.4. Other En
- 11.4.1. Food
- 11.1. Market Analysis, Insights and Forecast - by Material
- 12. Competitive Analysis
- 12.1. Company Profiles
- 12.1.1 Amcor Group GmbH
- 12.1.1.1. Company Overview
- 12.1.1.2. Products
- 12.1.1.3. Company Financials
- 12.1.1.4. SWOT Analysis
- 12.1.2 Mondi Group
- 12.1.2.1. Company Overview
- 12.1.2.2. Products
- 12.1.2.3. Company Financials
- 12.1.2.4. SWOT Analysis
- 12.1.3 Constantia Flexibles Group GmbH
- 12.1.3.1. Company Overview
- 12.1.3.2. Products
- 12.1.3.3. Company Financials
- 12.1.3.4. SWOT Analysis
- 12.1.4 Coveris Management GmbH
- 12.1.4.1. Company Overview
- 12.1.4.2. Products
- 12.1.4.3. Company Financials
- 12.1.4.4. SWOT Analysis
- 12.1.5 Sealed Air Corporation (SEE)
- 12.1.5.1. Company Overview
- 12.1.5.2. Products
- 12.1.5.3. Company Financials
- 12.1.5.4. SWOT Analysis
- 12.1.6 Huhtamaki Oyj
- 12.1.6.1. Company Overview
- 12.1.6.2. Products
- 12.1.6.3. Company Financials
- 12.1.6.4. SWOT Analysis
- 12.1.7 Uflex Ltd
- 12.1.7.1. Company Overview
- 12.1.7.2. Products
- 12.1.7.3. Company Financials
- 12.1.7.4. SWOT Analysis
- 12.1.8 Napco National
- 12.1.8.1. Company Overview
- 12.1.8.2. Products
- 12.1.8.3. Company Financials
- 12.1.8.4. SWOT Analysis
- 12.1.9 Foster International Packaging
- 12.1.9.1. Company Overview
- 12.1.9.2. Products
- 12.1.9.3. Company Financials
- 12.1.9.4. SWOT Analysis
- 12.1.10 Emirates Printing Press (LLC
- 12.1.10.1. Company Overview
- 12.1.10.2. Products
- 12.1.10.3. Company Financials
- 12.1.10.4. SWOT Analysis
- 12.1.1 Amcor Group GmbH
- 12.2. Market Entropy
- 12.2.1 Company's Key Areas Served
- 12.2.2 Recent Developments
- 12.3. Company Market Share Analysis 2025
- 12.3.1 Top 5 Companies Market Share Analysis
- 12.3.2 Top 3 Companies Market Share Analysis
- 12.4. List of Potential Customers
- 13. Research Methodology
List of Figures
- Figure 1: Global MEA Pouch Packaging Market Revenue Breakdown (Million, %) by Region 2025 & 2033
- Figure 2: Global MEA Pouch Packaging Market Volume Breakdown (Billion, %) by Region 2025 & 2033
- Figure 3: North America MEA Pouch Packaging Market Revenue (Million), by Material 2025 & 2033
- Figure 4: North America MEA Pouch Packaging Market Volume (Billion), by Material 2025 & 2033
- Figure 5: North America MEA Pouch Packaging Market Revenue Share (%), by Material 2025 & 2033
- Figure 6: North America MEA Pouch Packaging Market Volume Share (%), by Material 2025 & 2033
- Figure 7: North America MEA Pouch Packaging Market Revenue (Million), by Type 2025 & 2033
- Figure 8: North America MEA Pouch Packaging Market Volume (Billion), by Type 2025 & 2033
- Figure 9: North America MEA Pouch Packaging Market Revenue Share (%), by Type 2025 & 2033
- Figure 10: North America MEA Pouch Packaging Market Volume Share (%), by Type 2025 & 2033
- Figure 11: North America MEA Pouch Packaging Market Revenue (Million), by Product 2025 & 2033
- Figure 12: North America MEA Pouch Packaging Market Volume (Billion), by Product 2025 & 2033
- Figure 13: North America MEA Pouch Packaging Market Revenue Share (%), by Product 2025 & 2033
- Figure 14: North America MEA Pouch Packaging Market Volume Share (%), by Product 2025 & 2033
- Figure 15: North America MEA Pouch Packaging Market Revenue (Million), by End-User Industry 2025 & 2033
- Figure 16: North America MEA Pouch Packaging Market Volume (Billion), by End-User Industry 2025 & 2033
- Figure 17: North America MEA Pouch Packaging Market Revenue Share (%), by End-User Industry 2025 & 2033
- Figure 18: North America MEA Pouch Packaging Market Volume Share (%), by End-User Industry 2025 & 2033
- Figure 19: North America MEA Pouch Packaging Market Revenue (Million), by Country 2025 & 2033
- Figure 20: North America MEA Pouch Packaging Market Volume (Billion), by Country 2025 & 2033
- Figure 21: North America MEA Pouch Packaging Market Revenue Share (%), by Country 2025 & 2033
- Figure 22: North America MEA Pouch Packaging Market Volume Share (%), by Country 2025 & 2033
- Figure 23: South America MEA Pouch Packaging Market Revenue (Million), by Material 2025 & 2033
- Figure 24: South America MEA Pouch Packaging Market Volume (Billion), by Material 2025 & 2033
- Figure 25: South America MEA Pouch Packaging Market Revenue Share (%), by Material 2025 & 2033
- Figure 26: South America MEA Pouch Packaging Market Volume Share (%), by Material 2025 & 2033
- Figure 27: South America MEA Pouch Packaging Market Revenue (Million), by Type 2025 & 2033
- Figure 28: South America MEA Pouch Packaging Market Volume (Billion), by Type 2025 & 2033
- Figure 29: South America MEA Pouch Packaging Market Revenue Share (%), by Type 2025 & 2033
- Figure 30: South America MEA Pouch Packaging Market Volume Share (%), by Type 2025 & 2033
- Figure 31: South America MEA Pouch Packaging Market Revenue (Million), by Product 2025 & 2033
- Figure 32: South America MEA Pouch Packaging Market Volume (Billion), by Product 2025 & 2033
- Figure 33: South America MEA Pouch Packaging Market Revenue Share (%), by Product 2025 & 2033
- Figure 34: South America MEA Pouch Packaging Market Volume Share (%), by Product 2025 & 2033
- Figure 35: South America MEA Pouch Packaging Market Revenue (Million), by End-User Industry 2025 & 2033
- Figure 36: South America MEA Pouch Packaging Market Volume (Billion), by End-User Industry 2025 & 2033
- Figure 37: South America MEA Pouch Packaging Market Revenue Share (%), by End-User Industry 2025 & 2033
- Figure 38: South America MEA Pouch Packaging Market Volume Share (%), by End-User Industry 2025 & 2033
- Figure 39: South America MEA Pouch Packaging Market Revenue (Million), by Country 2025 & 2033
- Figure 40: South America MEA Pouch Packaging Market Volume (Billion), by Country 2025 & 2033
- Figure 41: South America MEA Pouch Packaging Market Revenue Share (%), by Country 2025 & 2033
- Figure 42: South America MEA Pouch Packaging Market Volume Share (%), by Country 2025 & 2033
- Figure 43: Europe MEA Pouch Packaging Market Revenue (Million), by Material 2025 & 2033
- Figure 44: Europe MEA Pouch Packaging Market Volume (Billion), by Material 2025 & 2033
- Figure 45: Europe MEA Pouch Packaging Market Revenue Share (%), by Material 2025 & 2033
- Figure 46: Europe MEA Pouch Packaging Market Volume Share (%), by Material 2025 & 2033
- Figure 47: Europe MEA Pouch Packaging Market Revenue (Million), by Type 2025 & 2033
- Figure 48: Europe MEA Pouch Packaging Market Volume (Billion), by Type 2025 & 2033
- Figure 49: Europe MEA Pouch Packaging Market Revenue Share (%), by Type 2025 & 2033
- Figure 50: Europe MEA Pouch Packaging Market Volume Share (%), by Type 2025 & 2033
- Figure 51: Europe MEA Pouch Packaging Market Revenue (Million), by Product 2025 & 2033
- Figure 52: Europe MEA Pouch Packaging Market Volume (Billion), by Product 2025 & 2033
- Figure 53: Europe MEA Pouch Packaging Market Revenue Share (%), by Product 2025 & 2033
- Figure 54: Europe MEA Pouch Packaging Market Volume Share (%), by Product 2025 & 2033
- Figure 55: Europe MEA Pouch Packaging Market Revenue (Million), by End-User Industry 2025 & 2033
- Figure 56: Europe MEA Pouch Packaging Market Volume (Billion), by End-User Industry 2025 & 2033
- Figure 57: Europe MEA Pouch Packaging Market Revenue Share (%), by End-User Industry 2025 & 2033
- Figure 58: Europe MEA Pouch Packaging Market Volume Share (%), by End-User Industry 2025 & 2033
- Figure 59: Europe MEA Pouch Packaging Market Revenue (Million), by Country 2025 & 2033
- Figure 60: Europe MEA Pouch Packaging Market Volume (Billion), by Country 2025 & 2033
- Figure 61: Europe MEA Pouch Packaging Market Revenue Share (%), by Country 2025 & 2033
- Figure 62: Europe MEA Pouch Packaging Market Volume Share (%), by Country 2025 & 2033
- Figure 63: Middle East & Africa MEA Pouch Packaging Market Revenue (Million), by Material 2025 & 2033
- Figure 64: Middle East & Africa MEA Pouch Packaging Market Volume (Billion), by Material 2025 & 2033
- Figure 65: Middle East & Africa MEA Pouch Packaging Market Revenue Share (%), by Material 2025 & 2033
- Figure 66: Middle East & Africa MEA Pouch Packaging Market Volume Share (%), by Material 2025 & 2033
- Figure 67: Middle East & Africa MEA Pouch Packaging Market Revenue (Million), by Type 2025 & 2033
- Figure 68: Middle East & Africa MEA Pouch Packaging Market Volume (Billion), by Type 2025 & 2033
- Figure 69: Middle East & Africa MEA Pouch Packaging Market Revenue Share (%), by Type 2025 & 2033
- Figure 70: Middle East & Africa MEA Pouch Packaging Market Volume Share (%), by Type 2025 & 2033
- Figure 71: Middle East & Africa MEA Pouch Packaging Market Revenue (Million), by Product 2025 & 2033
- Figure 72: Middle East & Africa MEA Pouch Packaging Market Volume (Billion), by Product 2025 & 2033
- Figure 73: Middle East & Africa MEA Pouch Packaging Market Revenue Share (%), by Product 2025 & 2033
- Figure 74: Middle East & Africa MEA Pouch Packaging Market Volume Share (%), by Product 2025 & 2033
- Figure 75: Middle East & Africa MEA Pouch Packaging Market Revenue (Million), by End-User Industry 2025 & 2033
- Figure 76: Middle East & Africa MEA Pouch Packaging Market Volume (Billion), by End-User Industry 2025 & 2033
- Figure 77: Middle East & Africa MEA Pouch Packaging Market Revenue Share (%), by End-User Industry 2025 & 2033
- Figure 78: Middle East & Africa MEA Pouch Packaging Market Volume Share (%), by End-User Industry 2025 & 2033
- Figure 79: Middle East & Africa MEA Pouch Packaging Market Revenue (Million), by Country 2025 & 2033
- Figure 80: Middle East & Africa MEA Pouch Packaging Market Volume (Billion), by Country 2025 & 2033
- Figure 81: Middle East & Africa MEA Pouch Packaging Market Revenue Share (%), by Country 2025 & 2033
- Figure 82: Middle East & Africa MEA Pouch Packaging Market Volume Share (%), by Country 2025 & 2033
- Figure 83: Asia Pacific MEA Pouch Packaging Market Revenue (Million), by Material 2025 & 2033
- Figure 84: Asia Pacific MEA Pouch Packaging Market Volume (Billion), by Material 2025 & 2033
- Figure 85: Asia Pacific MEA Pouch Packaging Market Revenue Share (%), by Material 2025 & 2033
- Figure 86: Asia Pacific MEA Pouch Packaging Market Volume Share (%), by Material 2025 & 2033
- Figure 87: Asia Pacific MEA Pouch Packaging Market Revenue (Million), by Type 2025 & 2033
- Figure 88: Asia Pacific MEA Pouch Packaging Market Volume (Billion), by Type 2025 & 2033
- Figure 89: Asia Pacific MEA Pouch Packaging Market Revenue Share (%), by Type 2025 & 2033
- Figure 90: Asia Pacific MEA Pouch Packaging Market Volume Share (%), by Type 2025 & 2033
- Figure 91: Asia Pacific MEA Pouch Packaging Market Revenue (Million), by Product 2025 & 2033
- Figure 92: Asia Pacific MEA Pouch Packaging Market Volume (Billion), by Product 2025 & 2033
- Figure 93: Asia Pacific MEA Pouch Packaging Market Revenue Share (%), by Product 2025 & 2033
- Figure 94: Asia Pacific MEA Pouch Packaging Market Volume Share (%), by Product 2025 & 2033
- Figure 95: Asia Pacific MEA Pouch Packaging Market Revenue (Million), by End-User Industry 2025 & 2033
- Figure 96: Asia Pacific MEA Pouch Packaging Market Volume (Billion), by End-User Industry 2025 & 2033
- Figure 97: Asia Pacific MEA Pouch Packaging Market Revenue Share (%), by End-User Industry 2025 & 2033
- Figure 98: Asia Pacific MEA Pouch Packaging Market Volume Share (%), by End-User Industry 2025 & 2033
- Figure 99: Asia Pacific MEA Pouch Packaging Market Revenue (Million), by Country 2025 & 2033
- Figure 100: Asia Pacific MEA Pouch Packaging Market Volume (Billion), by Country 2025 & 2033
- Figure 101: Asia Pacific MEA Pouch Packaging Market Revenue Share (%), by Country 2025 & 2033
- Figure 102: Asia Pacific MEA Pouch Packaging Market Volume Share (%), by Country 2025 & 2033
List of Tables
- Table 1: Global MEA Pouch Packaging Market Revenue Million Forecast, by Material 2020 & 2033
- Table 2: Global MEA Pouch Packaging Market Volume Billion Forecast, by Material 2020 & 2033
- Table 3: Global MEA Pouch Packaging Market Revenue Million Forecast, by Type 2020 & 2033
- Table 4: Global MEA Pouch Packaging Market Volume Billion Forecast, by Type 2020 & 2033
- Table 5: Global MEA Pouch Packaging Market Revenue Million Forecast, by Product 2020 & 2033
- Table 6: Global MEA Pouch Packaging Market Volume Billion Forecast, by Product 2020 & 2033
- Table 7: Global MEA Pouch Packaging Market Revenue Million Forecast, by End-User Industry 2020 & 2033
- Table 8: Global MEA Pouch Packaging Market Volume Billion Forecast, by End-User Industry 2020 & 2033
- Table 9: Global MEA Pouch Packaging Market Revenue Million Forecast, by Region 2020 & 2033
- Table 10: Global MEA Pouch Packaging Market Volume Billion Forecast, by Region 2020 & 2033
- Table 11: Global MEA Pouch Packaging Market Revenue Million Forecast, by Material 2020 & 2033
- Table 12: Global MEA Pouch Packaging Market Volume Billion Forecast, by Material 2020 & 2033
- Table 13: Global MEA Pouch Packaging Market Revenue Million Forecast, by Type 2020 & 2033
- Table 14: Global MEA Pouch Packaging Market Volume Billion Forecast, by Type 2020 & 2033
- Table 15: Global MEA Pouch Packaging Market Revenue Million Forecast, by Product 2020 & 2033
- Table 16: Global MEA Pouch Packaging Market Volume Billion Forecast, by Product 2020 & 2033
- Table 17: Global MEA Pouch Packaging Market Revenue Million Forecast, by End-User Industry 2020 & 2033
- Table 18: Global MEA Pouch Packaging Market Volume Billion Forecast, by End-User Industry 2020 & 2033
- Table 19: Global MEA Pouch Packaging Market Revenue Million Forecast, by Country 2020 & 2033
- Table 20: Global MEA Pouch Packaging Market Volume Billion Forecast, by Country 2020 & 2033
- Table 21: United States MEA Pouch Packaging Market Revenue (Million) Forecast, by Application 2020 & 2033
- Table 22: United States MEA Pouch Packaging Market Volume (Billion) Forecast, by Application 2020 & 2033
- Table 23: Canada MEA Pouch Packaging Market Revenue (Million) Forecast, by Application 2020 & 2033
- Table 24: Canada MEA Pouch Packaging Market Volume (Billion) Forecast, by Application 2020 & 2033
- Table 25: Mexico MEA Pouch Packaging Market Revenue (Million) Forecast, by Application 2020 & 2033
- Table 26: Mexico MEA Pouch Packaging Market Volume (Billion) Forecast, by Application 2020 & 2033
- Table 27: Global MEA Pouch Packaging Market Revenue Million Forecast, by Material 2020 & 2033
- Table 28: Global MEA Pouch Packaging Market Volume Billion Forecast, by Material 2020 & 2033
- Table 29: Global MEA Pouch Packaging Market Revenue Million Forecast, by Type 2020 & 2033
- Table 30: Global MEA Pouch Packaging Market Volume Billion Forecast, by Type 2020 & 2033
- Table 31: Global MEA Pouch Packaging Market Revenue Million Forecast, by Product 2020 & 2033
- Table 32: Global MEA Pouch Packaging Market Volume Billion Forecast, by Product 2020 & 2033
- Table 33: Global MEA Pouch Packaging Market Revenue Million Forecast, by End-User Industry 2020 & 2033
- Table 34: Global MEA Pouch Packaging Market Volume Billion Forecast, by End-User Industry 2020 & 2033
- Table 35: Global MEA Pouch Packaging Market Revenue Million Forecast, by Country 2020 & 2033
- Table 36: Global MEA Pouch Packaging Market Volume Billion Forecast, by Country 2020 & 2033
- Table 37: Brazil MEA Pouch Packaging Market Revenue (Million) Forecast, by Application 2020 & 2033
- Table 38: Brazil MEA Pouch Packaging Market Volume (Billion) Forecast, by Application 2020 & 2033
- Table 39: Argentina MEA Pouch Packaging Market Revenue (Million) Forecast, by Application 2020 & 2033
- Table 40: Argentina MEA Pouch Packaging Market Volume (Billion) Forecast, by Application 2020 & 2033
- Table 41: Rest of South America MEA Pouch Packaging Market Revenue (Million) Forecast, by Application 2020 & 2033
- Table 42: Rest of South America MEA Pouch Packaging Market Volume (Billion) Forecast, by Application 2020 & 2033
- Table 43: Global MEA Pouch Packaging Market Revenue Million Forecast, by Material 2020 & 2033
- Table 44: Global MEA Pouch Packaging Market Volume Billion Forecast, by Material 2020 & 2033
- Table 45: Global MEA Pouch Packaging Market Revenue Million Forecast, by Type 2020 & 2033
- Table 46: Global MEA Pouch Packaging Market Volume Billion Forecast, by Type 2020 & 2033
- Table 47: Global MEA Pouch Packaging Market Revenue Million Forecast, by Product 2020 & 2033
- Table 48: Global MEA Pouch Packaging Market Volume Billion Forecast, by Product 2020 & 2033
- Table 49: Global MEA Pouch Packaging Market Revenue Million Forecast, by End-User Industry 2020 & 2033
- Table 50: Global MEA Pouch Packaging Market Volume Billion Forecast, by End-User Industry 2020 & 2033
- Table 51: Global MEA Pouch Packaging Market Revenue Million Forecast, by Country 2020 & 2033
- Table 52: Global MEA Pouch Packaging Market Volume Billion Forecast, by Country 2020 & 2033
- Table 53: United Kingdom MEA Pouch Packaging Market Revenue (Million) Forecast, by Application 2020 & 2033
- Table 54: United Kingdom MEA Pouch Packaging Market Volume (Billion) Forecast, by Application 2020 & 2033
- Table 55: Germany MEA Pouch Packaging Market Revenue (Million) Forecast, by Application 2020 & 2033
- Table 56: Germany MEA Pouch Packaging Market Volume (Billion) Forecast, by Application 2020 & 2033
- Table 57: France MEA Pouch Packaging Market Revenue (Million) Forecast, by Application 2020 & 2033
- Table 58: France MEA Pouch Packaging Market Volume (Billion) Forecast, by Application 2020 & 2033
- Table 59: Italy MEA Pouch Packaging Market Revenue (Million) Forecast, by Application 2020 & 2033
- Table 60: Italy MEA Pouch Packaging Market Volume (Billion) Forecast, by Application 2020 & 2033
- Table 61: Spain MEA Pouch Packaging Market Revenue (Million) Forecast, by Application 2020 & 2033
- Table 62: Spain MEA Pouch Packaging Market Volume (Billion) Forecast, by Application 2020 & 2033
- Table 63: Russia MEA Pouch Packaging Market Revenue (Million) Forecast, by Application 2020 & 2033
- Table 64: Russia MEA Pouch Packaging Market Volume (Billion) Forecast, by Application 2020 & 2033
- Table 65: Benelux MEA Pouch Packaging Market Revenue (Million) Forecast, by Application 2020 & 2033
- Table 66: Benelux MEA Pouch Packaging Market Volume (Billion) Forecast, by Application 2020 & 2033
- Table 67: Nordics MEA Pouch Packaging Market Revenue (Million) Forecast, by Application 2020 & 2033
- Table 68: Nordics MEA Pouch Packaging Market Volume (Billion) Forecast, by Application 2020 & 2033
- Table 69: Rest of Europe MEA Pouch Packaging Market Revenue (Million) Forecast, by Application 2020 & 2033
- Table 70: Rest of Europe MEA Pouch Packaging Market Volume (Billion) Forecast, by Application 2020 & 2033
- Table 71: Global MEA Pouch Packaging Market Revenue Million Forecast, by Material 2020 & 2033
- Table 72: Global MEA Pouch Packaging Market Volume Billion Forecast, by Material 2020 & 2033
- Table 73: Global MEA Pouch Packaging Market Revenue Million Forecast, by Type 2020 & 2033
- Table 74: Global MEA Pouch Packaging Market Volume Billion Forecast, by Type 2020 & 2033
- Table 75: Global MEA Pouch Packaging Market Revenue Million Forecast, by Product 2020 & 2033
- Table 76: Global MEA Pouch Packaging Market Volume Billion Forecast, by Product 2020 & 2033
- Table 77: Global MEA Pouch Packaging Market Revenue Million Forecast, by End-User Industry 2020 & 2033
- Table 78: Global MEA Pouch Packaging Market Volume Billion Forecast, by End-User Industry 2020 & 2033
- Table 79: Global MEA Pouch Packaging Market Revenue Million Forecast, by Country 2020 & 2033
- Table 80: Global MEA Pouch Packaging Market Volume Billion Forecast, by Country 2020 & 2033
- Table 81: Turkey MEA Pouch Packaging Market Revenue (Million) Forecast, by Application 2020 & 2033
- Table 82: Turkey MEA Pouch Packaging Market Volume (Billion) Forecast, by Application 2020 & 2033
- Table 83: Israel MEA Pouch Packaging Market Revenue (Million) Forecast, by Application 2020 & 2033
- Table 84: Israel MEA Pouch Packaging Market Volume (Billion) Forecast, by Application 2020 & 2033
- Table 85: GCC MEA Pouch Packaging Market Revenue (Million) Forecast, by Application 2020 & 2033
- Table 86: GCC MEA Pouch Packaging Market Volume (Billion) Forecast, by Application 2020 & 2033
- Table 87: North Africa MEA Pouch Packaging Market Revenue (Million) Forecast, by Application 2020 & 2033
- Table 88: North Africa MEA Pouch Packaging Market Volume (Billion) Forecast, by Application 2020 & 2033
- Table 89: South Africa MEA Pouch Packaging Market Revenue (Million) Forecast, by Application 2020 & 2033
- Table 90: South Africa MEA Pouch Packaging Market Volume (Billion) Forecast, by Application 2020 & 2033
- Table 91: Rest of Middle East & Africa MEA Pouch Packaging Market Revenue (Million) Forecast, by Application 2020 & 2033
- Table 92: Rest of Middle East & Africa MEA Pouch Packaging Market Volume (Billion) Forecast, by Application 2020 & 2033
- Table 93: Global MEA Pouch Packaging Market Revenue Million Forecast, by Material 2020 & 2033
- Table 94: Global MEA Pouch Packaging Market Volume Billion Forecast, by Material 2020 & 2033
- Table 95: Global MEA Pouch Packaging Market Revenue Million Forecast, by Type 2020 & 2033
- Table 96: Global MEA Pouch Packaging Market Volume Billion Forecast, by Type 2020 & 2033
- Table 97: Global MEA Pouch Packaging Market Revenue Million Forecast, by Product 2020 & 2033
- Table 98: Global MEA Pouch Packaging Market Volume Billion Forecast, by Product 2020 & 2033
- Table 99: Global MEA Pouch Packaging Market Revenue Million Forecast, by End-User Industry 2020 & 2033
- Table 100: Global MEA Pouch Packaging Market Volume Billion Forecast, by End-User Industry 2020 & 2033
- Table 101: Global MEA Pouch Packaging Market Revenue Million Forecast, by Country 2020 & 2033
- Table 102: Global MEA Pouch Packaging Market Volume Billion Forecast, by Country 2020 & 2033
- Table 103: China MEA Pouch Packaging Market Revenue (Million) Forecast, by Application 2020 & 2033
- Table 104: China MEA Pouch Packaging Market Volume (Billion) Forecast, by Application 2020 & 2033
- Table 105: India MEA Pouch Packaging Market Revenue (Million) Forecast, by Application 2020 & 2033
- Table 106: India MEA Pouch Packaging Market Volume (Billion) Forecast, by Application 2020 & 2033
- Table 107: Japan MEA Pouch Packaging Market Revenue (Million) Forecast, by Application 2020 & 2033
- Table 108: Japan MEA Pouch Packaging Market Volume (Billion) Forecast, by Application 2020 & 2033
- Table 109: South Korea MEA Pouch Packaging Market Revenue (Million) Forecast, by Application 2020 & 2033
- Table 110: South Korea MEA Pouch Packaging Market Volume (Billion) Forecast, by Application 2020 & 2033
- Table 111: ASEAN MEA Pouch Packaging Market Revenue (Million) Forecast, by Application 2020 & 2033
- Table 112: ASEAN MEA Pouch Packaging Market Volume (Billion) Forecast, by Application 2020 & 2033
- Table 113: Oceania MEA Pouch Packaging Market Revenue (Million) Forecast, by Application 2020 & 2033
- Table 114: Oceania MEA Pouch Packaging Market Volume (Billion) Forecast, by Application 2020 & 2033
- Table 115: Rest of Asia Pacific MEA Pouch Packaging Market Revenue (Million) Forecast, by Application 2020 & 2033
- Table 116: Rest of Asia Pacific MEA Pouch Packaging Market Volume (Billion) Forecast, by Application 2020 & 2033
Frequently Asked Questions
1. What is the projected Compound Annual Growth Rate (CAGR) of the MEA Pouch Packaging Market?
The projected CAGR is approximately 5.59%.
2. Which companies are prominent players in the MEA Pouch Packaging Market?
Key companies in the market include Amcor Group GmbH, Mondi Group, Constantia Flexibles Group GmbH, Coveris Management GmbH, Sealed Air Corporation (SEE), Huhtamaki Oyj, Uflex Ltd, Napco National, Foster International Packaging, Emirates Printing Press (LLC.
3. What are the main segments of the MEA Pouch Packaging Market?
The market segments include Material, Type, Product, End-User Industry.
4. Can you provide details about the market size?
The market size is estimated to be USD 2.03 Million as of 2022.
5. What are some drivers contributing to market growth?
Increasing Demand for Convenient. Ready-to-Eat Food Products; Increasing Demand for Lightweight Packaging Solution.
6. What are the notable trends driving market growth?
Aseptic Pouch Packaging Set to Witness the Fastest Growth.
7. Are there any restraints impacting market growth?
Increasing Demand for Convenient. Ready-to-Eat Food Products; Increasing Demand for Lightweight Packaging Solution.
8. Can you provide examples of recent developments in the market?
March 2024: Ishida Europe increased its footprint in Africa with the acquisition of South African packaging equipment manufacturer National Packaging Systems (NPS). NPS designs and manufactures vertical form, fill, and seal machines for sachets, stick packs, and pillow packs, as well as volumetric fillers, auger fillers, and feed systems. In addition to helping businesses increase levels of automation further, the new Ishida/NPS partnership should offer start-up operations the opportunity to take their first steps in automating their processes with the availability of high-quality and cost-effective entry-level weighing and packing systems.
9. What pricing options are available for accessing the report?
Pricing options include single-user, multi-user, and enterprise licenses priced at USD 4750, USD 4950, and USD 6800 respectively.
10. Is the market size provided in terms of value or volume?
The market size is provided in terms of value, measured in Million and volume, measured in Billion.
11. Are there any specific market keywords associated with the report?
Yes, the market keyword associated with the report is "MEA Pouch Packaging Market," which aids in identifying and referencing the specific market segment covered.
12. How do I determine which pricing option suits my needs best?
The pricing options vary based on user requirements and access needs. Individual users may opt for single-user licenses, while businesses requiring broader access may choose multi-user or enterprise licenses for cost-effective access to the report.
13. Are there any additional resources or data provided in the MEA Pouch Packaging Market report?
While the report offers comprehensive insights, it's advisable to review the specific contents or supplementary materials provided to ascertain if additional resources or data are available.
14. How can I stay updated on further developments or reports in the MEA Pouch Packaging Market?
To stay informed about further developments, trends, and reports in the MEA Pouch Packaging Market, consider subscribing to industry newsletters, following relevant companies and organizations, or regularly checking reputable industry news sources and publications.
Methodology
Step 1 - Identification of Relevant Samples Size from Population Database


Step 2 - Approaches for Defining Global Market Size (Value, Volume* & Price*)

Note*: In applicable scenarios
Step 3 - Data Sources
Primary Research
- Web Analytics
- Survey Reports
- Research Institute
- Latest Research Reports
- Opinion Leaders
Secondary Research
- Annual Reports
- White Paper
- Latest Press Release
- Industry Association
- Paid Database
- Investor Presentations

Step 4 - Data Triangulation
Involves using different sources of information in order to increase the validity of a study
These sources are likely to be stakeholders in a program - participants, other researchers, program staff, other community members, and so on.
Then we put all data in single framework & apply various statistical tools to find out the dynamic on the market.
During the analysis stage, feedback from the stakeholder groups would be compared to determine areas of agreement as well as areas of divergence

