
Key Insights
The Middle East and Africa (MEA) specialty food ingredients market is experiencing steady growth, driven by several key factors. The rising demand for convenience foods, processed foods, and healthier food options is fueling the adoption of specialty ingredients like sweeteners, flavors, and emulsifiers across various applications. The burgeoning food and beverage industry in the region, particularly in countries like Saudi Arabia and South Africa, is a significant contributor to market expansion. Furthermore, the increasing disposable incomes and changing consumer lifestyles are leading to higher consumption of value-added food products, boosting the demand for these ingredients. A shift towards healthier and more natural food options is also evident, creating opportunities for manufacturers offering clean-label and functional ingredients. However, fluctuating raw material prices and stringent regulatory frameworks pose challenges to market growth.
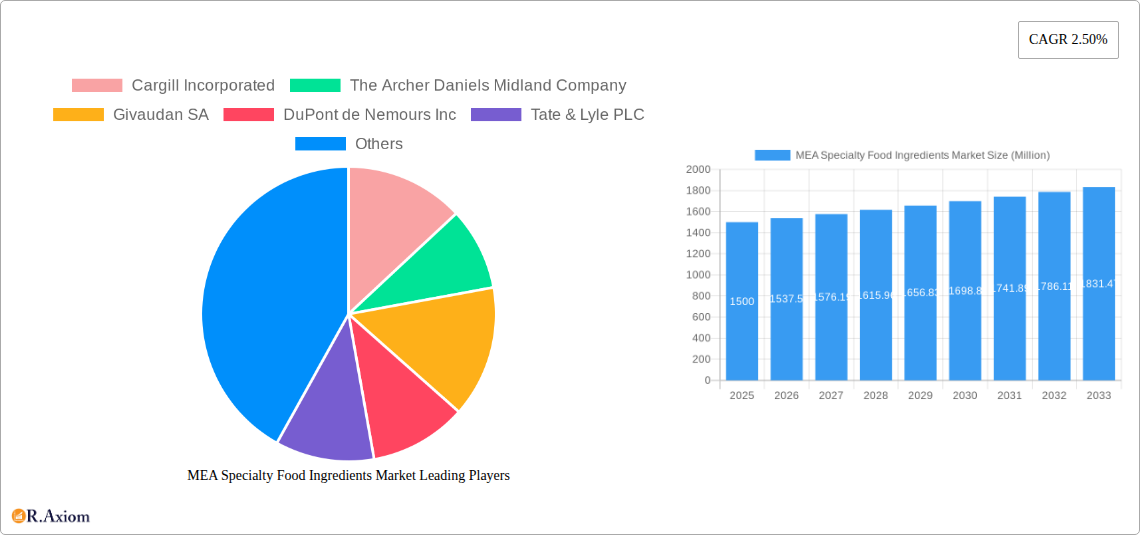
Despite these challenges, the market is projected to maintain a positive trajectory, driven by the continued growth of the food processing and beverage sectors. The regional market is segmented by ingredient type (sweeteners & starch, flavors & colorants, etc.) and application (bakery & confectionery, beverages, etc.), with each segment exhibiting unique growth patterns. Major players like Cargill, ADM, and Givaudan are investing significantly in research and development to introduce innovative products catering to specific regional preferences and dietary needs. This competitive landscape fosters innovation and drives the overall market development. While precise figures are not available for all segments and countries, the overall market shows consistent, albeit moderate, growth potential based on established industry trends and the projected CAGR of 2.50%. This growth is expected to continue throughout the forecast period (2025-2033), presenting attractive opportunities for market participants.
MEA Specialty Food Ingredients Market: A Comprehensive Report (2019-2033)
This detailed report provides a comprehensive analysis of the Middle East and Africa (MEA) specialty food ingredients market, offering invaluable insights for industry stakeholders, investors, and strategic decision-makers. The study period spans from 2019 to 2033, with 2025 serving as the base and estimated year. The forecast period covers 2025-2033, while the historical period encompasses 2019-2024. The report meticulously examines market dynamics, growth drivers, challenges, and opportunities, providing granular segmentation across type, application, and country. Key players such as Cargill Incorporated, The Archer Daniels Midland Company, Givaudan SA, DuPont de Nemours Inc, Tate & Lyle PLC, BASF SE, Koninklijke DSM N V, Kerry Group, Sensient Technologies Corporation, and Ingredion Incorporated are profiled, showcasing their strategies and market positions.
MEA Specialty Food Ingredients Market Concentration & Innovation
The MEA specialty food ingredients market exhibits a moderately concentrated landscape, with a few multinational corporations holding significant market share. However, the presence of several regional players and emerging startups introduces competitive dynamism. Market share analysis reveals that the top five players collectively hold approximately xx% of the market (2025 estimate), indicating room for both expansion and disruption. Innovation is driven by increasing consumer demand for healthier, functional, and convenient food products. The regulatory environment, while varying across countries, generally prioritizes food safety and labeling standards. Key product substitutes include naturally sourced ingredients and locally produced alternatives, posing challenges and opportunities for established players. End-user trends indicate a growing preference for natural colors, flavors, and preservatives, driving innovation in this area. M&A activities have significantly shaped the market landscape. Recent deals, while not publicly disclosing exact values, suggest a trend towards consolidation and diversification among leading players. For example, the DuPont and IFF merger in 2021 created a major force in the industry. Furthermore, the ongoing investment in R&D across the region is indicative of strong future growth potential.
- Market Concentration: Top 5 players hold approximately xx% market share (2025).
- Innovation Drivers: Consumer demand for healthier, functional foods; regulatory pressures; technological advancements.
- M&A Activity: Significant consolidation through mergers and acquisitions, with xx Million to xx Million in deal values (estimated for recent years).
MEA Specialty Food Ingredients Market Industry Trends & Insights
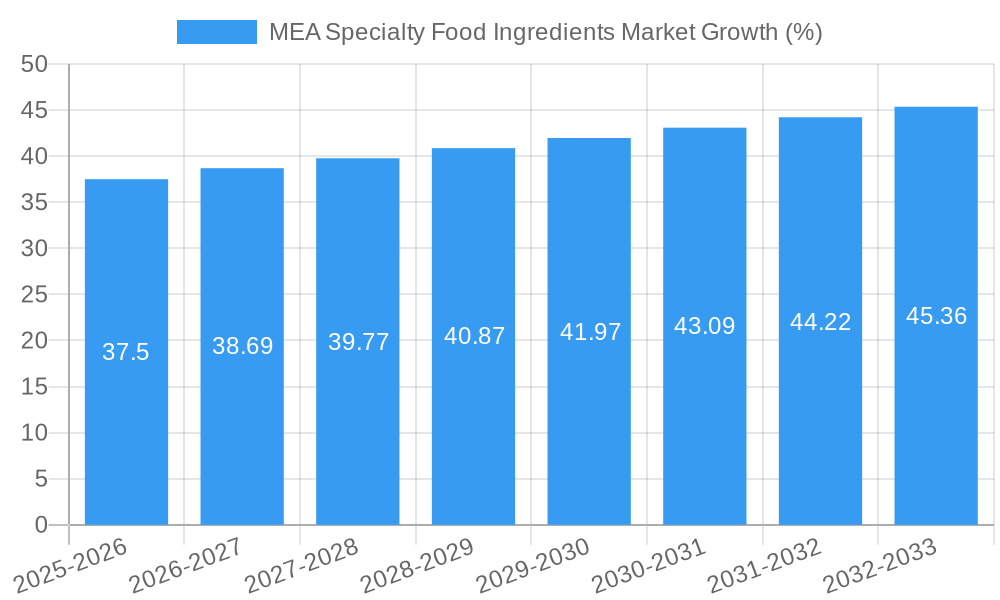
The MEA specialty food ingredients market is experiencing robust growth, driven by several interconnected factors. The region's expanding population, rising disposable incomes, and changing dietary habits are fueling demand for processed and convenient foods. A significant driver is the burgeoning food and beverage industry in the region, including fast-growing segments like bakery & confectionery and beverages. Technological advancements in food processing and preservation techniques are enabling the creation of novel specialty ingredients with enhanced functionality and shelf life. Consumer preferences are shifting towards healthier options, with a growing demand for natural, organic, and sustainably sourced ingredients. This has led to a heightened focus on clean-label products and reduced use of artificial ingredients. The competitive landscape is characterized by both intense competition and collaborative partnerships. Major players are engaging in strategic initiatives, such as product diversification, capacity expansion, and R&D investments, to maintain their market position. The CAGR for the MEA specialty food ingredients market is projected at xx% during the forecast period (2025-2033), indicating substantial growth opportunities. Market penetration of specialty food ingredients is increasing, particularly in urban areas.
Dominant Markets & Segments in MEA Specialty Food Ingredients Market
Leading Region/Country: Saudi Arabia is currently the leading market, due to its robust economy, substantial investments in the food processing sector, and considerable growth in the food service industry. South Africa also plays a crucial role, offering substantial market opportunity.
Dominant Segments:
- Type: Flavors & Colorants and Sweeteners & Starch currently hold the largest market share, driven by their extensive use across numerous food applications.
- Application: The Bakery & Confectionery and Beverages segments are the key application areas, reflecting the high consumption of these products across the MEA region.
Key Drivers:
- Economic Growth: Rising disposable incomes and increased urbanization are driving the demand for processed foods and specialty ingredients.
- Tourism and Hospitality: The expanding tourism sector boosts demand for diverse food products, leading to higher consumption of specialty ingredients.
- Government Initiatives: Policies focused on enhancing the food processing industry, improving infrastructure, and supporting local businesses contribute to market expansion.
A detailed analysis reveals that the dominance of Saudi Arabia stems from its significant investments in infrastructure development, favorable government policies supporting food processing, and a high concentration of large-scale food and beverage manufacturers. South Africa's significant contribution to the market is attributable to its established food industry and the rising middle class. Flavors & Colorants and Sweeteners & Starch are leading segments due to their extensive use across various food applications and growing preference for enhanced taste and texture. Similarly, Bakery & Confectionery and Beverages hold the largest application share due to high consumption rates.
MEA Specialty Food Ingredients Market Product Developments
Recent product developments focus on clean-label ingredients, natural colors and flavors, and functional ingredients that offer health benefits. This is in response to increasing consumer demand for healthier, more natural food options. Companies are also developing sustainable and ethically sourced ingredients to meet growing environmental concerns. Technological advancements, such as precision fermentation and advanced extraction techniques, are enabling the creation of novel ingredients with superior properties. These innovations offer competitive advantages by catering to specific consumer needs and market trends, driving differentiation in a crowded market.
Report Scope & Segmentation Analysis
This report segments the MEA specialty food ingredients market across three key dimensions:
Type: Sweetener & Starch, Flavors & Colorants, Acidulants, Emulsifiers, Enzymes, Proteins, Specialty Oils, and Other Types. Each segment's growth projection and market size are detailed, along with competitive dynamics.
Application: Bakery & Confectionery, Beverages, Dairy Products, Sauces, Dressings, and Condiments, and Other Applications. Each application area's market size, growth potential, and competitive landscape are analyzed.
Country: South Africa, Saudi Arabia, and Rest of Middle East & Africa. Country-specific market dynamics, growth drivers, and challenges are thoroughly explored.
Key Drivers of MEA Specialty Food Ingredients Market Growth
Several factors fuel the growth of the MEA specialty food ingredients market:
- Rising disposable incomes: Increasing purchasing power leads to higher spending on processed and convenient foods.
- Expanding food processing industry: Investment in advanced food processing facilities drives demand for specialized ingredients.
- Changing dietary preferences: Growing preference for healthier, functional, and convenient foods creates opportunities for new products.
Challenges in the MEA Specialty Food Ingredients Market Sector
The MEA specialty food ingredients market faces challenges, including:
- Supply chain disruptions: Geopolitical instability and logistical issues can impact the supply of raw materials.
- Stringent regulatory requirements: Compliance with food safety and labeling regulations can be complex.
- Price volatility of raw materials: Fluctuations in the cost of raw materials can impact profitability.
Emerging Opportunities in MEA Specialty Food Ingredients Market
Significant opportunities exist for growth:
- Demand for natural and organic ingredients: Growing consumer awareness of health and sustainability boosts demand for these products.
- Development of functional ingredients: Ingredients with added health benefits (e.g., probiotics, prebiotics) are gaining popularity.
- Expansion into new markets: Untapped potential exists in less developed regions within the MEA market.
Leading Players in the MEA Specialty Food Ingredients Market Market
- Cargill Incorporated
- The Archer Daniels Midland Company
- Givaudan SA
- DuPont de Nemours Inc
- Tate & Lyle PLC
- BASF SE
- Koninklijke DSM N V
- Kerry Group
- Sensient Technologies Corporation
- Ingredion Incorporated
Key Developments in MEA Specialty Food Ingredients Market Industry
February 2021: DuPont and International Flavors & Fragrances Inc. (IFF) merged, creating a larger player in specialty ingredients. This merger significantly alters the competitive landscape, impacting market share and innovation.
January 2022: Kerry Group's new facility in Jeddah, Saudi Arabia, expands its manufacturing capacity and strengthens its presence in the MEA region. This demonstrates the company’s commitment to regional expansion and improved market access.
November 2022: Calysseo's planned alternative protein production facility in Saudi Arabia signals a shift towards sustainable and innovative protein sources. This development could significantly reshape the protein ingredients segment, particularly given its scale and focus on sustainability.
Strategic Outlook for MEA Specialty Food Ingredients Market Market
The MEA specialty food ingredients market is poised for sustained growth, driven by a combination of factors, including rising disposable incomes, an expanding food processing sector, and evolving consumer preferences. The focus on natural, functional, and sustainable ingredients will continue to shape product innovation and market competition. Strategic investments in R&D and expansion into new markets will be critical for success. The industry is expected to witness further consolidation through mergers and acquisitions, further enhancing the market's competitiveness.
MEA Specialty Food Ingredients Market Segmentation
-
1. Type
- 1.1. Sweetener & Starch
- 1.2. Flavors & Colorants
- 1.3. Acidulants
- 1.4. Emulsifiers
- 1.5. Enzymes
- 1.6. Proteins
- 1.7. Speciality Oils
- 1.8. Other Types
-
2. Application
- 2.1. Bakery & Confectionery
- 2.2. Beverages
- 2.3. Dairy Products
- 2.4. Sauces, Dressings, and Condiments
- 2.5. Other Applications
MEA Specialty Food Ingredients Market Segmentation By Geography
-
1. North America
- 1.1. United States
- 1.2. Canada
- 1.3. Mexico
-
2. South America
- 2.1. Brazil
- 2.2. Argentina
- 2.3. Rest of South America
-
3. Europe
- 3.1. United Kingdom
- 3.2. Germany
- 3.3. France
- 3.4. Italy
- 3.5. Spain
- 3.6. Russia
- 3.7. Benelux
- 3.8. Nordics
- 3.9. Rest of Europe
-
4. Middle East & Africa
- 4.1. Turkey
- 4.2. Israel
- 4.3. GCC
- 4.4. North Africa
- 4.5. South Africa
- 4.6. Rest of Middle East & Africa
-
5. Asia Pacific
- 5.1. China
- 5.2. India
- 5.3. Japan
- 5.4. South Korea
- 5.5. ASEAN
- 5.6. Oceania
- 5.7. Rest of Asia Pacific
MEA Specialty Food Ingredients Market REPORT HIGHLIGHTS
| Aspects | Details |
|---|---|
| Study Period | 2019-2033 |
| Base Year | 2024 |
| Estimated Year | 2025 |
| Forecast Period | 2025-2033 |
| Historical Period | 2019-2024 |
| Growth Rate | CAGR of 2.50% from 2019-2033 |
| Segmentation |
|
Table of Contents
- 1. Introduction
- 1.1. Research Scope
- 1.2. Market Segmentation
- 1.3. Research Methodology
- 1.4. Definitions and Assumptions
- 2. Executive Summary
- 2.1. Introduction
- 3. Market Dynamics
- 3.1. Introduction
- 3.2. Market Drivers
- 3.2.1. Augmented demand for Natural Sweeteners; Rising Consumer Inclination Toward Clean Label and Organic Stevia
- 3.3. Market Restrains
- 3.3.1. Side Effects and Challenges with Stevia
- 3.4. Market Trends
- 3.4.1. Rising Demand For Functional and Fortified Food
- 4. Market Factor Analysis
- 4.1. Porters Five Forces
- 4.2. Supply/Value Chain
- 4.3. PESTEL analysis
- 4.4. Market Entropy
- 4.5. Patent/Trademark Analysis
- 5. Global MEA Specialty Food Ingredients Market Analysis, Insights and Forecast, 2019-2031
- 5.1. Market Analysis, Insights and Forecast - by Type
- 5.1.1. Sweetener & Starch
- 5.1.2. Flavors & Colorants
- 5.1.3. Acidulants
- 5.1.4. Emulsifiers
- 5.1.5. Enzymes
- 5.1.6. Proteins
- 5.1.7. Speciality Oils
- 5.1.8. Other Types
- 5.2. Market Analysis, Insights and Forecast - by Application
- 5.2.1. Bakery & Confectionery
- 5.2.2. Beverages
- 5.2.3. Dairy Products
- 5.2.4. Sauces, Dressings, and Condiments
- 5.2.5. Other Applications
- 5.3. Market Analysis, Insights and Forecast - by Region
- 5.3.1. North America
- 5.3.2. South America
- 5.3.3. Europe
- 5.3.4. Middle East & Africa
- 5.3.5. Asia Pacific
- 5.1. Market Analysis, Insights and Forecast - by Type
- 6. North America MEA Specialty Food Ingredients Market Analysis, Insights and Forecast, 2019-2031
- 6.1. Market Analysis, Insights and Forecast - by Type
- 6.1.1. Sweetener & Starch
- 6.1.2. Flavors & Colorants
- 6.1.3. Acidulants
- 6.1.4. Emulsifiers
- 6.1.5. Enzymes
- 6.1.6. Proteins
- 6.1.7. Speciality Oils
- 6.1.8. Other Types
- 6.2. Market Analysis, Insights and Forecast - by Application
- 6.2.1. Bakery & Confectionery
- 6.2.2. Beverages
- 6.2.3. Dairy Products
- 6.2.4. Sauces, Dressings, and Condiments
- 6.2.5. Other Applications
- 6.1. Market Analysis, Insights and Forecast - by Type
- 7. South America MEA Specialty Food Ingredients Market Analysis, Insights and Forecast, 2019-2031
- 7.1. Market Analysis, Insights and Forecast - by Type
- 7.1.1. Sweetener & Starch
- 7.1.2. Flavors & Colorants
- 7.1.3. Acidulants
- 7.1.4. Emulsifiers
- 7.1.5. Enzymes
- 7.1.6. Proteins
- 7.1.7. Speciality Oils
- 7.1.8. Other Types
- 7.2. Market Analysis, Insights and Forecast - by Application
- 7.2.1. Bakery & Confectionery
- 7.2.2. Beverages
- 7.2.3. Dairy Products
- 7.2.4. Sauces, Dressings, and Condiments
- 7.2.5. Other Applications
- 7.1. Market Analysis, Insights and Forecast - by Type
- 8. Europe MEA Specialty Food Ingredients Market Analysis, Insights and Forecast, 2019-2031
- 8.1. Market Analysis, Insights and Forecast - by Type
- 8.1.1. Sweetener & Starch
- 8.1.2. Flavors & Colorants
- 8.1.3. Acidulants
- 8.1.4. Emulsifiers
- 8.1.5. Enzymes
- 8.1.6. Proteins
- 8.1.7. Speciality Oils
- 8.1.8. Other Types
- 8.2. Market Analysis, Insights and Forecast - by Application
- 8.2.1. Bakery & Confectionery
- 8.2.2. Beverages
- 8.2.3. Dairy Products
- 8.2.4. Sauces, Dressings, and Condiments
- 8.2.5. Other Applications
- 8.1. Market Analysis, Insights and Forecast - by Type
- 9. Middle East & Africa MEA Specialty Food Ingredients Market Analysis, Insights and Forecast, 2019-2031
- 9.1. Market Analysis, Insights and Forecast - by Type
- 9.1.1. Sweetener & Starch
- 9.1.2. Flavors & Colorants
- 9.1.3. Acidulants
- 9.1.4. Emulsifiers
- 9.1.5. Enzymes
- 9.1.6. Proteins
- 9.1.7. Speciality Oils
- 9.1.8. Other Types
- 9.2. Market Analysis, Insights and Forecast - by Application
- 9.2.1. Bakery & Confectionery
- 9.2.2. Beverages
- 9.2.3. Dairy Products
- 9.2.4. Sauces, Dressings, and Condiments
- 9.2.5. Other Applications
- 9.1. Market Analysis, Insights and Forecast - by Type
- 10. Asia Pacific MEA Specialty Food Ingredients Market Analysis, Insights and Forecast, 2019-2031
- 10.1. Market Analysis, Insights and Forecast - by Type
- 10.1.1. Sweetener & Starch
- 10.1.2. Flavors & Colorants
- 10.1.3. Acidulants
- 10.1.4. Emulsifiers
- 10.1.5. Enzymes
- 10.1.6. Proteins
- 10.1.7. Speciality Oils
- 10.1.8. Other Types
- 10.2. Market Analysis, Insights and Forecast - by Application
- 10.2.1. Bakery & Confectionery
- 10.2.2. Beverages
- 10.2.3. Dairy Products
- 10.2.4. Sauces, Dressings, and Condiments
- 10.2.5. Other Applications
- 10.1. Market Analysis, Insights and Forecast - by Type
- 11. North America MEA Specialty Food Ingredients Market Analysis, Insights and Forecast, 2019-2031
- 11.1. Market Analysis, Insights and Forecast - By Country/Sub-region
- 11.1.1 United States
- 11.1.2 Canada
- 11.1.3 Mexico
- 12. Europe MEA Specialty Food Ingredients Market Analysis, Insights and Forecast, 2019-2031
- 12.1. Market Analysis, Insights and Forecast - By Country/Sub-region
- 12.1.1 Germany
- 12.1.2 United Kingdom
- 12.1.3 France
- 12.1.4 Spain
- 12.1.5 Italy
- 12.1.6 Spain
- 12.1.7 Belgium
- 12.1.8 Netherland
- 12.1.9 Nordics
- 12.1.10 Rest of Europe
- 13. Asia Pacific MEA Specialty Food Ingredients Market Analysis, Insights and Forecast, 2019-2031
- 13.1. Market Analysis, Insights and Forecast - By Country/Sub-region
- 13.1.1 China
- 13.1.2 Japan
- 13.1.3 India
- 13.1.4 South Korea
- 13.1.5 Southeast Asia
- 13.1.6 Australia
- 13.1.7 Indonesia
- 13.1.8 Phillipes
- 13.1.9 Singapore
- 13.1.10 Thailandc
- 13.1.11 Rest of Asia Pacific
- 14. South America MEA Specialty Food Ingredients Market Analysis, Insights and Forecast, 2019-2031
- 14.1. Market Analysis, Insights and Forecast - By Country/Sub-region
- 14.1.1 Brazil
- 14.1.2 Argentina
- 14.1.3 Peru
- 14.1.4 Chile
- 14.1.5 Colombia
- 14.1.6 Ecuador
- 14.1.7 Venezuela
- 14.1.8 Rest of South America
- 15. North America MEA Specialty Food Ingredients Market Analysis, Insights and Forecast, 2019-2031
- 15.1. Market Analysis, Insights and Forecast - By Country/Sub-region
- 15.1.1 United States
- 15.1.2 Canada
- 15.1.3 Mexico
- 16. MEA MEA Specialty Food Ingredients Market Analysis, Insights and Forecast, 2019-2031
- 16.1. Market Analysis, Insights and Forecast - By Country/Sub-region
- 16.1.1 United Arab Emirates
- 16.1.2 Saudi Arabia
- 16.1.3 South Africa
- 16.1.4 Rest of Middle East and Africa
- 17. Competitive Analysis
- 17.1. Global Market Share Analysis 2024
- 17.2. Company Profiles
- 17.2.1 Cargill Incorporated
- 17.2.1.1. Overview
- 17.2.1.2. Products
- 17.2.1.3. SWOT Analysis
- 17.2.1.4. Recent Developments
- 17.2.1.5. Financials (Based on Availability)
- 17.2.2 The Archer Daniels Midland Company
- 17.2.2.1. Overview
- 17.2.2.2. Products
- 17.2.2.3. SWOT Analysis
- 17.2.2.4. Recent Developments
- 17.2.2.5. Financials (Based on Availability)
- 17.2.3 Givaudan SA
- 17.2.3.1. Overview
- 17.2.3.2. Products
- 17.2.3.3. SWOT Analysis
- 17.2.3.4. Recent Developments
- 17.2.3.5. Financials (Based on Availability)
- 17.2.4 DuPont de Nemours Inc
- 17.2.4.1. Overview
- 17.2.4.2. Products
- 17.2.4.3. SWOT Analysis
- 17.2.4.4. Recent Developments
- 17.2.4.5. Financials (Based on Availability)
- 17.2.5 Tate & Lyle PLC
- 17.2.5.1. Overview
- 17.2.5.2. Products
- 17.2.5.3. SWOT Analysis
- 17.2.5.4. Recent Developments
- 17.2.5.5. Financials (Based on Availability)
- 17.2.6 BASF SE*List Not Exhaustive
- 17.2.6.1. Overview
- 17.2.6.2. Products
- 17.2.6.3. SWOT Analysis
- 17.2.6.4. Recent Developments
- 17.2.6.5. Financials (Based on Availability)
- 17.2.7 Koninklijke DSM N V
- 17.2.7.1. Overview
- 17.2.7.2. Products
- 17.2.7.3. SWOT Analysis
- 17.2.7.4. Recent Developments
- 17.2.7.5. Financials (Based on Availability)
- 17.2.8 Kerry Group
- 17.2.8.1. Overview
- 17.2.8.2. Products
- 17.2.8.3. SWOT Analysis
- 17.2.8.4. Recent Developments
- 17.2.8.5. Financials (Based on Availability)
- 17.2.9 Sensient Technologies Corporation
- 17.2.9.1. Overview
- 17.2.9.2. Products
- 17.2.9.3. SWOT Analysis
- 17.2.9.4. Recent Developments
- 17.2.9.5. Financials (Based on Availability)
- 17.2.10 Ingredion Incorporated
- 17.2.10.1. Overview
- 17.2.10.2. Products
- 17.2.10.3. SWOT Analysis
- 17.2.10.4. Recent Developments
- 17.2.10.5. Financials (Based on Availability)
- 17.2.1 Cargill Incorporated
List of Figures
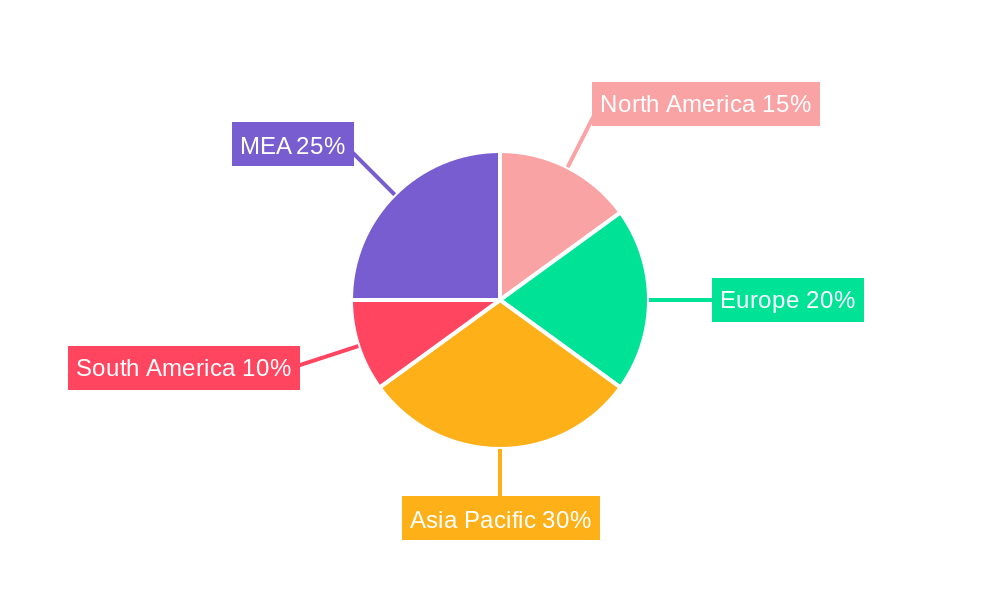
- Figure 1: Global MEA Specialty Food Ingredients Market Revenue Breakdown (Million, %) by Region 2024 & 2032
- Figure 2: North America MEA Specialty Food Ingredients Market Revenue (Million), by Country 2024 & 2032
- Figure 3: North America MEA Specialty Food Ingredients Market Revenue Share (%), by Country 2024 & 2032
- Figure 4: Europe MEA Specialty Food Ingredients Market Revenue (Million), by Country 2024 & 2032
- Figure 5: Europe MEA Specialty Food Ingredients Market Revenue Share (%), by Country 2024 & 2032
- Figure 6: Asia Pacific MEA Specialty Food Ingredients Market Revenue (Million), by Country 2024 & 2032
- Figure 7: Asia Pacific MEA Specialty Food Ingredients Market Revenue Share (%), by Country 2024 & 2032
- Figure 8: South America MEA Specialty Food Ingredients Market Revenue (Million), by Country 2024 & 2032
- Figure 9: South America MEA Specialty Food Ingredients Market Revenue Share (%), by Country 2024 & 2032
- Figure 10: North America MEA Specialty Food Ingredients Market Revenue (Million), by Country 2024 & 2032
- Figure 11: North America MEA Specialty Food Ingredients Market Revenue Share (%), by Country 2024 & 2032
- Figure 12: MEA MEA Specialty Food Ingredients Market Revenue (Million), by Country 2024 & 2032
- Figure 13: MEA MEA Specialty Food Ingredients Market Revenue Share (%), by Country 2024 & 2032
- Figure 14: North America MEA Specialty Food Ingredients Market Revenue (Million), by Type 2024 & 2032
- Figure 15: North America MEA Specialty Food Ingredients Market Revenue Share (%), by Type 2024 & 2032
- Figure 16: North America MEA Specialty Food Ingredients Market Revenue (Million), by Application 2024 & 2032
- Figure 17: North America MEA Specialty Food Ingredients Market Revenue Share (%), by Application 2024 & 2032
- Figure 18: North America MEA Specialty Food Ingredients Market Revenue (Million), by Country 2024 & 2032
- Figure 19: North America MEA Specialty Food Ingredients Market Revenue Share (%), by Country 2024 & 2032
- Figure 20: South America MEA Specialty Food Ingredients Market Revenue (Million), by Type 2024 & 2032
- Figure 21: South America MEA Specialty Food Ingredients Market Revenue Share (%), by Type 2024 & 2032
- Figure 22: South America MEA Specialty Food Ingredients Market Revenue (Million), by Application 2024 & 2032
- Figure 23: South America MEA Specialty Food Ingredients Market Revenue Share (%), by Application 2024 & 2032
- Figure 24: South America MEA Specialty Food Ingredients Market Revenue (Million), by Country 2024 & 2032
- Figure 25: South America MEA Specialty Food Ingredients Market Revenue Share (%), by Country 2024 & 2032
- Figure 26: Europe MEA Specialty Food Ingredients Market Revenue (Million), by Type 2024 & 2032
- Figure 27: Europe MEA Specialty Food Ingredients Market Revenue Share (%), by Type 2024 & 2032
- Figure 28: Europe MEA Specialty Food Ingredients Market Revenue (Million), by Application 2024 & 2032
- Figure 29: Europe MEA Specialty Food Ingredients Market Revenue Share (%), by Application 2024 & 2032
- Figure 30: Europe MEA Specialty Food Ingredients Market Revenue (Million), by Country 2024 & 2032
- Figure 31: Europe MEA Specialty Food Ingredients Market Revenue Share (%), by Country 2024 & 2032
- Figure 32: Middle East & Africa MEA Specialty Food Ingredients Market Revenue (Million), by Type 2024 & 2032
- Figure 33: Middle East & Africa MEA Specialty Food Ingredients Market Revenue Share (%), by Type 2024 & 2032
- Figure 34: Middle East & Africa MEA Specialty Food Ingredients Market Revenue (Million), by Application 2024 & 2032
- Figure 35: Middle East & Africa MEA Specialty Food Ingredients Market Revenue Share (%), by Application 2024 & 2032
- Figure 36: Middle East & Africa MEA Specialty Food Ingredients Market Revenue (Million), by Country 2024 & 2032
- Figure 37: Middle East & Africa MEA Specialty Food Ingredients Market Revenue Share (%), by Country 2024 & 2032
- Figure 38: Asia Pacific MEA Specialty Food Ingredients Market Revenue (Million), by Type 2024 & 2032
- Figure 39: Asia Pacific MEA Specialty Food Ingredients Market Revenue Share (%), by Type 2024 & 2032
- Figure 40: Asia Pacific MEA Specialty Food Ingredients Market Revenue (Million), by Application 2024 & 2032
- Figure 41: Asia Pacific MEA Specialty Food Ingredients Market Revenue Share (%), by Application 2024 & 2032
- Figure 42: Asia Pacific MEA Specialty Food Ingredients Market Revenue (Million), by Country 2024 & 2032
- Figure 43: Asia Pacific MEA Specialty Food Ingredients Market Revenue Share (%), by Country 2024 & 2032
List of Tables
- Table 1: Global MEA Specialty Food Ingredients Market Revenue Million Forecast, by Region 2019 & 2032
- Table 2: Global MEA Specialty Food Ingredients Market Revenue Million Forecast, by Type 2019 & 2032
- Table 3: Global MEA Specialty Food Ingredients Market Revenue Million Forecast, by Application 2019 & 2032
- Table 4: Global MEA Specialty Food Ingredients Market Revenue Million Forecast, by Region 2019 & 2032
- Table 5: Global MEA Specialty Food Ingredients Market Revenue Million Forecast, by Country 2019 & 2032
- Table 6: United States MEA Specialty Food Ingredients Market Revenue (Million) Forecast, by Application 2019 & 2032
- Table 7: Canada MEA Specialty Food Ingredients Market Revenue (Million) Forecast, by Application 2019 & 2032
- Table 8: Mexico MEA Specialty Food Ingredients Market Revenue (Million) Forecast, by Application 2019 & 2032
- Table 9: Global MEA Specialty Food Ingredients Market Revenue Million Forecast, by Country 2019 & 2032
- Table 10: Germany MEA Specialty Food Ingredients Market Revenue (Million) Forecast, by Application 2019 & 2032
- Table 11: United Kingdom MEA Specialty Food Ingredients Market Revenue (Million) Forecast, by Application 2019 & 2032
- Table 12: France MEA Specialty Food Ingredients Market Revenue (Million) Forecast, by Application 2019 & 2032
- Table 13: Spain MEA Specialty Food Ingredients Market Revenue (Million) Forecast, by Application 2019 & 2032
- Table 14: Italy MEA Specialty Food Ingredients Market Revenue (Million) Forecast, by Application 2019 & 2032
- Table 15: Spain MEA Specialty Food Ingredients Market Revenue (Million) Forecast, by Application 2019 & 2032
- Table 16: Belgium MEA Specialty Food Ingredients Market Revenue (Million) Forecast, by Application 2019 & 2032
- Table 17: Netherland MEA Specialty Food Ingredients Market Revenue (Million) Forecast, by Application 2019 & 2032
- Table 18: Nordics MEA Specialty Food Ingredients Market Revenue (Million) Forecast, by Application 2019 & 2032
- Table 19: Rest of Europe MEA Specialty Food Ingredients Market Revenue (Million) Forecast, by Application 2019 & 2032
- Table 20: Global MEA Specialty Food Ingredients Market Revenue Million Forecast, by Country 2019 & 2032
- Table 21: China MEA Specialty Food Ingredients Market Revenue (Million) Forecast, by Application 2019 & 2032
- Table 22: Japan MEA Specialty Food Ingredients Market Revenue (Million) Forecast, by Application 2019 & 2032
- Table 23: India MEA Specialty Food Ingredients Market Revenue (Million) Forecast, by Application 2019 & 2032
- Table 24: South Korea MEA Specialty Food Ingredients Market Revenue (Million) Forecast, by Application 2019 & 2032
- Table 25: Southeast Asia MEA Specialty Food Ingredients Market Revenue (Million) Forecast, by Application 2019 & 2032
- Table 26: Australia MEA Specialty Food Ingredients Market Revenue (Million) Forecast, by Application 2019 & 2032
- Table 27: Indonesia MEA Specialty Food Ingredients Market Revenue (Million) Forecast, by Application 2019 & 2032
- Table 28: Phillipes MEA Specialty Food Ingredients Market Revenue (Million) Forecast, by Application 2019 & 2032
- Table 29: Singapore MEA Specialty Food Ingredients Market Revenue (Million) Forecast, by Application 2019 & 2032
- Table 30: Thailandc MEA Specialty Food Ingredients Market Revenue (Million) Forecast, by Application 2019 & 2032
- Table 31: Rest of Asia Pacific MEA Specialty Food Ingredients Market Revenue (Million) Forecast, by Application 2019 & 2032
- Table 32: Global MEA Specialty Food Ingredients Market Revenue Million Forecast, by Country 2019 & 2032
- Table 33: Brazil MEA Specialty Food Ingredients Market Revenue (Million) Forecast, by Application 2019 & 2032
- Table 34: Argentina MEA Specialty Food Ingredients Market Revenue (Million) Forecast, by Application 2019 & 2032
- Table 35: Peru MEA Specialty Food Ingredients Market Revenue (Million) Forecast, by Application 2019 & 2032
- Table 36: Chile MEA Specialty Food Ingredients Market Revenue (Million) Forecast, by Application 2019 & 2032
- Table 37: Colombia MEA Specialty Food Ingredients Market Revenue (Million) Forecast, by Application 2019 & 2032
- Table 38: Ecuador MEA Specialty Food Ingredients Market Revenue (Million) Forecast, by Application 2019 & 2032
- Table 39: Venezuela MEA Specialty Food Ingredients Market Revenue (Million) Forecast, by Application 2019 & 2032
- Table 40: Rest of South America MEA Specialty Food Ingredients Market Revenue (Million) Forecast, by Application 2019 & 2032
- Table 41: Global MEA Specialty Food Ingredients Market Revenue Million Forecast, by Country 2019 & 2032
- Table 42: United States MEA Specialty Food Ingredients Market Revenue (Million) Forecast, by Application 2019 & 2032
- Table 43: Canada MEA Specialty Food Ingredients Market Revenue (Million) Forecast, by Application 2019 & 2032
- Table 44: Mexico MEA Specialty Food Ingredients Market Revenue (Million) Forecast, by Application 2019 & 2032
- Table 45: Global MEA Specialty Food Ingredients Market Revenue Million Forecast, by Country 2019 & 2032
- Table 46: United Arab Emirates MEA Specialty Food Ingredients Market Revenue (Million) Forecast, by Application 2019 & 2032
- Table 47: Saudi Arabia MEA Specialty Food Ingredients Market Revenue (Million) Forecast, by Application 2019 & 2032
- Table 48: South Africa MEA Specialty Food Ingredients Market Revenue (Million) Forecast, by Application 2019 & 2032
- Table 49: Rest of Middle East and Africa MEA Specialty Food Ingredients Market Revenue (Million) Forecast, by Application 2019 & 2032
- Table 50: Global MEA Specialty Food Ingredients Market Revenue Million Forecast, by Type 2019 & 2032
- Table 51: Global MEA Specialty Food Ingredients Market Revenue Million Forecast, by Application 2019 & 2032
- Table 52: Global MEA Specialty Food Ingredients Market Revenue Million Forecast, by Country 2019 & 2032
- Table 53: United States MEA Specialty Food Ingredients Market Revenue (Million) Forecast, by Application 2019 & 2032
- Table 54: Canada MEA Specialty Food Ingredients Market Revenue (Million) Forecast, by Application 2019 & 2032
- Table 55: Mexico MEA Specialty Food Ingredients Market Revenue (Million) Forecast, by Application 2019 & 2032
- Table 56: Global MEA Specialty Food Ingredients Market Revenue Million Forecast, by Type 2019 & 2032
- Table 57: Global MEA Specialty Food Ingredients Market Revenue Million Forecast, by Application 2019 & 2032
- Table 58: Global MEA Specialty Food Ingredients Market Revenue Million Forecast, by Country 2019 & 2032
- Table 59: Brazil MEA Specialty Food Ingredients Market Revenue (Million) Forecast, by Application 2019 & 2032
- Table 60: Argentina MEA Specialty Food Ingredients Market Revenue (Million) Forecast, by Application 2019 & 2032
- Table 61: Rest of South America MEA Specialty Food Ingredients Market Revenue (Million) Forecast, by Application 2019 & 2032
- Table 62: Global MEA Specialty Food Ingredients Market Revenue Million Forecast, by Type 2019 & 2032
- Table 63: Global MEA Specialty Food Ingredients Market Revenue Million Forecast, by Application 2019 & 2032
- Table 64: Global MEA Specialty Food Ingredients Market Revenue Million Forecast, by Country 2019 & 2032
- Table 65: United Kingdom MEA Specialty Food Ingredients Market Revenue (Million) Forecast, by Application 2019 & 2032
- Table 66: Germany MEA Specialty Food Ingredients Market Revenue (Million) Forecast, by Application 2019 & 2032
- Table 67: France MEA Specialty Food Ingredients Market Revenue (Million) Forecast, by Application 2019 & 2032
- Table 68: Italy MEA Specialty Food Ingredients Market Revenue (Million) Forecast, by Application 2019 & 2032
- Table 69: Spain MEA Specialty Food Ingredients Market Revenue (Million) Forecast, by Application 2019 & 2032
- Table 70: Russia MEA Specialty Food Ingredients Market Revenue (Million) Forecast, by Application 2019 & 2032
- Table 71: Benelux MEA Specialty Food Ingredients Market Revenue (Million) Forecast, by Application 2019 & 2032
- Table 72: Nordics MEA Specialty Food Ingredients Market Revenue (Million) Forecast, by Application 2019 & 2032
- Table 73: Rest of Europe MEA Specialty Food Ingredients Market Revenue (Million) Forecast, by Application 2019 & 2032
- Table 74: Global MEA Specialty Food Ingredients Market Revenue Million Forecast, by Type 2019 & 2032
- Table 75: Global MEA Specialty Food Ingredients Market Revenue Million Forecast, by Application 2019 & 2032
- Table 76: Global MEA Specialty Food Ingredients Market Revenue Million Forecast, by Country 2019 & 2032
- Table 77: Turkey MEA Specialty Food Ingredients Market Revenue (Million) Forecast, by Application 2019 & 2032
- Table 78: Israel MEA Specialty Food Ingredients Market Revenue (Million) Forecast, by Application 2019 & 2032
- Table 79: GCC MEA Specialty Food Ingredients Market Revenue (Million) Forecast, by Application 2019 & 2032
- Table 80: North Africa MEA Specialty Food Ingredients Market Revenue (Million) Forecast, by Application 2019 & 2032
- Table 81: South Africa MEA Specialty Food Ingredients Market Revenue (Million) Forecast, by Application 2019 & 2032
- Table 82: Rest of Middle East & Africa MEA Specialty Food Ingredients Market Revenue (Million) Forecast, by Application 2019 & 2032
- Table 83: Global MEA Specialty Food Ingredients Market Revenue Million Forecast, by Type 2019 & 2032
- Table 84: Global MEA Specialty Food Ingredients Market Revenue Million Forecast, by Application 2019 & 2032
- Table 85: Global MEA Specialty Food Ingredients Market Revenue Million Forecast, by Country 2019 & 2032
- Table 86: China MEA Specialty Food Ingredients Market Revenue (Million) Forecast, by Application 2019 & 2032
- Table 87: India MEA Specialty Food Ingredients Market Revenue (Million) Forecast, by Application 2019 & 2032
- Table 88: Japan MEA Specialty Food Ingredients Market Revenue (Million) Forecast, by Application 2019 & 2032
- Table 89: South Korea MEA Specialty Food Ingredients Market Revenue (Million) Forecast, by Application 2019 & 2032
- Table 90: ASEAN MEA Specialty Food Ingredients Market Revenue (Million) Forecast, by Application 2019 & 2032
- Table 91: Oceania MEA Specialty Food Ingredients Market Revenue (Million) Forecast, by Application 2019 & 2032
- Table 92: Rest of Asia Pacific MEA Specialty Food Ingredients Market Revenue (Million) Forecast, by Application 2019 & 2032
Frequently Asked Questions
1. What is the projected Compound Annual Growth Rate (CAGR) of the MEA Specialty Food Ingredients Market?
The projected CAGR is approximately 2.50%.
2. Which companies are prominent players in the MEA Specialty Food Ingredients Market?
Key companies in the market include Cargill Incorporated, The Archer Daniels Midland Company, Givaudan SA, DuPont de Nemours Inc, Tate & Lyle PLC, BASF SE*List Not Exhaustive, Koninklijke DSM N V, Kerry Group, Sensient Technologies Corporation, Ingredion Incorporated.
3. What are the main segments of the MEA Specialty Food Ingredients Market?
The market segments include Type, Application.
4. Can you provide details about the market size?
The market size is estimated to be USD XX Million as of 2022.
5. What are some drivers contributing to market growth?
Augmented demand for Natural Sweeteners; Rising Consumer Inclination Toward Clean Label and Organic Stevia.
6. What are the notable trends driving market growth?
Rising Demand For Functional and Fortified Food.
7. Are there any restraints impacting market growth?
Side Effects and Challenges with Stevia.
8. Can you provide examples of recent developments in the market?
November 2022: Calysseo, a joint venture between Calysta and Adisseo, announced its plan to construct an alternative protein production facility in Al Jubail, Saudi Arabia. The facility will feature a 100,000-tonne fermenter that will enable the production of innovative protein ingredients that do not rely on animal or plant proteins as ingredients.
9. What pricing options are available for accessing the report?
Pricing options include single-user, multi-user, and enterprise licenses priced at USD 4750, USD 5250, and USD 8750 respectively.
10. Is the market size provided in terms of value or volume?
The market size is provided in terms of value, measured in Million.
11. Are there any specific market keywords associated with the report?
Yes, the market keyword associated with the report is "MEA Specialty Food Ingredients Market," which aids in identifying and referencing the specific market segment covered.
12. How do I determine which pricing option suits my needs best?
The pricing options vary based on user requirements and access needs. Individual users may opt for single-user licenses, while businesses requiring broader access may choose multi-user or enterprise licenses for cost-effective access to the report.
13. Are there any additional resources or data provided in the MEA Specialty Food Ingredients Market report?
While the report offers comprehensive insights, it's advisable to review the specific contents or supplementary materials provided to ascertain if additional resources or data are available.
14. How can I stay updated on further developments or reports in the MEA Specialty Food Ingredients Market?
To stay informed about further developments, trends, and reports in the MEA Specialty Food Ingredients Market, consider subscribing to industry newsletters, following relevant companies and organizations, or regularly checking reputable industry news sources and publications.
Methodology
Step 1 - Identification of Relevant Samples Size from Population Database


Step 2 - Approaches for Defining Global Market Size (Value, Volume* & Price*)

Note*: In applicable scenarios
Step 3 - Data Sources
Primary Research
- Web Analytics
- Survey Reports
- Research Institute
- Latest Research Reports
- Opinion Leaders
Secondary Research
- Annual Reports
- White Paper
- Latest Press Release
- Industry Association
- Paid Database
- Investor Presentations

Step 4 - Data Triangulation
Involves using different sources of information in order to increase the validity of a study
These sources are likely to be stakeholders in a program - participants, other researchers, program staff, other community members, and so on.
Then we put all data in single framework & apply various statistical tools to find out the dynamic on the market.
During the analysis stage, feedback from the stakeholder groups would be compared to determine areas of agreement as well as areas of divergence


