
Key Insights
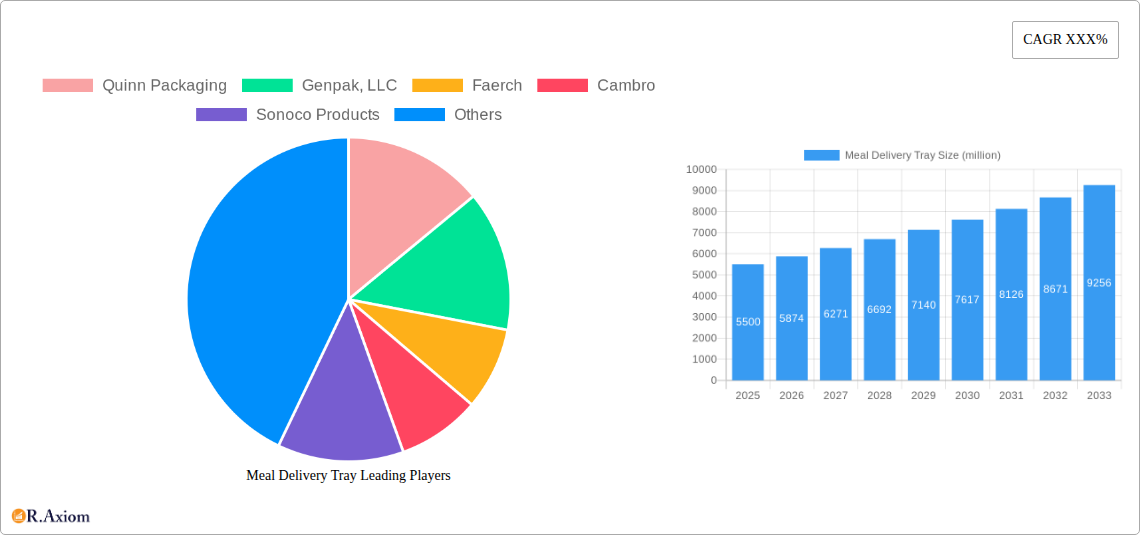
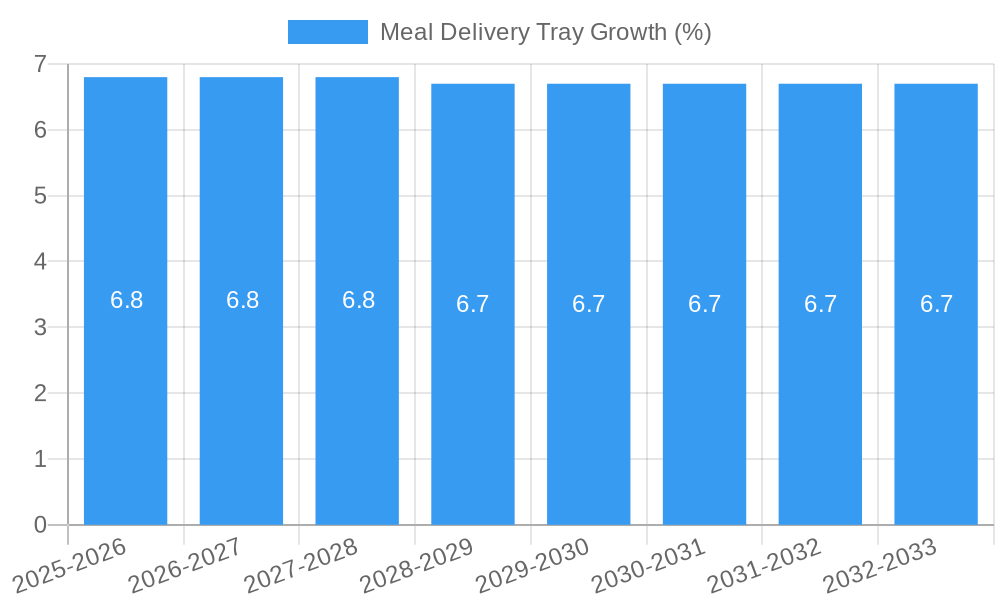
The global Meal Delivery Tray market is poised for significant expansion, estimated to reach approximately USD 5,500 million in 2025. This growth is propelled by a robust Compound Annual Growth Rate (CAGR) of around 6.8%, indicating a dynamic and evolving industry. The escalating demand for convenient food options, particularly from the take-out food and restaurant sectors, is a primary driver. The increasing adoption of online food delivery services and the subsequent need for reliable and safe packaging solutions are fueling market expansion. Furthermore, the rising disposable incomes and changing lifestyles in emerging economies are contributing to a greater reliance on pre-packaged meals for both individual consumption and catering services. The market is also witnessing a surge in innovation, with manufacturers focusing on developing sustainable and eco-friendly packaging alternatives to meet growing environmental concerns. This includes a notable shift towards degradable materials and advanced recyclable plastics, reflecting a conscious effort by industry players to align with global sustainability initiatives.
The market's trajectory is shaped by several key trends, including the growing preference for trays that offer superior insulation properties to maintain food temperature and quality during transit. This is leading to increased adoption of materials like PP plastic and aluminum foil for specific applications. Conversely, the market faces certain restraints, such as the fluctuating raw material prices, particularly for plastics and paper, which can impact manufacturing costs and profit margins. Stringent regulations regarding food packaging materials and waste management in certain regions may also present challenges for market participants. Despite these hurdles, the market is expected to witness continued growth, driven by the persistent demand for convenient food solutions and the ongoing pursuit of sustainable packaging innovations. The competitive landscape is characterized by the presence of established global players and emerging regional manufacturers, all vying for market share through product differentiation and strategic partnerships.
Comprehensive Meal Delivery Tray Market Report: 2019-2033
This in-depth report provides a thorough analysis of the global Meal Delivery Tray market, covering historical data from 2019 to 2024 and projecting trends through 2033. With a base year of 2025, the study offers critical insights into market dynamics, competitive landscapes, and future growth trajectories. Industry stakeholders, including manufacturers, suppliers, investors, and regulatory bodies, will find this report invaluable for strategic decision-making. The analysis encompasses a detailed segmentation of the market by application and type, along with an exploration of key industry developments and emerging opportunities.
Meal Delivery Tray Market Concentration & Innovation
The global Meal Delivery Tray market exhibits a moderate level of concentration, with several key players holding significant market share. Major companies like Genpak, LLC, Sabert Corporation, and Huhtamaki are at the forefront, investing heavily in research and development to drive innovation. The market's innovation landscape is shaped by evolving consumer demand for sustainable packaging solutions, advancements in material science, and the increasing adoption of automation in food production and delivery. Regulatory frameworks, particularly those concerning food safety and environmental impact, play a crucial role in shaping product development and market entry. For instance, increasing restrictions on single-use plastics are pushing innovation towards degradable materials and advanced recycling technologies. Product substitutes, such as reusable containers and innovative flexible packaging, present a dynamic competitive pressure. End-user trends are heavily influenced by the convenience economy, with a growing preference for aesthetically pleasing, functional, and eco-friendly meal delivery trays. Mergers and acquisition (M&A) activities, valued in the hundreds of millions of dollars, are expected to continue as companies seek to expand their product portfolios, geographical reach, and technological capabilities. Key M&A deals are projected to reshape the market in the coming years, consolidating market share and fostering synergistic growth. The market share of leading players is estimated to range from 10% to 25%, with smaller players collectively holding the remaining share.
Meal Delivery Tray Industry Trends & Insights
The Meal Delivery Tray industry is poised for significant expansion, driven by a confluence of robust market growth drivers. The escalating demand for convenience food services, fueled by busy lifestyles and the widespread adoption of food delivery platforms, is a primary catalyst. This trend is projected to see the market grow at a Compound Annual Growth Rate (CAGR) of approximately 7.5% over the forecast period of 2025-2033. Technological disruptions are continuously reshaping the industry. Innovations in material science are leading to the development of more sustainable, durable, and temperature-retaining meal trays. The integration of smart packaging technologies, such as RFID tags for inventory management and tracking, is also gaining traction, especially in large-scale catering and airline industries. Consumer preferences are increasingly leaning towards environmentally friendly and aesthetically pleasing packaging. This shift is creating a demand for biodegradable, compostable, and recyclable meal delivery trays, pushing manufacturers to adopt sustainable practices and materials. The competitive dynamics within the industry are characterized by intense price competition, product differentiation, and strategic partnerships. Companies are focusing on optimizing their supply chains, enhancing production efficiency, and developing unique product offerings to gain a competitive edge. Market penetration for sustainable meal delivery trays is projected to reach over 50% by 2033, driven by consumer awareness and regulatory mandates. The rise of e-commerce and the expansion of the quick-service restaurant (QSR) sector further bolster the demand for efficient and cost-effective meal delivery solutions. The global market size for meal delivery trays is estimated to reach over $20 billion by 2033.
Dominant Markets & Segments in Meal Delivery Tray
The Meal Delivery Tray market is experiencing robust growth across various segments, with the Take-out Food application and PP Plastic type emerging as dominant forces.
- Application: Take-out Food: This segment holds the largest market share, estimated at over 60% of the total market value.
- Key Drivers:
- Economic Policies: Favorable policies supporting the food service industry, including tax incentives and reduced regulatory burdens, have spurred the growth of restaurants and food delivery services.
- Infrastructure: The widespread availability of robust logistics and delivery networks, facilitated by investments in transportation infrastructure and the proliferation of delivery apps, enables efficient food distribution.
- Urbanization: Increasing urbanization leads to higher population density and a greater reliance on convenient food options, directly benefiting the take-out food sector.
- Consumer Behavior: The persistent trend of busy lifestyles and the growing demand for convenience continue to drive consumer preference for take-out meals.
- Key Drivers:
- Application: Restaurant: The restaurant segment, including dine-in establishments that also offer take-out or delivery options, represents a significant portion of the market, estimated at approximately 25%.
- Key Drivers:
- Diversification of Services: Restaurants are increasingly diversifying their revenue streams by offering delivery and take-out services to cater to a wider customer base.
- Brand Experience: The meal delivery tray contributes to the overall brand experience, with many restaurants opting for custom-branded and high-quality trays to maintain their image even for off-premise consumption.
- Cost-Effectiveness: For restaurants, well-designed meal delivery trays offer a cost-effective way to package and transport food without compromising on presentation or food integrity.
- Key Drivers:
- Type: PP Plastic: Polypropylene (PP) plastic dominates the meal delivery tray market, accounting for an estimated 45% of the market share.
- Key Drivers:
- Durability and Strength: PP plastic offers excellent durability and strength, making it ideal for carrying various types of food without bending or leaking.
- Heat Resistance: Its high heat resistance allows for microwaveability and suitability for hot food items, a crucial factor for take-out and delivery.
- Cost-Effectiveness: PP plastic is a relatively inexpensive material to produce, making it a cost-effective choice for high-volume manufacturing.
- Barrier Properties: It provides good barrier properties against moisture and grease, helping to maintain food freshness and prevent package integrity issues.
- Key Drivers:
- Type: Degradable Material: This segment is experiencing rapid growth, with an estimated CAGR of over 9%, driven by environmental consciousness.
- Key Drivers:
- Consumer Demand for Sustainability: Growing consumer awareness about environmental issues is pushing demand for eco-friendly packaging solutions.
- Regulatory Push: Government regulations and initiatives promoting sustainable packaging are encouraging the adoption of degradable materials.
- Technological Advancements: Continuous innovation in biodegradable and compostable materials is improving their performance and cost-competitiveness.
- Key Drivers:
The Airplane application segment, while smaller in overall market share (estimated at 10%), is a niche market characterized by stringent hygiene and safety standards, and specialized tray requirements. The Others segment, encompassing diverse applications like institutional catering and event food service, contributes the remaining market share, driven by the need for versatile and customizable packaging solutions.
Meal Delivery Tray Product Developments
Product innovation in the meal delivery tray sector is primarily focused on enhancing sustainability, functionality, and aesthetic appeal. Companies are actively developing trays made from recycled content, biodegradable polymers, and plant-based materials to meet growing environmental concerns. Advancements in material science are leading to trays with improved thermal insulation, leak resistance, and durability. The integration of features such as segmented compartments for keeping different food items separate, vented lids for optimal steam release, and tamper-evident seals are also key development areas. These innovations provide competitive advantages by offering enhanced food presentation, extended shelf life, and a superior consumer experience, aligning with market demands for both convenience and eco-consciousness.
Report Scope & Segmentation Analysis
The global Meal Delivery Tray market is comprehensively segmented by Application and Type.
- Application: The Take-out Food segment is projected to witness sustained growth, driven by the expanding food delivery ecosystem. The Restaurant segment remains a core market, with ongoing demand from traditional dining establishments. The Airplane segment, though niche, requires specialized, high-performance trays, and the Others segment, encompassing various catering and institutional needs, offers diverse opportunities.
- Type: PP Plastic continues to be a dominant material due to its cost-effectiveness and functional properties. Degradable Material is the fastest-growing segment, spurred by environmental consciousness and regulatory support. Disposable Foamed Plastics offer lightweight and insulating properties, while Paper trays are gaining traction as a more sustainable alternative. Aluminum Foil trays are utilized for specific applications requiring high heat retention. The Others category includes emerging materials and hybrid solutions.
Key Drivers of Meal Delivery Tray Growth
The Meal Delivery Tray market is propelled by several key drivers. The burgeoning convenience economy is a significant factor, with consumers increasingly opting for ready-to-eat meals delivered to their homes or offices. Technological advancements in food packaging materials are enabling the creation of more sustainable, durable, and food-safe trays, catering to evolving consumer preferences. Regulatory frameworks, such as those promoting recyclable and compostable packaging, are also acting as a strong impetus for market growth, pushing manufacturers towards eco-friendly solutions. Furthermore, the expansion of the global food service industry, particularly the rapid growth of online food delivery platforms, directly translates to increased demand for meal delivery trays.
Challenges in the Meal Delivery Tray Sector
Despite robust growth, the Meal Delivery Tray sector faces several challenges. Stringent environmental regulations regarding single-use plastics, while driving innovation, can also increase production costs and necessitate significant investment in new infrastructure. Supply chain disruptions, stemming from raw material availability and geopolitical factors, can impact production timelines and cost-effectiveness. Intense competitive pressures from both established players and emerging manufacturers lead to price wars and the need for continuous innovation to maintain market share. The volatility of raw material prices, particularly for plastics and paper pulp, poses a significant challenge to maintaining stable profit margins. Consumer demand for sustainable options also creates pressure to transition away from traditional, less eco-friendly materials, which can be a costly and complex undertaking.
Emerging Opportunities in Meal Delivery Tray
Emerging opportunities in the Meal Delivery Tray market lie in the burgeoning demand for sustainable and compostable packaging solutions. The development of innovative bio-based materials derived from sources like cornstarch or sugarcane presents a significant growth avenue. The integration of smart packaging technologies, such as QR codes for nutritional information or temperature indicators, offers opportunities for value-added products. Furthermore, the expansion of ghost kitchens and meal kit delivery services creates a growing need for specialized and customizable meal delivery trays. Opportunities also exist in developing trays for specific dietary needs or for specialized cuisines that require unique packaging formats.
Leading Players in the Meal Delivery Tray Market
- Quinn Packaging
- Genpak, LLC
- Faerch
- Cambro
- Sonoco Products
- Sabert Corporation
- Bemis (Amcor)
- Portage Plastics Corporation
- Placon
- Silver Plastics
- CiMa-Pak
- Huhtamaki
- Versatile Packaging
- CMActive
- RPC Group (Berry Global Group)
- DS Smith
Key Developments in Meal Delivery Tray Industry
- 2023: Introduction of advanced biodegradable meal trays with enhanced thermal properties.
- 2023: Strategic partnership formed between leading packaging manufacturers to bolster sustainable material sourcing.
- 2023: Launch of new compostable meal tray lines designed for hot and cold food applications.
- 2022: Acquisition of a specialized biodegradable packaging firm by a major player to expand eco-friendly product portfolio.
- 2022: Development of innovative meal trays with integrated tamper-evident seals for enhanced food safety.
- 2022: Increased investment in R&D for plant-based packaging alternatives.
- 2021: Significant expansion of production capacity for recyclable meal delivery trays.
- 2021: Introduction of lightweight, durable meal trays for the airline catering sector.
- 2020: Growth in demand for modular meal tray designs for meal kit services.
- 2020: Increased focus on reusable meal tray solutions in select markets.
Strategic Outlook for Meal Delivery Tray Market
The strategic outlook for the Meal Delivery Tray market is overwhelmingly positive, driven by sustained demand from the convenience food sector and a strong push towards sustainability. Key growth catalysts include continued innovation in eco-friendly materials, the increasing adoption of advanced manufacturing techniques, and the expansion of online food delivery services globally. Companies that prioritize the development of compostable, recyclable, and reusable meal tray solutions, while also offering functional benefits like superior insulation and durability, are well-positioned for future success. Strategic collaborations and targeted M&A activities will likely continue to shape the competitive landscape, enabling companies to expand their product portfolios and market reach. The market is expected to witness a shift towards higher-value, premium packaging solutions that cater to both consumer preferences and environmental responsibility.
Meal Delivery Tray Segmentation
-
1. Application
- 1.1. Take-out Food
- 1.2. Restaurant
- 1.3. Airplane
- 1.4. Others
-
2. Type
- 2.1. Disposable Foamed Plastics
- 2.2. PP Plastic
- 2.3. Paper
- 2.4. Degradable Material
- 2.5. Aluminum Foil
- 2.6. Others
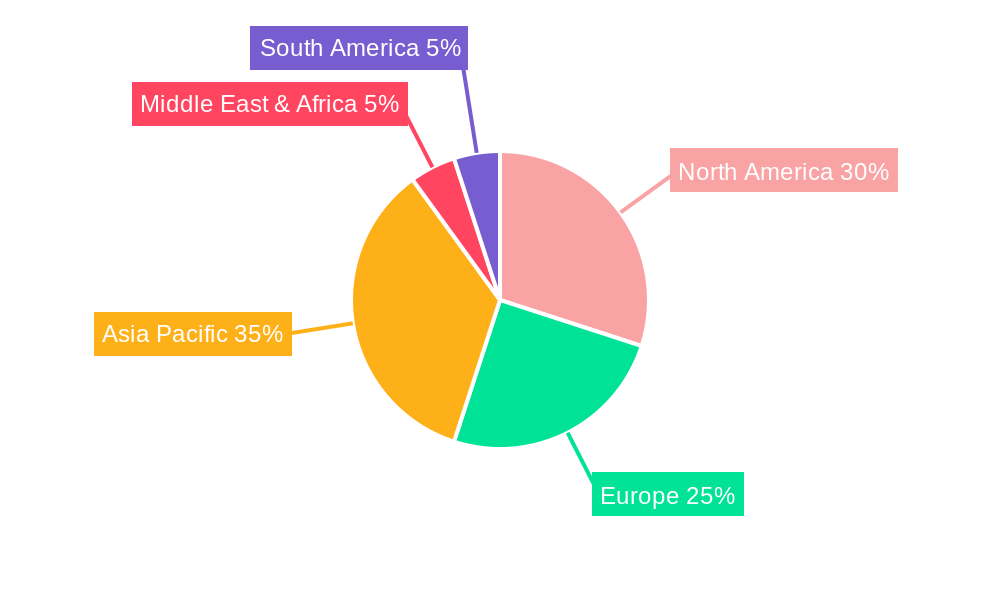
Meal Delivery Tray Segmentation By Geography
-
1. North America
- 1.1. United States
- 1.2. Canada
- 1.3. Mexico
-
2. South America
- 2.1. Brazil
- 2.2. Argentina
- 2.3. Rest of South America
-
3. Europe
- 3.1. United Kingdom
- 3.2. Germany
- 3.3. France
- 3.4. Italy
- 3.5. Spain
- 3.6. Russia
- 3.7. Benelux
- 3.8. Nordics
- 3.9. Rest of Europe
-
4. Middle East & Africa
- 4.1. Turkey
- 4.2. Israel
- 4.3. GCC
- 4.4. North Africa
- 4.5. South Africa
- 4.6. Rest of Middle East & Africa
-
5. Asia Pacific
- 5.1. China
- 5.2. India
- 5.3. Japan
- 5.4. South Korea
- 5.5. ASEAN
- 5.6. Oceania
- 5.7. Rest of Asia Pacific
Meal Delivery Tray REPORT HIGHLIGHTS
| Aspects | Details |
|---|---|
| Study Period | 2019-2033 |
| Base Year | 2024 |
| Estimated Year | 2025 |
| Forecast Period | 2025-2033 |
| Historical Period | 2019-2024 |
| Growth Rate | CAGR of XXX% from 2019-2033 |
| Segmentation |
|
Table of Contents
- 1. Introduction
- 1.1. Research Scope
- 1.2. Market Segmentation
- 1.3. Research Methodology
- 1.4. Definitions and Assumptions
- 2. Executive Summary
- 2.1. Introduction
- 3. Market Dynamics
- 3.1. Introduction
- 3.2. Market Drivers
- 3.3. Market Restrains
- 3.4. Market Trends
- 4. Market Factor Analysis
- 4.1. Porters Five Forces
- 4.2. Supply/Value Chain
- 4.3. PESTEL analysis
- 4.4. Market Entropy
- 4.5. Patent/Trademark Analysis
- 5. Global Meal Delivery Tray Analysis, Insights and Forecast, 2019-2031
- 5.1. Market Analysis, Insights and Forecast - by Application
- 5.1.1. Take-out Food
- 5.1.2. Restaurant
- 5.1.3. Airplane
- 5.1.4. Others
- 5.2. Market Analysis, Insights and Forecast - by Type
- 5.2.1. Disposable Foamed Plastics
- 5.2.2. PP Plastic
- 5.2.3. Paper
- 5.2.4. Degradable Material
- 5.2.5. Aluminum Foil
- 5.2.6. Others
- 5.3. Market Analysis, Insights and Forecast - by Region
- 5.3.1. North America
- 5.3.2. South America
- 5.3.3. Europe
- 5.3.4. Middle East & Africa
- 5.3.5. Asia Pacific
- 5.1. Market Analysis, Insights and Forecast - by Application
- 6. North America Meal Delivery Tray Analysis, Insights and Forecast, 2019-2031
- 6.1. Market Analysis, Insights and Forecast - by Application
- 6.1.1. Take-out Food
- 6.1.2. Restaurant
- 6.1.3. Airplane
- 6.1.4. Others
- 6.2. Market Analysis, Insights and Forecast - by Type
- 6.2.1. Disposable Foamed Plastics
- 6.2.2. PP Plastic
- 6.2.3. Paper
- 6.2.4. Degradable Material
- 6.2.5. Aluminum Foil
- 6.2.6. Others
- 6.1. Market Analysis, Insights and Forecast - by Application
- 7. South America Meal Delivery Tray Analysis, Insights and Forecast, 2019-2031
- 7.1. Market Analysis, Insights and Forecast - by Application
- 7.1.1. Take-out Food
- 7.1.2. Restaurant
- 7.1.3. Airplane
- 7.1.4. Others
- 7.2. Market Analysis, Insights and Forecast - by Type
- 7.2.1. Disposable Foamed Plastics
- 7.2.2. PP Plastic
- 7.2.3. Paper
- 7.2.4. Degradable Material
- 7.2.5. Aluminum Foil
- 7.2.6. Others
- 7.1. Market Analysis, Insights and Forecast - by Application
- 8. Europe Meal Delivery Tray Analysis, Insights and Forecast, 2019-2031
- 8.1. Market Analysis, Insights and Forecast - by Application
- 8.1.1. Take-out Food
- 8.1.2. Restaurant
- 8.1.3. Airplane
- 8.1.4. Others
- 8.2. Market Analysis, Insights and Forecast - by Type
- 8.2.1. Disposable Foamed Plastics
- 8.2.2. PP Plastic
- 8.2.3. Paper
- 8.2.4. Degradable Material
- 8.2.5. Aluminum Foil
- 8.2.6. Others
- 8.1. Market Analysis, Insights and Forecast - by Application
- 9. Middle East & Africa Meal Delivery Tray Analysis, Insights and Forecast, 2019-2031
- 9.1. Market Analysis, Insights and Forecast - by Application
- 9.1.1. Take-out Food
- 9.1.2. Restaurant
- 9.1.3. Airplane
- 9.1.4. Others
- 9.2. Market Analysis, Insights and Forecast - by Type
- 9.2.1. Disposable Foamed Plastics
- 9.2.2. PP Plastic
- 9.2.3. Paper
- 9.2.4. Degradable Material
- 9.2.5. Aluminum Foil
- 9.2.6. Others
- 9.1. Market Analysis, Insights and Forecast - by Application
- 10. Asia Pacific Meal Delivery Tray Analysis, Insights and Forecast, 2019-2031
- 10.1. Market Analysis, Insights and Forecast - by Application
- 10.1.1. Take-out Food
- 10.1.2. Restaurant
- 10.1.3. Airplane
- 10.1.4. Others
- 10.2. Market Analysis, Insights and Forecast - by Type
- 10.2.1. Disposable Foamed Plastics
- 10.2.2. PP Plastic
- 10.2.3. Paper
- 10.2.4. Degradable Material
- 10.2.5. Aluminum Foil
- 10.2.6. Others
- 10.1. Market Analysis, Insights and Forecast - by Application
- 11. Competitive Analysis
- 11.1. Global Market Share Analysis 2024
- 11.2. Company Profiles
- 11.2.1 Quinn Packaging
- 11.2.1.1. Overview
- 11.2.1.2. Products
- 11.2.1.3. SWOT Analysis
- 11.2.1.4. Recent Developments
- 11.2.1.5. Financials (Based on Availability)
- 11.2.2 Genpak LLC
- 11.2.2.1. Overview
- 11.2.2.2. Products
- 11.2.2.3. SWOT Analysis
- 11.2.2.4. Recent Developments
- 11.2.2.5. Financials (Based on Availability)
- 11.2.3 Faerch
- 11.2.3.1. Overview
- 11.2.3.2. Products
- 11.2.3.3. SWOT Analysis
- 11.2.3.4. Recent Developments
- 11.2.3.5. Financials (Based on Availability)
- 11.2.4 Cambro
- 11.2.4.1. Overview
- 11.2.4.2. Products
- 11.2.4.3. SWOT Analysis
- 11.2.4.4. Recent Developments
- 11.2.4.5. Financials (Based on Availability)
- 11.2.5 Sonoco Products
- 11.2.5.1. Overview
- 11.2.5.2. Products
- 11.2.5.3. SWOT Analysis
- 11.2.5.4. Recent Developments
- 11.2.5.5. Financials (Based on Availability)
- 11.2.6 Sabert Corporation
- 11.2.6.1. Overview
- 11.2.6.2. Products
- 11.2.6.3. SWOT Analysis
- 11.2.6.4. Recent Developments
- 11.2.6.5. Financials (Based on Availability)
- 11.2.7 Bemis (Amcor)
- 11.2.7.1. Overview
- 11.2.7.2. Products
- 11.2.7.3. SWOT Analysis
- 11.2.7.4. Recent Developments
- 11.2.7.5. Financials (Based on Availability)
- 11.2.8 Portage Plastics Corporation
- 11.2.8.1. Overview
- 11.2.8.2. Products
- 11.2.8.3. SWOT Analysis
- 11.2.8.4. Recent Developments
- 11.2.8.5. Financials (Based on Availability)
- 11.2.9 Placon
- 11.2.9.1. Overview
- 11.2.9.2. Products
- 11.2.9.3. SWOT Analysis
- 11.2.9.4. Recent Developments
- 11.2.9.5. Financials (Based on Availability)
- 11.2.10 Silver Plastics
- 11.2.10.1. Overview
- 11.2.10.2. Products
- 11.2.10.3. SWOT Analysis
- 11.2.10.4. Recent Developments
- 11.2.10.5. Financials (Based on Availability)
- 11.2.11 CiMa-Pak
- 11.2.11.1. Overview
- 11.2.11.2. Products
- 11.2.11.3. SWOT Analysis
- 11.2.11.4. Recent Developments
- 11.2.11.5. Financials (Based on Availability)
- 11.2.12 Huhtamaki
- 11.2.12.1. Overview
- 11.2.12.2. Products
- 11.2.12.3. SWOT Analysis
- 11.2.12.4. Recent Developments
- 11.2.12.5. Financials (Based on Availability)
- 11.2.13 Versatile Packaging
- 11.2.13.1. Overview
- 11.2.13.2. Products
- 11.2.13.3. SWOT Analysis
- 11.2.13.4. Recent Developments
- 11.2.13.5. Financials (Based on Availability)
- 11.2.14 CMActive
- 11.2.14.1. Overview
- 11.2.14.2. Products
- 11.2.14.3. SWOT Analysis
- 11.2.14.4. Recent Developments
- 11.2.14.5. Financials (Based on Availability)
- 11.2.15 RPC Group (Berry Global Group)
- 11.2.15.1. Overview
- 11.2.15.2. Products
- 11.2.15.3. SWOT Analysis
- 11.2.15.4. Recent Developments
- 11.2.15.5. Financials (Based on Availability)
- 11.2.16 DS Smith
- 11.2.16.1. Overview
- 11.2.16.2. Products
- 11.2.16.3. SWOT Analysis
- 11.2.16.4. Recent Developments
- 11.2.16.5. Financials (Based on Availability)
- 11.2.1 Quinn Packaging
List of Figures
- Figure 1: Global Meal Delivery Tray Revenue Breakdown (million, %) by Region 2024 & 2032
- Figure 2: North America Meal Delivery Tray Revenue (million), by Application 2024 & 2032
- Figure 3: North America Meal Delivery Tray Revenue Share (%), by Application 2024 & 2032
- Figure 4: North America Meal Delivery Tray Revenue (million), by Type 2024 & 2032
- Figure 5: North America Meal Delivery Tray Revenue Share (%), by Type 2024 & 2032
- Figure 6: North America Meal Delivery Tray Revenue (million), by Country 2024 & 2032
- Figure 7: North America Meal Delivery Tray Revenue Share (%), by Country 2024 & 2032
- Figure 8: South America Meal Delivery Tray Revenue (million), by Application 2024 & 2032
- Figure 9: South America Meal Delivery Tray Revenue Share (%), by Application 2024 & 2032
- Figure 10: South America Meal Delivery Tray Revenue (million), by Type 2024 & 2032
- Figure 11: South America Meal Delivery Tray Revenue Share (%), by Type 2024 & 2032
- Figure 12: South America Meal Delivery Tray Revenue (million), by Country 2024 & 2032
- Figure 13: South America Meal Delivery Tray Revenue Share (%), by Country 2024 & 2032
- Figure 14: Europe Meal Delivery Tray Revenue (million), by Application 2024 & 2032
- Figure 15: Europe Meal Delivery Tray Revenue Share (%), by Application 2024 & 2032
- Figure 16: Europe Meal Delivery Tray Revenue (million), by Type 2024 & 2032
- Figure 17: Europe Meal Delivery Tray Revenue Share (%), by Type 2024 & 2032
- Figure 18: Europe Meal Delivery Tray Revenue (million), by Country 2024 & 2032
- Figure 19: Europe Meal Delivery Tray Revenue Share (%), by Country 2024 & 2032
- Figure 20: Middle East & Africa Meal Delivery Tray Revenue (million), by Application 2024 & 2032
- Figure 21: Middle East & Africa Meal Delivery Tray Revenue Share (%), by Application 2024 & 2032
- Figure 22: Middle East & Africa Meal Delivery Tray Revenue (million), by Type 2024 & 2032
- Figure 23: Middle East & Africa Meal Delivery Tray Revenue Share (%), by Type 2024 & 2032
- Figure 24: Middle East & Africa Meal Delivery Tray Revenue (million), by Country 2024 & 2032
- Figure 25: Middle East & Africa Meal Delivery Tray Revenue Share (%), by Country 2024 & 2032
- Figure 26: Asia Pacific Meal Delivery Tray Revenue (million), by Application 2024 & 2032
- Figure 27: Asia Pacific Meal Delivery Tray Revenue Share (%), by Application 2024 & 2032
- Figure 28: Asia Pacific Meal Delivery Tray Revenue (million), by Type 2024 & 2032
- Figure 29: Asia Pacific Meal Delivery Tray Revenue Share (%), by Type 2024 & 2032
- Figure 30: Asia Pacific Meal Delivery Tray Revenue (million), by Country 2024 & 2032
- Figure 31: Asia Pacific Meal Delivery Tray Revenue Share (%), by Country 2024 & 2032
List of Tables
- Table 1: Global Meal Delivery Tray Revenue million Forecast, by Region 2019 & 2032
- Table 2: Global Meal Delivery Tray Revenue million Forecast, by Application 2019 & 2032
- Table 3: Global Meal Delivery Tray Revenue million Forecast, by Type 2019 & 2032
- Table 4: Global Meal Delivery Tray Revenue million Forecast, by Region 2019 & 2032
- Table 5: Global Meal Delivery Tray Revenue million Forecast, by Application 2019 & 2032
- Table 6: Global Meal Delivery Tray Revenue million Forecast, by Type 2019 & 2032
- Table 7: Global Meal Delivery Tray Revenue million Forecast, by Country 2019 & 2032
- Table 8: United States Meal Delivery Tray Revenue (million) Forecast, by Application 2019 & 2032
- Table 9: Canada Meal Delivery Tray Revenue (million) Forecast, by Application 2019 & 2032
- Table 10: Mexico Meal Delivery Tray Revenue (million) Forecast, by Application 2019 & 2032
- Table 11: Global Meal Delivery Tray Revenue million Forecast, by Application 2019 & 2032
- Table 12: Global Meal Delivery Tray Revenue million Forecast, by Type 2019 & 2032
- Table 13: Global Meal Delivery Tray Revenue million Forecast, by Country 2019 & 2032
- Table 14: Brazil Meal Delivery Tray Revenue (million) Forecast, by Application 2019 & 2032
- Table 15: Argentina Meal Delivery Tray Revenue (million) Forecast, by Application 2019 & 2032
- Table 16: Rest of South America Meal Delivery Tray Revenue (million) Forecast, by Application 2019 & 2032
- Table 17: Global Meal Delivery Tray Revenue million Forecast, by Application 2019 & 2032
- Table 18: Global Meal Delivery Tray Revenue million Forecast, by Type 2019 & 2032
- Table 19: Global Meal Delivery Tray Revenue million Forecast, by Country 2019 & 2032
- Table 20: United Kingdom Meal Delivery Tray Revenue (million) Forecast, by Application 2019 & 2032
- Table 21: Germany Meal Delivery Tray Revenue (million) Forecast, by Application 2019 & 2032
- Table 22: France Meal Delivery Tray Revenue (million) Forecast, by Application 2019 & 2032
- Table 23: Italy Meal Delivery Tray Revenue (million) Forecast, by Application 2019 & 2032
- Table 24: Spain Meal Delivery Tray Revenue (million) Forecast, by Application 2019 & 2032
- Table 25: Russia Meal Delivery Tray Revenue (million) Forecast, by Application 2019 & 2032
- Table 26: Benelux Meal Delivery Tray Revenue (million) Forecast, by Application 2019 & 2032
- Table 27: Nordics Meal Delivery Tray Revenue (million) Forecast, by Application 2019 & 2032
- Table 28: Rest of Europe Meal Delivery Tray Revenue (million) Forecast, by Application 2019 & 2032
- Table 29: Global Meal Delivery Tray Revenue million Forecast, by Application 2019 & 2032
- Table 30: Global Meal Delivery Tray Revenue million Forecast, by Type 2019 & 2032
- Table 31: Global Meal Delivery Tray Revenue million Forecast, by Country 2019 & 2032
- Table 32: Turkey Meal Delivery Tray Revenue (million) Forecast, by Application 2019 & 2032
- Table 33: Israel Meal Delivery Tray Revenue (million) Forecast, by Application 2019 & 2032
- Table 34: GCC Meal Delivery Tray Revenue (million) Forecast, by Application 2019 & 2032
- Table 35: North Africa Meal Delivery Tray Revenue (million) Forecast, by Application 2019 & 2032
- Table 36: South Africa Meal Delivery Tray Revenue (million) Forecast, by Application 2019 & 2032
- Table 37: Rest of Middle East & Africa Meal Delivery Tray Revenue (million) Forecast, by Application 2019 & 2032
- Table 38: Global Meal Delivery Tray Revenue million Forecast, by Application 2019 & 2032
- Table 39: Global Meal Delivery Tray Revenue million Forecast, by Type 2019 & 2032
- Table 40: Global Meal Delivery Tray Revenue million Forecast, by Country 2019 & 2032
- Table 41: China Meal Delivery Tray Revenue (million) Forecast, by Application 2019 & 2032
- Table 42: India Meal Delivery Tray Revenue (million) Forecast, by Application 2019 & 2032
- Table 43: Japan Meal Delivery Tray Revenue (million) Forecast, by Application 2019 & 2032
- Table 44: South Korea Meal Delivery Tray Revenue (million) Forecast, by Application 2019 & 2032
- Table 45: ASEAN Meal Delivery Tray Revenue (million) Forecast, by Application 2019 & 2032
- Table 46: Oceania Meal Delivery Tray Revenue (million) Forecast, by Application 2019 & 2032
- Table 47: Rest of Asia Pacific Meal Delivery Tray Revenue (million) Forecast, by Application 2019 & 2032
Frequently Asked Questions
1. What is the projected Compound Annual Growth Rate (CAGR) of the Meal Delivery Tray?
The projected CAGR is approximately XXX%.
2. Which companies are prominent players in the Meal Delivery Tray?
Key companies in the market include Quinn Packaging, Genpak, LLC, Faerch, Cambro, Sonoco Products, Sabert Corporation, Bemis (Amcor), Portage Plastics Corporation, Placon, Silver Plastics, CiMa-Pak, Huhtamaki, Versatile Packaging, CMActive, RPC Group (Berry Global Group), DS Smith.
3. What are the main segments of the Meal Delivery Tray?
The market segments include Application, Type.
4. Can you provide details about the market size?
The market size is estimated to be USD XXX million as of 2022.
5. What are some drivers contributing to market growth?
N/A
6. What are the notable trends driving market growth?
N/A
7. Are there any restraints impacting market growth?
N/A
8. Can you provide examples of recent developments in the market?
N/A
9. What pricing options are available for accessing the report?
Pricing options include single-user, multi-user, and enterprise licenses priced at USD 4250.00, USD 6375.00, and USD 8500.00 respectively.
10. Is the market size provided in terms of value or volume?
The market size is provided in terms of value, measured in million.
11. Are there any specific market keywords associated with the report?
Yes, the market keyword associated with the report is "Meal Delivery Tray," which aids in identifying and referencing the specific market segment covered.
12. How do I determine which pricing option suits my needs best?
The pricing options vary based on user requirements and access needs. Individual users may opt for single-user licenses, while businesses requiring broader access may choose multi-user or enterprise licenses for cost-effective access to the report.
13. Are there any additional resources or data provided in the Meal Delivery Tray report?
While the report offers comprehensive insights, it's advisable to review the specific contents or supplementary materials provided to ascertain if additional resources or data are available.
14. How can I stay updated on further developments or reports in the Meal Delivery Tray?
To stay informed about further developments, trends, and reports in the Meal Delivery Tray, consider subscribing to industry newsletters, following relevant companies and organizations, or regularly checking reputable industry news sources and publications.
Methodology
Step 1 - Identification of Relevant Samples Size from Population Database


Step 2 - Approaches for Defining Global Market Size (Value, Volume* & Price*)

Note*: In applicable scenarios
Step 3 - Data Sources
Primary Research
- Web Analytics
- Survey Reports
- Research Institute
- Latest Research Reports
- Opinion Leaders
Secondary Research
- Annual Reports
- White Paper
- Latest Press Release
- Industry Association
- Paid Database
- Investor Presentations

Step 4 - Data Triangulation
Involves using different sources of information in order to increase the validity of a study
These sources are likely to be stakeholders in a program - participants, other researchers, program staff, other community members, and so on.
Then we put all data in single framework & apply various statistical tools to find out the dynamic on the market.
During the analysis stage, feedback from the stakeholder groups would be compared to determine areas of agreement as well as areas of divergence


