

Key Insights
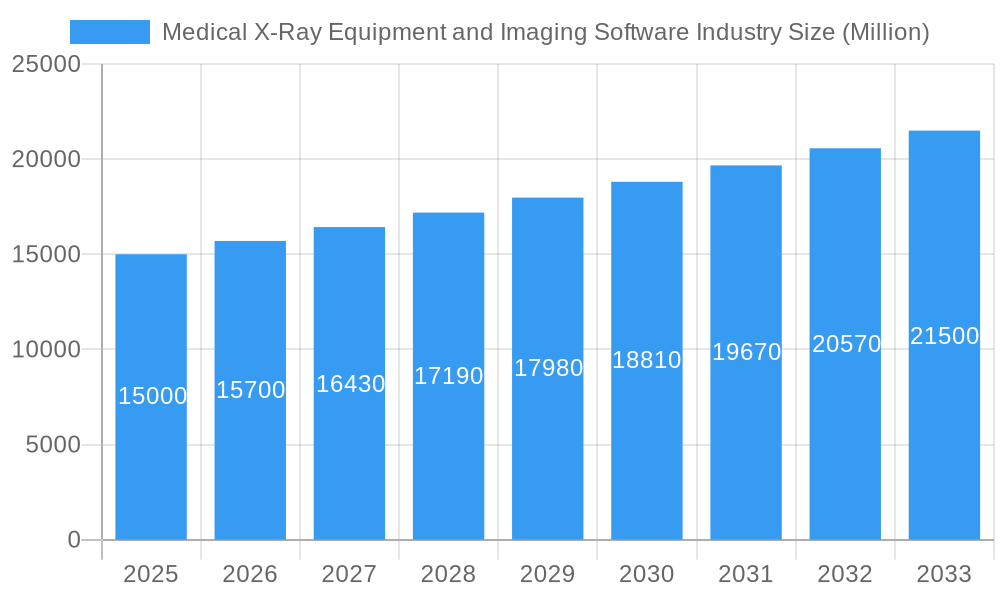
The global medical X-ray equipment and imaging software market is experiencing robust growth, projected to reach a substantial size by 2033. A compound annual growth rate (CAGR) of 4.60% from 2025 to 2033 indicates a consistent upward trajectory driven by several key factors. Technological advancements, particularly in digital radiography, computed tomography (CT), and fluoroscopy/angiography, are significantly enhancing image quality, reducing radiation exposure, and improving diagnostic accuracy. The rising prevalence of chronic diseases, an aging global population requiring more frequent screenings, and increasing healthcare expenditure in developing economies are further fueling market expansion. The increasing adoption of advanced imaging software for image processing, analysis, and storage contributes to this growth, enabling faster and more efficient diagnoses. Segmentation analysis reveals that the 3-Dimensional imaging segment, along with CT and fluoroscopy/angiography technologies, is expected to exhibit higher growth rates compared to other segments due to their superior diagnostic capabilities. The hospital segment dominates the end-user landscape, although diagnostic centers are experiencing significant growth as well, driven by increasing preference for outpatient diagnostics.
Medical X-Ray Equipment and Imaging Software Industry Market Size (In Billion)
While the market enjoys substantial growth, certain challenges persist. High initial investment costs associated with advanced X-ray equipment can pose a barrier to entry for smaller healthcare facilities. Furthermore, stringent regulatory approvals and compliance requirements for medical devices can slow down market penetration. Despite these restraints, the long-term outlook for the medical X-ray equipment and imaging software market remains positive, driven by ongoing innovation, increasing demand for improved diagnostic capabilities, and a growing focus on preventative healthcare. Leading players like Konica Minolta, Siemens Healthcare, Canon, and GE Healthcare are actively investing in R&D to develop innovative solutions and expand their market share, intensifying competition and driving further innovation within the industry. This competitive landscape fosters advancements that benefit both healthcare providers and patients.
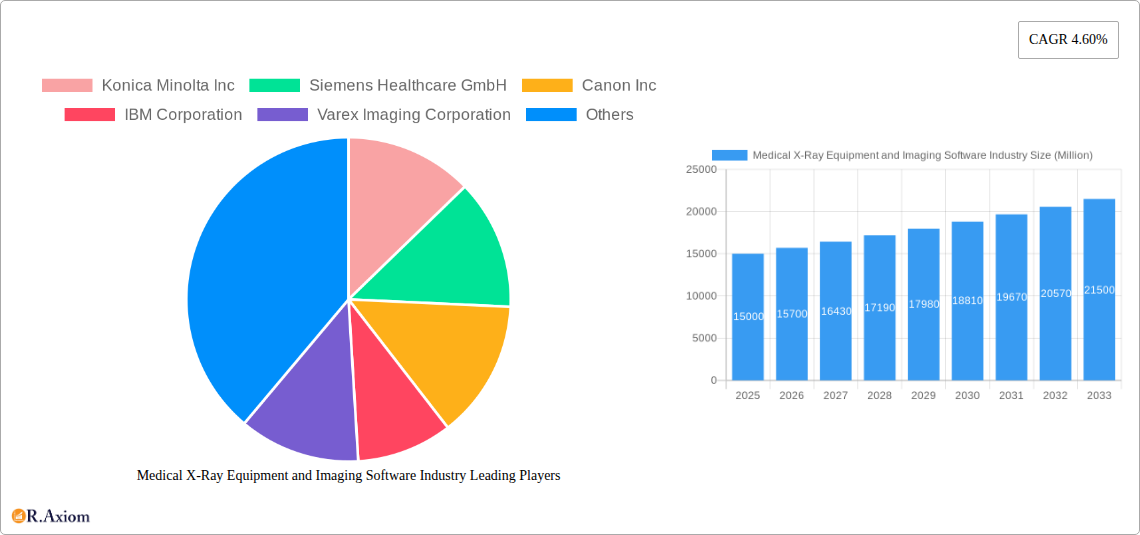
Medical X-Ray Equipment and Imaging Software Industry Company Market Share
This comprehensive report provides a detailed analysis of the Medical X-Ray Equipment and Imaging Software industry, covering market size, segmentation, key players, technological advancements, and future growth prospects. The study period spans from 2019 to 2033, with 2025 serving as the base and estimated year. The forecast period extends from 2025 to 2033, encompassing historical data from 2019 to 2024. This report is crucial for industry stakeholders, investors, and businesses seeking to understand and navigate this dynamic market.
Medical X-Ray Equipment and Imaging Software Industry Market Concentration & Innovation
The Medical X-Ray Equipment and Imaging Software market is moderately concentrated, with several major players holding significant market share. Konica Minolta Inc, Siemens Healthcare GmbH, Canon Inc, IBM Corporation, Varex Imaging Corporation, Hitachi Ltd, Shimadzu Corporation, Hologic Inc, Koninklijke Philips NV, GE Healthcare Inc, Carestream Health Inc, and Fujifilm Holdings Corporation are among the key players driving innovation and competition. Market share distribution varies across segments (equipment vs. software, technology types, and end-users), but the top 10 companies collectively control an estimated 75% of the global market (2024 data). The average M&A deal value in the industry over the past five years has been approximately $xx Million, indicating a high level of consolidation activity.
- Market Concentration: High, with top 10 players commanding 75% market share (2024).
- Innovation Drivers: Technological advancements (AI, 3D imaging), regulatory changes (safety & efficacy), increasing demand for advanced imaging solutions.
- Regulatory Frameworks: Stringent regulatory approvals (e.g., FDA, CE marking) impact product launch timelines and costs.
- Product Substitutes: Limited direct substitutes, but alternative diagnostic techniques (e.g., ultrasound, MRI) create indirect competition.
- End-User Trends: Growing preference for advanced imaging modalities, higher adoption of digital technologies, and increasing demand for remote diagnostic capabilities.
- M&A Activities: Significant consolidation through acquisitions and mergers to expand market reach and product portfolios. Average deal value: $xx Million (2019-2024).
Medical X-Ray Equipment and Imaging Software Industry Industry Trends & Insights
The Medical X-Ray Equipment and Imaging Software market exhibits robust growth, driven by several key factors. The global market is projected to reach $xx Million by 2033, expanding at a Compound Annual Growth Rate (CAGR) of xx% during the forecast period (2025-2033). Technological advancements, such as the integration of Artificial Intelligence (AI) for image analysis and the rise of 3D imaging technologies, are significantly disrupting the industry landscape. Increasing prevalence of chronic diseases, a growing aging population, and rising healthcare expenditure contribute to market expansion. Consumer preferences are shifting towards minimally invasive procedures and faster diagnostic turnaround times. Competitive dynamics are characterized by continuous product innovation, strategic partnerships, and geographical expansion. Market penetration of advanced imaging technologies (e.g., CT, Fluoroscopy) is increasing steadily, particularly in developing economies.
Dominant Markets & Segments in Medical X-Ray Equipment and Imaging Software Industry
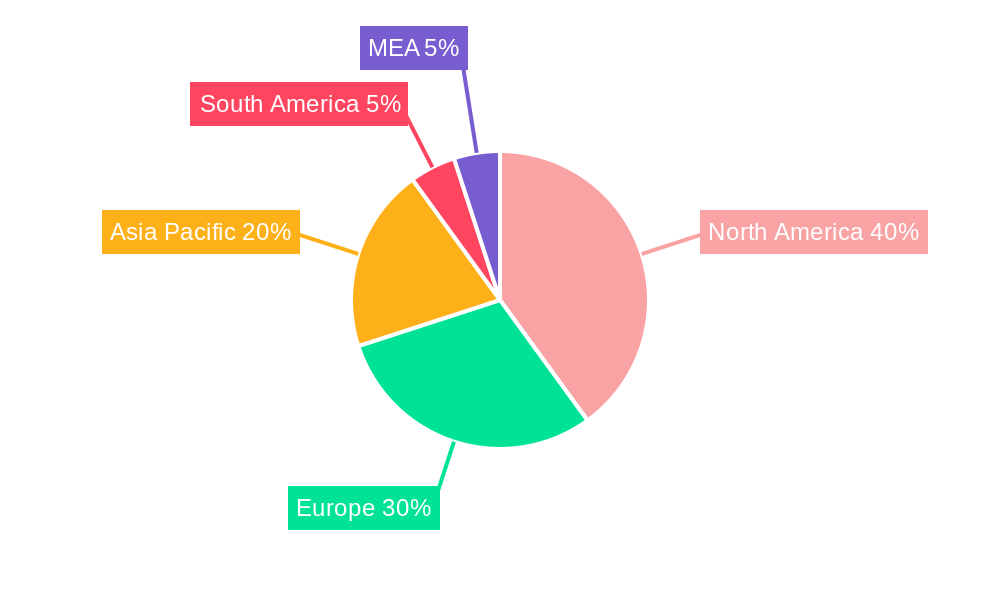
The global Medical X-Ray Equipment and Imaging Software market is experiencing robust growth, with North America currently leading in market share, attributed to its advanced healthcare infrastructure, substantial healthcare expenditure, and early adoption of innovative technologies. Europe follows closely, driven by stringent quality standards, a growing demand for sophisticated imaging solutions, and well-established healthcare systems. The Asia-Pacific region presents a significant growth opportunity, fueled by a burgeoning population, increasing healthcare investments, and a rising incidence of lifestyle-related and chronic diseases. Emerging economies within these regions are actively expanding their healthcare facilities, further boosting demand.
- By Type: The Equipment segment continues to hold a commanding market share, benefiting from the continuous development and adoption of advanced hardware. However, the Software segment is exhibiting a faster growth trajectory, largely propelled by the integration of artificial intelligence (AI), machine learning (ML), and cloud-based solutions for enhanced diagnostics and workflow optimization. Within equipment, 3-Dimensional imaging technologies are outpacing the growth of 2-Dimensional imaging due to their superior diagnostic capabilities.
- By Technology: Computed Tomography (CT) remains the largest segment, offering unparalleled cross-sectional imaging capabilities for a wide range of pathologies. Radiography/Mammography systems are also substantial, with ongoing advancements in detector technology and dose reduction. Fluoroscopy/Angiography systems are crucial for real-time imaging in interventional procedures.
- By End-user: Hospitals represent the largest end-user segment, owing to their comprehensive healthcare services and significant investment in advanced medical imaging. Diagnostic Imaging Centers are another major segment, catering to specialized imaging needs. Research Centers and Academic Institutions also contribute to the market, utilizing these technologies for clinical research and training.
Key Market Drivers and Regional Nuances:
- North America: Its dominance is underpinned by its robust healthcare ecosystem, high disposable income supporting advanced medical treatments, and a proactive approach to integrating cutting-edge technologies like AI in diagnostics.
- Europe: A combination of progressive healthcare policies, a strong emphasis on patient safety leading to demand for low-radiation technologies, and a well-funded healthcare system drives market growth.
- Asia-Pacific: Rapid economic development, increasing awareness of preventive healthcare, a large and aging population, and a growing burden of chronic diseases are significant growth catalysts. Government initiatives to enhance healthcare accessibility and affordability are also playing a crucial role.
Medical X-Ray Equipment and Imaging Software Industry Product Developments
The landscape of Medical X-Ray Equipment and Imaging Software is continuously evolving, driven by a relentless pursuit of innovation. Recent product advancements are primarily focused on several key areas: enhancing diagnostic accuracy through superior image quality, minimizing patient and operator risk via significant reduction in radiation exposure, streamlining clinical workflows for increased efficiency, and embedding sophisticated AI-powered diagnostic tools for automated analysis and early disease detection. The emergence of compact and advanced mobile X-ray systems is transforming point-of-care diagnostics, offering unprecedented portability and ease of use in diverse clinical settings, including emergency rooms and intensive care units. Simultaneously, cutting-edge software solutions are enabling enhanced capabilities such as remote diagnostics, collaborative image interpretation, and personalized treatment planning, thereby expanding access to expert medical insights. These collective developments are not only elevating the precision, speed, and user-friendliness of medical imaging but are also creating a distinct competitive advantage for companies at the forefront of technological innovation.
Report Scope & Segmentation Analysis
This comprehensive report meticulously analyzes the Medical X-Ray Equipment and Imaging Software market, offering in-depth insights into its various facets. The market is segmented based on critical parameters including Type (Equipment, Software), Dimensionality (2-Dimensional, 3-Dimensional), Technology (Radiography/Mammography, Computed Tomography, Fluoroscopy/Angiography), and End-user (Hospitals, Diagnostic Centers, Research Centers). Each segment is thoroughly examined, providing detailed assessments of its current market size, projected growth trajectories, and the competitive dynamics at play. The equipment segment is projected to expand at a significant CAGR of approximately [Insert CAGR Here]%, propelled by the escalating demand for sophisticated and high-resolution imaging systems across healthcare facilities worldwide. Concurrently, the software segment is anticipated to experience substantial growth, largely driven by the pervasive integration of AI for enhanced diagnostic capabilities and the increasing adoption of remote diagnostic solutions, expanding the reach and efficiency of medical imaging services.
Key Drivers of Medical X-Ray Equipment and Imaging Software Industry Growth
The medical X-ray equipment and imaging software industry is experiencing robust expansion driven by a confluence of powerful factors. Foremost among these are rapid technological advancements, with a particular emphasis on the transformative potential of Artificial Intelligence (AI) in image analysis and the increasing sophistication of 3D imaging technologies, which offer more detailed anatomical insights. The continuing trend of an aging global population, coupled with the escalating prevalence of chronic diseases such as cancer, cardiovascular conditions, and neurological disorders, is significantly boosting the demand for timely and accurate diagnostic imaging services. Furthermore, a noticeable increase in healthcare expenditure, especially in emerging economies striving to enhance their healthcare infrastructure, acts as a substantial catalyst for market growth. The presence of favorable regulatory environments in key markets and proactive government initiatives aimed at improving healthcare access and infrastructure also contribute significantly to the upward trajectory of the industry.
Challenges in the Medical X-Ray Equipment and Imaging Software Industry Sector
Stringent regulatory requirements and lengthy approval processes pose challenges to market entry and product launches. Supply chain disruptions can impact the availability of essential components. High initial investment costs for advanced imaging systems and intense competition among established players create significant barriers. The average cost of developing and launching a new imaging system is approximately $xx Million, which acts as a deterrent for smaller firms.
Emerging Opportunities in Medical X-Ray Equipment and Imaging Software Industry
Emerging markets in developing countries present significant growth opportunities. The integration of AI and machine learning in medical imaging offers potential for improved diagnostic accuracy and efficiency. Developments in cloud-based imaging solutions facilitate remote diagnostics and improve access to care, particularly in remote areas. Personalization of diagnostic imaging solutions according to individual patient needs is an area with future market potential.
Leading Players in the Medical X-Ray Equipment and Imaging Software Industry Market
- Konica Minolta Inc
- Siemens Healthcare GmbH
- Canon Inc
- IBM Corporation
- Varex Imaging Corporation
- Hitachi Ltd
- Shimadzu Corporation
- Hologic Inc
- Koninklijke Philips NV
- GE Healthcare Inc
- Carestream Health Inc
- Fujifilm Holdings Corporation
Key Developments in Medical X-Ray Equipment and Imaging Software Industry Industry
- July 2023: Shimadzu Corporation has introduced the MobileDaRt Evolution MX8 version k type mobile X-ray system, a notable advancement that incorporates Dynamic Digital Radiography (DDR) capabilities, offering enhanced visualization of dynamic processes in real-time.
- May 2023: Carestream Health has expanded its comprehensive mobile X-ray portfolio with the introduction of the DRX-Rise Mobile X-ray System, designed to provide versatile and efficient imaging solutions at the point of patient care.
Strategic Outlook for Medical X-Ray Equipment and Imaging Software Industry Market
The Medical X-Ray Equipment and Imaging Software market is poised for continued growth, driven by technological innovation, increasing healthcare spending, and a growing aging population. Strategic partnerships, mergers and acquisitions, and geographical expansion will shape the competitive landscape. The integration of AI and cloud-based solutions will significantly influence market dynamics in the coming years. Focus on enhanced image quality, reduced radiation exposure, and improved workflow efficiency will be key success factors.
Medical X-Ray Equipment and Imaging Software Industry Segmentation
-
1. Type
- 1.1. Equipment
- 1.2. Software
-
2. Technology
- 2.1. Radiography/Mammography
- 2.2. Computed Tomography
- 2.3. Fluoroscopy/Angiography
-
3. Image Type
- 3.1. 2-Dimensional
- 3.2. 3-Dimensional
-
4. End-user
- 4.1. Hospitals
- 4.2. Diagnostic Centers
- 4.3. Research Centers
Medical X-Ray Equipment and Imaging Software Industry Segmentation By Geography
- 1. North America
- 2. Europe
- 3. Asia
- 4. Australia and New Zealand
- 5. Middle East and Africa
- 6. Latin America
Medical X-Ray Equipment and Imaging Software Industry Regional Market Share
Geographic Coverage of Medical X-Ray Equipment and Imaging Software Industry
Medical X-Ray Equipment and Imaging Software Industry REPORT HIGHLIGHTS
| Aspects | Details |
|---|---|
| Study Period | 2020-2034 |
| Base Year | 2025 |
| Estimated Year | 2026 |
| Forecast Period | 2026-2034 |
| Historical Period | 2020-2025 |
| Growth Rate | CAGR of 4.60% from 2020-2034 |
| Segmentation |
|
Table of Contents
- 1. Introduction
- 1.1. Research Scope
- 1.2. Market Segmentation
- 1.3. Research Objective
- 1.4. Definitions and Assumptions
- 2. Executive Summary
- 2.1. Market Snapshot
- 3. Market Dynamics
- 3.1. Market Drivers
- 3.2. Market Restrains
- 3.3. Market Trends
- 3.4. Market Opportunities
- 4. Market Factor Analysis
- 4.1. Porters Five Forces
- 4.1.1. Bargaining Power of Suppliers
- 4.1.2. Bargaining Power of Buyers
- 4.1.3. Threat of New Entrants
- 4.1.4. Threat of Substitutes
- 4.1.5. Competitive Rivalry
- 4.2. PESTEL analysis
- 4.3. BCG Analysis
- 4.3.1. Stars (High Growth, High Market Share)
- 4.3.2. Cash Cows (Low Growth, High Market Share)
- 4.3.3. Question Mark (High Growth, Low Market Share)
- 4.3.4. Dogs (Low Growth, Low Market Share)
- 4.4. Ansoff Matrix Analysis
- 4.5. Supply Chain Analysis
- 4.6. Regulatory Landscape
- 4.7. Current Market Potential and Opportunity Assessment (TAM–SAM–SOM Framework)
- 4.8. RAX Analyst Note
- 4.1. Porters Five Forces
- 5. Market Analysis, Insights and Forecast 2021-2033
- 5.1. Market Analysis, Insights and Forecast - by Type
- 5.1.1. Equipment
- 5.1.2. Software
- 5.2. Market Analysis, Insights and Forecast - by Technology
- 5.2.1. Radiography/Mammography
- 5.2.2. Computed Tomography
- 5.2.3. Fluoroscopy/Angiography
- 5.3. Market Analysis, Insights and Forecast - by Image Type
- 5.3.1. 2-Dimensional
- 5.3.2. 3-Dimensional
- 5.4. Market Analysis, Insights and Forecast - by End-user
- 5.4.1. Hospitals
- 5.4.2. Diagnostic Centers
- 5.4.3. Research Centers
- 5.5. Market Analysis, Insights and Forecast - by Region
- 5.5.1. North America
- 5.5.2. Europe
- 5.5.3. Asia
- 5.5.4. Australia and New Zealand
- 5.5.5. Middle East and Africa
- 5.5.6. Latin America
- 5.1. Market Analysis, Insights and Forecast - by Type
- 6. Global Medical X-Ray Equipment and Imaging Software Industry Analysis, Insights and Forecast, 2021-2033
- 6.1. Market Analysis, Insights and Forecast - by Type
- 6.1.1. Equipment
- 6.1.2. Software
- 6.2. Market Analysis, Insights and Forecast - by Technology
- 6.2.1. Radiography/Mammography
- 6.2.2. Computed Tomography
- 6.2.3. Fluoroscopy/Angiography
- 6.3. Market Analysis, Insights and Forecast - by Image Type
- 6.3.1. 2-Dimensional
- 6.3.2. 3-Dimensional
- 6.4. Market Analysis, Insights and Forecast - by End-user
- 6.4.1. Hospitals
- 6.4.2. Diagnostic Centers
- 6.4.3. Research Centers
- 6.1. Market Analysis, Insights and Forecast - by Type
- 7. North America Medical X-Ray Equipment and Imaging Software Industry Analysis, Insights and Forecast, 2020-2032
- 7.1. Market Analysis, Insights and Forecast - by Type
- 7.1.1. Equipment
- 7.1.2. Software
- 7.2. Market Analysis, Insights and Forecast - by Technology
- 7.2.1. Radiography/Mammography
- 7.2.2. Computed Tomography
- 7.2.3. Fluoroscopy/Angiography
- 7.3. Market Analysis, Insights and Forecast - by Image Type
- 7.3.1. 2-Dimensional
- 7.3.2. 3-Dimensional
- 7.4. Market Analysis, Insights and Forecast - by End-user
- 7.4.1. Hospitals
- 7.4.2. Diagnostic Centers
- 7.4.3. Research Centers
- 7.1. Market Analysis, Insights and Forecast - by Type
- 8. Europe Medical X-Ray Equipment and Imaging Software Industry Analysis, Insights and Forecast, 2020-2032
- 8.1. Market Analysis, Insights and Forecast - by Type
- 8.1.1. Equipment
- 8.1.2. Software
- 8.2. Market Analysis, Insights and Forecast - by Technology
- 8.2.1. Radiography/Mammography
- 8.2.2. Computed Tomography
- 8.2.3. Fluoroscopy/Angiography
- 8.3. Market Analysis, Insights and Forecast - by Image Type
- 8.3.1. 2-Dimensional
- 8.3.2. 3-Dimensional
- 8.4. Market Analysis, Insights and Forecast - by End-user
- 8.4.1. Hospitals
- 8.4.2. Diagnostic Centers
- 8.4.3. Research Centers
- 8.1. Market Analysis, Insights and Forecast - by Type
- 9. Asia Medical X-Ray Equipment and Imaging Software Industry Analysis, Insights and Forecast, 2020-2032
- 9.1. Market Analysis, Insights and Forecast - by Type
- 9.1.1. Equipment
- 9.1.2. Software
- 9.2. Market Analysis, Insights and Forecast - by Technology
- 9.2.1. Radiography/Mammography
- 9.2.2. Computed Tomography
- 9.2.3. Fluoroscopy/Angiography
- 9.3. Market Analysis, Insights and Forecast - by Image Type
- 9.3.1. 2-Dimensional
- 9.3.2. 3-Dimensional
- 9.4. Market Analysis, Insights and Forecast - by End-user
- 9.4.1. Hospitals
- 9.4.2. Diagnostic Centers
- 9.4.3. Research Centers
- 9.1. Market Analysis, Insights and Forecast - by Type
- 10. Australia and New Zealand Medical X-Ray Equipment and Imaging Software Industry Analysis, Insights and Forecast, 2020-2032
- 10.1. Market Analysis, Insights and Forecast - by Type
- 10.1.1. Equipment
- 10.1.2. Software
- 10.2. Market Analysis, Insights and Forecast - by Technology
- 10.2.1. Radiography/Mammography
- 10.2.2. Computed Tomography
- 10.2.3. Fluoroscopy/Angiography
- 10.3. Market Analysis, Insights and Forecast - by Image Type
- 10.3.1. 2-Dimensional
- 10.3.2. 3-Dimensional
- 10.4. Market Analysis, Insights and Forecast - by End-user
- 10.4.1. Hospitals
- 10.4.2. Diagnostic Centers
- 10.4.3. Research Centers
- 10.1. Market Analysis, Insights and Forecast - by Type
- 11. Middle East and Africa Medical X-Ray Equipment and Imaging Software Industry Analysis, Insights and Forecast, 2020-2032
- 11.1. Market Analysis, Insights and Forecast - by Type
- 11.1.1. Equipment
- 11.1.2. Software
- 11.2. Market Analysis, Insights and Forecast - by Technology
- 11.2.1. Radiography/Mammography
- 11.2.2. Computed Tomography
- 11.2.3. Fluoroscopy/Angiography
- 11.3. Market Analysis, Insights and Forecast - by Image Type
- 11.3.1. 2-Dimensional
- 11.3.2. 3-Dimensional
- 11.4. Market Analysis, Insights and Forecast - by End-user
- 11.4.1. Hospitals
- 11.4.2. Diagnostic Centers
- 11.4.3. Research Centers
- 11.1. Market Analysis, Insights and Forecast - by Type
- 12. Latin America Medical X-Ray Equipment and Imaging Software Industry Analysis, Insights and Forecast, 2020-2032
- 12.1. Market Analysis, Insights and Forecast - by Type
- 12.1.1. Equipment
- 12.1.2. Software
- 12.2. Market Analysis, Insights and Forecast - by Technology
- 12.2.1. Radiography/Mammography
- 12.2.2. Computed Tomography
- 12.2.3. Fluoroscopy/Angiography
- 12.3. Market Analysis, Insights and Forecast - by Image Type
- 12.3.1. 2-Dimensional
- 12.3.2. 3-Dimensional
- 12.4. Market Analysis, Insights and Forecast - by End-user
- 12.4.1. Hospitals
- 12.4.2. Diagnostic Centers
- 12.4.3. Research Centers
- 12.1. Market Analysis, Insights and Forecast - by Type
- 13. Competitive Analysis
- 13.1. Company Profiles
- 13.1.1 Konica Minolta Inc
- 13.1.1.1. Company Overview
- 13.1.1.2. Products
- 13.1.1.3. Company Financials
- 13.1.1.4. SWOT Analysis
- 13.1.2 Siemens Healthcare GmbH
- 13.1.2.1. Company Overview
- 13.1.2.2. Products
- 13.1.2.3. Company Financials
- 13.1.2.4. SWOT Analysis
- 13.1.3 Canon Inc
- 13.1.3.1. Company Overview
- 13.1.3.2. Products
- 13.1.3.3. Company Financials
- 13.1.3.4. SWOT Analysis
- 13.1.4 IBM Corporation
- 13.1.4.1. Company Overview
- 13.1.4.2. Products
- 13.1.4.3. Company Financials
- 13.1.4.4. SWOT Analysis
- 13.1.5 Varex Imaging Corporation
- 13.1.5.1. Company Overview
- 13.1.5.2. Products
- 13.1.5.3. Company Financials
- 13.1.5.4. SWOT Analysis
- 13.1.6 Hitachi Ltd
- 13.1.6.1. Company Overview
- 13.1.6.2. Products
- 13.1.6.3. Company Financials
- 13.1.6.4. SWOT Analysis
- 13.1.7 Shimazdu Corporation
- 13.1.7.1. Company Overview
- 13.1.7.2. Products
- 13.1.7.3. Company Financials
- 13.1.7.4. SWOT Analysis
- 13.1.8 Hologic Inc
- 13.1.8.1. Company Overview
- 13.1.8.2. Products
- 13.1.8.3. Company Financials
- 13.1.8.4. SWOT Analysis
- 13.1.9 Koninklijke Philips NV
- 13.1.9.1. Company Overview
- 13.1.9.2. Products
- 13.1.9.3. Company Financials
- 13.1.9.4. SWOT Analysis
- 13.1.10 GE Healthcare Inc
- 13.1.10.1. Company Overview
- 13.1.10.2. Products
- 13.1.10.3. Company Financials
- 13.1.10.4. SWOT Analysis
- 13.1.11 Carestream Health Inc
- 13.1.11.1. Company Overview
- 13.1.11.2. Products
- 13.1.11.3. Company Financials
- 13.1.11.4. SWOT Analysis
- 13.1.12 Fujifilm Holdings Corporation
- 13.1.12.1. Company Overview
- 13.1.12.2. Products
- 13.1.12.3. Company Financials
- 13.1.12.4. SWOT Analysis
- 13.1.1 Konica Minolta Inc
- 13.2. Market Entropy
- 13.2.1 Company's Key Areas Served
- 13.2.2 Recent Developments
- 13.3. Company Market Share Analysis 2025
- 13.3.1 Top 5 Companies Market Share Analysis
- 13.3.2 Top 3 Companies Market Share Analysis
- 13.4. List of Potential Customers
- 14. Research Methodology
List of Figures
- Figure 1: Global Medical X-Ray Equipment and Imaging Software Industry Revenue Breakdown (Million, %) by Region 2025 & 2033
- Figure 2: Global Medical X-Ray Equipment and Imaging Software Industry Volume Breakdown (K Unit, %) by Region 2025 & 2033
- Figure 3: North America Medical X-Ray Equipment and Imaging Software Industry Revenue (Million), by Type 2025 & 2033
- Figure 4: North America Medical X-Ray Equipment and Imaging Software Industry Volume (K Unit), by Type 2025 & 2033
- Figure 5: North America Medical X-Ray Equipment and Imaging Software Industry Revenue Share (%), by Type 2025 & 2033
- Figure 6: North America Medical X-Ray Equipment and Imaging Software Industry Volume Share (%), by Type 2025 & 2033
- Figure 7: North America Medical X-Ray Equipment and Imaging Software Industry Revenue (Million), by Technology 2025 & 2033
- Figure 8: North America Medical X-Ray Equipment and Imaging Software Industry Volume (K Unit), by Technology 2025 & 2033
- Figure 9: North America Medical X-Ray Equipment and Imaging Software Industry Revenue Share (%), by Technology 2025 & 2033
- Figure 10: North America Medical X-Ray Equipment and Imaging Software Industry Volume Share (%), by Technology 2025 & 2033
- Figure 11: North America Medical X-Ray Equipment and Imaging Software Industry Revenue (Million), by Image Type 2025 & 2033
- Figure 12: North America Medical X-Ray Equipment and Imaging Software Industry Volume (K Unit), by Image Type 2025 & 2033
- Figure 13: North America Medical X-Ray Equipment and Imaging Software Industry Revenue Share (%), by Image Type 2025 & 2033
- Figure 14: North America Medical X-Ray Equipment and Imaging Software Industry Volume Share (%), by Image Type 2025 & 2033
- Figure 15: North America Medical X-Ray Equipment and Imaging Software Industry Revenue (Million), by End-user 2025 & 2033
- Figure 16: North America Medical X-Ray Equipment and Imaging Software Industry Volume (K Unit), by End-user 2025 & 2033
- Figure 17: North America Medical X-Ray Equipment and Imaging Software Industry Revenue Share (%), by End-user 2025 & 2033
- Figure 18: North America Medical X-Ray Equipment and Imaging Software Industry Volume Share (%), by End-user 2025 & 2033
- Figure 19: North America Medical X-Ray Equipment and Imaging Software Industry Revenue (Million), by Country 2025 & 2033
- Figure 20: North America Medical X-Ray Equipment and Imaging Software Industry Volume (K Unit), by Country 2025 & 2033
- Figure 21: North America Medical X-Ray Equipment and Imaging Software Industry Revenue Share (%), by Country 2025 & 2033
- Figure 22: North America Medical X-Ray Equipment and Imaging Software Industry Volume Share (%), by Country 2025 & 2033
- Figure 23: Europe Medical X-Ray Equipment and Imaging Software Industry Revenue (Million), by Type 2025 & 2033
- Figure 24: Europe Medical X-Ray Equipment and Imaging Software Industry Volume (K Unit), by Type 2025 & 2033
- Figure 25: Europe Medical X-Ray Equipment and Imaging Software Industry Revenue Share (%), by Type 2025 & 2033
- Figure 26: Europe Medical X-Ray Equipment and Imaging Software Industry Volume Share (%), by Type 2025 & 2033
- Figure 27: Europe Medical X-Ray Equipment and Imaging Software Industry Revenue (Million), by Technology 2025 & 2033
- Figure 28: Europe Medical X-Ray Equipment and Imaging Software Industry Volume (K Unit), by Technology 2025 & 2033
- Figure 29: Europe Medical X-Ray Equipment and Imaging Software Industry Revenue Share (%), by Technology 2025 & 2033
- Figure 30: Europe Medical X-Ray Equipment and Imaging Software Industry Volume Share (%), by Technology 2025 & 2033
- Figure 31: Europe Medical X-Ray Equipment and Imaging Software Industry Revenue (Million), by Image Type 2025 & 2033
- Figure 32: Europe Medical X-Ray Equipment and Imaging Software Industry Volume (K Unit), by Image Type 2025 & 2033
- Figure 33: Europe Medical X-Ray Equipment and Imaging Software Industry Revenue Share (%), by Image Type 2025 & 2033
- Figure 34: Europe Medical X-Ray Equipment and Imaging Software Industry Volume Share (%), by Image Type 2025 & 2033
- Figure 35: Europe Medical X-Ray Equipment and Imaging Software Industry Revenue (Million), by End-user 2025 & 2033
- Figure 36: Europe Medical X-Ray Equipment and Imaging Software Industry Volume (K Unit), by End-user 2025 & 2033
- Figure 37: Europe Medical X-Ray Equipment and Imaging Software Industry Revenue Share (%), by End-user 2025 & 2033
- Figure 38: Europe Medical X-Ray Equipment and Imaging Software Industry Volume Share (%), by End-user 2025 & 2033
- Figure 39: Europe Medical X-Ray Equipment and Imaging Software Industry Revenue (Million), by Country 2025 & 2033
- Figure 40: Europe Medical X-Ray Equipment and Imaging Software Industry Volume (K Unit), by Country 2025 & 2033
- Figure 41: Europe Medical X-Ray Equipment and Imaging Software Industry Revenue Share (%), by Country 2025 & 2033
- Figure 42: Europe Medical X-Ray Equipment and Imaging Software Industry Volume Share (%), by Country 2025 & 2033
- Figure 43: Asia Medical X-Ray Equipment and Imaging Software Industry Revenue (Million), by Type 2025 & 2033
- Figure 44: Asia Medical X-Ray Equipment and Imaging Software Industry Volume (K Unit), by Type 2025 & 2033
- Figure 45: Asia Medical X-Ray Equipment and Imaging Software Industry Revenue Share (%), by Type 2025 & 2033
- Figure 46: Asia Medical X-Ray Equipment and Imaging Software Industry Volume Share (%), by Type 2025 & 2033
- Figure 47: Asia Medical X-Ray Equipment and Imaging Software Industry Revenue (Million), by Technology 2025 & 2033
- Figure 48: Asia Medical X-Ray Equipment and Imaging Software Industry Volume (K Unit), by Technology 2025 & 2033
- Figure 49: Asia Medical X-Ray Equipment and Imaging Software Industry Revenue Share (%), by Technology 2025 & 2033
- Figure 50: Asia Medical X-Ray Equipment and Imaging Software Industry Volume Share (%), by Technology 2025 & 2033
- Figure 51: Asia Medical X-Ray Equipment and Imaging Software Industry Revenue (Million), by Image Type 2025 & 2033
- Figure 52: Asia Medical X-Ray Equipment and Imaging Software Industry Volume (K Unit), by Image Type 2025 & 2033
- Figure 53: Asia Medical X-Ray Equipment and Imaging Software Industry Revenue Share (%), by Image Type 2025 & 2033
- Figure 54: Asia Medical X-Ray Equipment and Imaging Software Industry Volume Share (%), by Image Type 2025 & 2033
- Figure 55: Asia Medical X-Ray Equipment and Imaging Software Industry Revenue (Million), by End-user 2025 & 2033
- Figure 56: Asia Medical X-Ray Equipment and Imaging Software Industry Volume (K Unit), by End-user 2025 & 2033
- Figure 57: Asia Medical X-Ray Equipment and Imaging Software Industry Revenue Share (%), by End-user 2025 & 2033
- Figure 58: Asia Medical X-Ray Equipment and Imaging Software Industry Volume Share (%), by End-user 2025 & 2033
- Figure 59: Asia Medical X-Ray Equipment and Imaging Software Industry Revenue (Million), by Country 2025 & 2033
- Figure 60: Asia Medical X-Ray Equipment and Imaging Software Industry Volume (K Unit), by Country 2025 & 2033
- Figure 61: Asia Medical X-Ray Equipment and Imaging Software Industry Revenue Share (%), by Country 2025 & 2033
- Figure 62: Asia Medical X-Ray Equipment and Imaging Software Industry Volume Share (%), by Country 2025 & 2033
- Figure 63: Australia and New Zealand Medical X-Ray Equipment and Imaging Software Industry Revenue (Million), by Type 2025 & 2033
- Figure 64: Australia and New Zealand Medical X-Ray Equipment and Imaging Software Industry Volume (K Unit), by Type 2025 & 2033
- Figure 65: Australia and New Zealand Medical X-Ray Equipment and Imaging Software Industry Revenue Share (%), by Type 2025 & 2033
- Figure 66: Australia and New Zealand Medical X-Ray Equipment and Imaging Software Industry Volume Share (%), by Type 2025 & 2033
- Figure 67: Australia and New Zealand Medical X-Ray Equipment and Imaging Software Industry Revenue (Million), by Technology 2025 & 2033
- Figure 68: Australia and New Zealand Medical X-Ray Equipment and Imaging Software Industry Volume (K Unit), by Technology 2025 & 2033
- Figure 69: Australia and New Zealand Medical X-Ray Equipment and Imaging Software Industry Revenue Share (%), by Technology 2025 & 2033
- Figure 70: Australia and New Zealand Medical X-Ray Equipment and Imaging Software Industry Volume Share (%), by Technology 2025 & 2033
- Figure 71: Australia and New Zealand Medical X-Ray Equipment and Imaging Software Industry Revenue (Million), by Image Type 2025 & 2033
- Figure 72: Australia and New Zealand Medical X-Ray Equipment and Imaging Software Industry Volume (K Unit), by Image Type 2025 & 2033
- Figure 73: Australia and New Zealand Medical X-Ray Equipment and Imaging Software Industry Revenue Share (%), by Image Type 2025 & 2033
- Figure 74: Australia and New Zealand Medical X-Ray Equipment and Imaging Software Industry Volume Share (%), by Image Type 2025 & 2033
- Figure 75: Australia and New Zealand Medical X-Ray Equipment and Imaging Software Industry Revenue (Million), by End-user 2025 & 2033
- Figure 76: Australia and New Zealand Medical X-Ray Equipment and Imaging Software Industry Volume (K Unit), by End-user 2025 & 2033
- Figure 77: Australia and New Zealand Medical X-Ray Equipment and Imaging Software Industry Revenue Share (%), by End-user 2025 & 2033
- Figure 78: Australia and New Zealand Medical X-Ray Equipment and Imaging Software Industry Volume Share (%), by End-user 2025 & 2033
- Figure 79: Australia and New Zealand Medical X-Ray Equipment and Imaging Software Industry Revenue (Million), by Country 2025 & 2033
- Figure 80: Australia and New Zealand Medical X-Ray Equipment and Imaging Software Industry Volume (K Unit), by Country 2025 & 2033
- Figure 81: Australia and New Zealand Medical X-Ray Equipment and Imaging Software Industry Revenue Share (%), by Country 2025 & 2033
- Figure 82: Australia and New Zealand Medical X-Ray Equipment and Imaging Software Industry Volume Share (%), by Country 2025 & 2033
- Figure 83: Middle East and Africa Medical X-Ray Equipment and Imaging Software Industry Revenue (Million), by Type 2025 & 2033
- Figure 84: Middle East and Africa Medical X-Ray Equipment and Imaging Software Industry Volume (K Unit), by Type 2025 & 2033
- Figure 85: Middle East and Africa Medical X-Ray Equipment and Imaging Software Industry Revenue Share (%), by Type 2025 & 2033
- Figure 86: Middle East and Africa Medical X-Ray Equipment and Imaging Software Industry Volume Share (%), by Type 2025 & 2033
- Figure 87: Middle East and Africa Medical X-Ray Equipment and Imaging Software Industry Revenue (Million), by Technology 2025 & 2033
- Figure 88: Middle East and Africa Medical X-Ray Equipment and Imaging Software Industry Volume (K Unit), by Technology 2025 & 2033
- Figure 89: Middle East and Africa Medical X-Ray Equipment and Imaging Software Industry Revenue Share (%), by Technology 2025 & 2033
- Figure 90: Middle East and Africa Medical X-Ray Equipment and Imaging Software Industry Volume Share (%), by Technology 2025 & 2033
- Figure 91: Middle East and Africa Medical X-Ray Equipment and Imaging Software Industry Revenue (Million), by Image Type 2025 & 2033
- Figure 92: Middle East and Africa Medical X-Ray Equipment and Imaging Software Industry Volume (K Unit), by Image Type 2025 & 2033
- Figure 93: Middle East and Africa Medical X-Ray Equipment and Imaging Software Industry Revenue Share (%), by Image Type 2025 & 2033
- Figure 94: Middle East and Africa Medical X-Ray Equipment and Imaging Software Industry Volume Share (%), by Image Type 2025 & 2033
- Figure 95: Middle East and Africa Medical X-Ray Equipment and Imaging Software Industry Revenue (Million), by End-user 2025 & 2033
- Figure 96: Middle East and Africa Medical X-Ray Equipment and Imaging Software Industry Volume (K Unit), by End-user 2025 & 2033
- Figure 97: Middle East and Africa Medical X-Ray Equipment and Imaging Software Industry Revenue Share (%), by End-user 2025 & 2033
- Figure 98: Middle East and Africa Medical X-Ray Equipment and Imaging Software Industry Volume Share (%), by End-user 2025 & 2033
- Figure 99: Middle East and Africa Medical X-Ray Equipment and Imaging Software Industry Revenue (Million), by Country 2025 & 2033
- Figure 100: Middle East and Africa Medical X-Ray Equipment and Imaging Software Industry Volume (K Unit), by Country 2025 & 2033
- Figure 101: Middle East and Africa Medical X-Ray Equipment and Imaging Software Industry Revenue Share (%), by Country 2025 & 2033
- Figure 102: Middle East and Africa Medical X-Ray Equipment and Imaging Software Industry Volume Share (%), by Country 2025 & 2033
- Figure 103: Latin America Medical X-Ray Equipment and Imaging Software Industry Revenue (Million), by Type 2025 & 2033
- Figure 104: Latin America Medical X-Ray Equipment and Imaging Software Industry Volume (K Unit), by Type 2025 & 2033
- Figure 105: Latin America Medical X-Ray Equipment and Imaging Software Industry Revenue Share (%), by Type 2025 & 2033
- Figure 106: Latin America Medical X-Ray Equipment and Imaging Software Industry Volume Share (%), by Type 2025 & 2033
- Figure 107: Latin America Medical X-Ray Equipment and Imaging Software Industry Revenue (Million), by Technology 2025 & 2033
- Figure 108: Latin America Medical X-Ray Equipment and Imaging Software Industry Volume (K Unit), by Technology 2025 & 2033
- Figure 109: Latin America Medical X-Ray Equipment and Imaging Software Industry Revenue Share (%), by Technology 2025 & 2033
- Figure 110: Latin America Medical X-Ray Equipment and Imaging Software Industry Volume Share (%), by Technology 2025 & 2033
- Figure 111: Latin America Medical X-Ray Equipment and Imaging Software Industry Revenue (Million), by Image Type 2025 & 2033
- Figure 112: Latin America Medical X-Ray Equipment and Imaging Software Industry Volume (K Unit), by Image Type 2025 & 2033
- Figure 113: Latin America Medical X-Ray Equipment and Imaging Software Industry Revenue Share (%), by Image Type 2025 & 2033
- Figure 114: Latin America Medical X-Ray Equipment and Imaging Software Industry Volume Share (%), by Image Type 2025 & 2033
- Figure 115: Latin America Medical X-Ray Equipment and Imaging Software Industry Revenue (Million), by End-user 2025 & 2033
- Figure 116: Latin America Medical X-Ray Equipment and Imaging Software Industry Volume (K Unit), by End-user 2025 & 2033
- Figure 117: Latin America Medical X-Ray Equipment and Imaging Software Industry Revenue Share (%), by End-user 2025 & 2033
- Figure 118: Latin America Medical X-Ray Equipment and Imaging Software Industry Volume Share (%), by End-user 2025 & 2033
- Figure 119: Latin America Medical X-Ray Equipment and Imaging Software Industry Revenue (Million), by Country 2025 & 2033
- Figure 120: Latin America Medical X-Ray Equipment and Imaging Software Industry Volume (K Unit), by Country 2025 & 2033
- Figure 121: Latin America Medical X-Ray Equipment and Imaging Software Industry Revenue Share (%), by Country 2025 & 2033
- Figure 122: Latin America Medical X-Ray Equipment and Imaging Software Industry Volume Share (%), by Country 2025 & 2033
List of Tables
- Table 1: Global Medical X-Ray Equipment and Imaging Software Industry Revenue Million Forecast, by Type 2020 & 2033
- Table 2: Global Medical X-Ray Equipment and Imaging Software Industry Volume K Unit Forecast, by Type 2020 & 2033
- Table 3: Global Medical X-Ray Equipment and Imaging Software Industry Revenue Million Forecast, by Technology 2020 & 2033
- Table 4: Global Medical X-Ray Equipment and Imaging Software Industry Volume K Unit Forecast, by Technology 2020 & 2033
- Table 5: Global Medical X-Ray Equipment and Imaging Software Industry Revenue Million Forecast, by Image Type 2020 & 2033
- Table 6: Global Medical X-Ray Equipment and Imaging Software Industry Volume K Unit Forecast, by Image Type 2020 & 2033
- Table 7: Global Medical X-Ray Equipment and Imaging Software Industry Revenue Million Forecast, by End-user 2020 & 2033
- Table 8: Global Medical X-Ray Equipment and Imaging Software Industry Volume K Unit Forecast, by End-user 2020 & 2033
- Table 9: Global Medical X-Ray Equipment and Imaging Software Industry Revenue Million Forecast, by Region 2020 & 2033
- Table 10: Global Medical X-Ray Equipment and Imaging Software Industry Volume K Unit Forecast, by Region 2020 & 2033
- Table 11: Global Medical X-Ray Equipment and Imaging Software Industry Revenue Million Forecast, by Type 2020 & 2033
- Table 12: Global Medical X-Ray Equipment and Imaging Software Industry Volume K Unit Forecast, by Type 2020 & 2033
- Table 13: Global Medical X-Ray Equipment and Imaging Software Industry Revenue Million Forecast, by Technology 2020 & 2033
- Table 14: Global Medical X-Ray Equipment and Imaging Software Industry Volume K Unit Forecast, by Technology 2020 & 2033
- Table 15: Global Medical X-Ray Equipment and Imaging Software Industry Revenue Million Forecast, by Image Type 2020 & 2033
- Table 16: Global Medical X-Ray Equipment and Imaging Software Industry Volume K Unit Forecast, by Image Type 2020 & 2033
- Table 17: Global Medical X-Ray Equipment and Imaging Software Industry Revenue Million Forecast, by End-user 2020 & 2033
- Table 18: Global Medical X-Ray Equipment and Imaging Software Industry Volume K Unit Forecast, by End-user 2020 & 2033
- Table 19: Global Medical X-Ray Equipment and Imaging Software Industry Revenue Million Forecast, by Country 2020 & 2033
- Table 20: Global Medical X-Ray Equipment and Imaging Software Industry Volume K Unit Forecast, by Country 2020 & 2033
- Table 21: Global Medical X-Ray Equipment and Imaging Software Industry Revenue Million Forecast, by Type 2020 & 2033
- Table 22: Global Medical X-Ray Equipment and Imaging Software Industry Volume K Unit Forecast, by Type 2020 & 2033
- Table 23: Global Medical X-Ray Equipment and Imaging Software Industry Revenue Million Forecast, by Technology 2020 & 2033
- Table 24: Global Medical X-Ray Equipment and Imaging Software Industry Volume K Unit Forecast, by Technology 2020 & 2033
- Table 25: Global Medical X-Ray Equipment and Imaging Software Industry Revenue Million Forecast, by Image Type 2020 & 2033
- Table 26: Global Medical X-Ray Equipment and Imaging Software Industry Volume K Unit Forecast, by Image Type 2020 & 2033
- Table 27: Global Medical X-Ray Equipment and Imaging Software Industry Revenue Million Forecast, by End-user 2020 & 2033
- Table 28: Global Medical X-Ray Equipment and Imaging Software Industry Volume K Unit Forecast, by End-user 2020 & 2033
- Table 29: Global Medical X-Ray Equipment and Imaging Software Industry Revenue Million Forecast, by Country 2020 & 2033
- Table 30: Global Medical X-Ray Equipment and Imaging Software Industry Volume K Unit Forecast, by Country 2020 & 2033
- Table 31: Global Medical X-Ray Equipment and Imaging Software Industry Revenue Million Forecast, by Type 2020 & 2033
- Table 32: Global Medical X-Ray Equipment and Imaging Software Industry Volume K Unit Forecast, by Type 2020 & 2033
- Table 33: Global Medical X-Ray Equipment and Imaging Software Industry Revenue Million Forecast, by Technology 2020 & 2033
- Table 34: Global Medical X-Ray Equipment and Imaging Software Industry Volume K Unit Forecast, by Technology 2020 & 2033
- Table 35: Global Medical X-Ray Equipment and Imaging Software Industry Revenue Million Forecast, by Image Type 2020 & 2033
- Table 36: Global Medical X-Ray Equipment and Imaging Software Industry Volume K Unit Forecast, by Image Type 2020 & 2033
- Table 37: Global Medical X-Ray Equipment and Imaging Software Industry Revenue Million Forecast, by End-user 2020 & 2033
- Table 38: Global Medical X-Ray Equipment and Imaging Software Industry Volume K Unit Forecast, by End-user 2020 & 2033
- Table 39: Global Medical X-Ray Equipment and Imaging Software Industry Revenue Million Forecast, by Country 2020 & 2033
- Table 40: Global Medical X-Ray Equipment and Imaging Software Industry Volume K Unit Forecast, by Country 2020 & 2033
- Table 41: Global Medical X-Ray Equipment and Imaging Software Industry Revenue Million Forecast, by Type 2020 & 2033
- Table 42: Global Medical X-Ray Equipment and Imaging Software Industry Volume K Unit Forecast, by Type 2020 & 2033
- Table 43: Global Medical X-Ray Equipment and Imaging Software Industry Revenue Million Forecast, by Technology 2020 & 2033
- Table 44: Global Medical X-Ray Equipment and Imaging Software Industry Volume K Unit Forecast, by Technology 2020 & 2033
- Table 45: Global Medical X-Ray Equipment and Imaging Software Industry Revenue Million Forecast, by Image Type 2020 & 2033
- Table 46: Global Medical X-Ray Equipment and Imaging Software Industry Volume K Unit Forecast, by Image Type 2020 & 2033
- Table 47: Global Medical X-Ray Equipment and Imaging Software Industry Revenue Million Forecast, by End-user 2020 & 2033
- Table 48: Global Medical X-Ray Equipment and Imaging Software Industry Volume K Unit Forecast, by End-user 2020 & 2033
- Table 49: Global Medical X-Ray Equipment and Imaging Software Industry Revenue Million Forecast, by Country 2020 & 2033
- Table 50: Global Medical X-Ray Equipment and Imaging Software Industry Volume K Unit Forecast, by Country 2020 & 2033
- Table 51: Global Medical X-Ray Equipment and Imaging Software Industry Revenue Million Forecast, by Type 2020 & 2033
- Table 52: Global Medical X-Ray Equipment and Imaging Software Industry Volume K Unit Forecast, by Type 2020 & 2033
- Table 53: Global Medical X-Ray Equipment and Imaging Software Industry Revenue Million Forecast, by Technology 2020 & 2033
- Table 54: Global Medical X-Ray Equipment and Imaging Software Industry Volume K Unit Forecast, by Technology 2020 & 2033
- Table 55: Global Medical X-Ray Equipment and Imaging Software Industry Revenue Million Forecast, by Image Type 2020 & 2033
- Table 56: Global Medical X-Ray Equipment and Imaging Software Industry Volume K Unit Forecast, by Image Type 2020 & 2033
- Table 57: Global Medical X-Ray Equipment and Imaging Software Industry Revenue Million Forecast, by End-user 2020 & 2033
- Table 58: Global Medical X-Ray Equipment and Imaging Software Industry Volume K Unit Forecast, by End-user 2020 & 2033
- Table 59: Global Medical X-Ray Equipment and Imaging Software Industry Revenue Million Forecast, by Country 2020 & 2033
- Table 60: Global Medical X-Ray Equipment and Imaging Software Industry Volume K Unit Forecast, by Country 2020 & 2033
- Table 61: Global Medical X-Ray Equipment and Imaging Software Industry Revenue Million Forecast, by Type 2020 & 2033
- Table 62: Global Medical X-Ray Equipment and Imaging Software Industry Volume K Unit Forecast, by Type 2020 & 2033
- Table 63: Global Medical X-Ray Equipment and Imaging Software Industry Revenue Million Forecast, by Technology 2020 & 2033
- Table 64: Global Medical X-Ray Equipment and Imaging Software Industry Volume K Unit Forecast, by Technology 2020 & 2033
- Table 65: Global Medical X-Ray Equipment and Imaging Software Industry Revenue Million Forecast, by Image Type 2020 & 2033
- Table 66: Global Medical X-Ray Equipment and Imaging Software Industry Volume K Unit Forecast, by Image Type 2020 & 2033
- Table 67: Global Medical X-Ray Equipment and Imaging Software Industry Revenue Million Forecast, by End-user 2020 & 2033
- Table 68: Global Medical X-Ray Equipment and Imaging Software Industry Volume K Unit Forecast, by End-user 2020 & 2033
- Table 69: Global Medical X-Ray Equipment and Imaging Software Industry Revenue Million Forecast, by Country 2020 & 2033
- Table 70: Global Medical X-Ray Equipment and Imaging Software Industry Volume K Unit Forecast, by Country 2020 & 2033
Frequently Asked Questions
1. What is the projected Compound Annual Growth Rate (CAGR) of the Medical X-Ray Equipment and Imaging Software Industry?
The projected CAGR is approximately 4.60%.
2. Which companies are prominent players in the Medical X-Ray Equipment and Imaging Software Industry?
Key companies in the market include Konica Minolta Inc, Siemens Healthcare GmbH, Canon Inc, IBM Corporation, Varex Imaging Corporation, Hitachi Ltd, Shimazdu Corporation, Hologic Inc , Koninklijke Philips NV, GE Healthcare Inc, Carestream Health Inc, Fujifilm Holdings Corporation.
3. What are the main segments of the Medical X-Ray Equipment and Imaging Software Industry?
The market segments include Type, Technology, Image Type, End-user.
4. Can you provide details about the market size?
The market size is estimated to be USD XX Million as of 2022.
5. What are some drivers contributing to market growth?
Increasing Incidences of Diseases and Growing Geriatric Population; Rising Investments in Healthcare Industry and Favorable Government Initiatives.
6. What are the notable trends driving market growth?
Diagnostic Centers Majorly Drive the Market Demand.
7. Are there any restraints impacting market growth?
Stringent Regulations and Validator Guidelines; Security Issues Associated with the Software.
8. Can you provide examples of recent developments in the market?
July 2023 - Shimadzu Corporation announced the release of a new mobile X-ray system known as MobileDaRt Evolution MX8 version k type, which is equipped with serial radiography functionality known as Dynamic Digital Radiography (DDR). It displays a series of static images captured at high speed as a moving image.
9. What pricing options are available for accessing the report?
Pricing options include single-user, multi-user, and enterprise licenses priced at USD 4750, USD 5250, and USD 8750 respectively.
10. Is the market size provided in terms of value or volume?
The market size is provided in terms of value, measured in Million and volume, measured in K Unit.
11. Are there any specific market keywords associated with the report?
Yes, the market keyword associated with the report is "Medical X-Ray Equipment and Imaging Software Industry," which aids in identifying and referencing the specific market segment covered.
12. How do I determine which pricing option suits my needs best?
The pricing options vary based on user requirements and access needs. Individual users may opt for single-user licenses, while businesses requiring broader access may choose multi-user or enterprise licenses for cost-effective access to the report.
13. Are there any additional resources or data provided in the Medical X-Ray Equipment and Imaging Software Industry report?
While the report offers comprehensive insights, it's advisable to review the specific contents or supplementary materials provided to ascertain if additional resources or data are available.
14. How can I stay updated on further developments or reports in the Medical X-Ray Equipment and Imaging Software Industry?
To stay informed about further developments, trends, and reports in the Medical X-Ray Equipment and Imaging Software Industry, consider subscribing to industry newsletters, following relevant companies and organizations, or regularly checking reputable industry news sources and publications.
Methodology
Step 1 - Identification of Relevant Samples Size from Population Database


Step 2 - Approaches for Defining Global Market Size (Value, Volume* & Price*)

Note*: In applicable scenarios
Step 3 - Data Sources
Primary Research
- Web Analytics
- Survey Reports
- Research Institute
- Latest Research Reports
- Opinion Leaders
Secondary Research
- Annual Reports
- White Paper
- Latest Press Release
- Industry Association
- Paid Database
- Investor Presentations

Step 4 - Data Triangulation
Involves using different sources of information in order to increase the validity of a study
These sources are likely to be stakeholders in a program - participants, other researchers, program staff, other community members, and so on.
Then we put all data in single framework & apply various statistical tools to find out the dynamic on the market.
During the analysis stage, feedback from the stakeholder groups would be compared to determine areas of agreement as well as areas of divergence