Key Insights
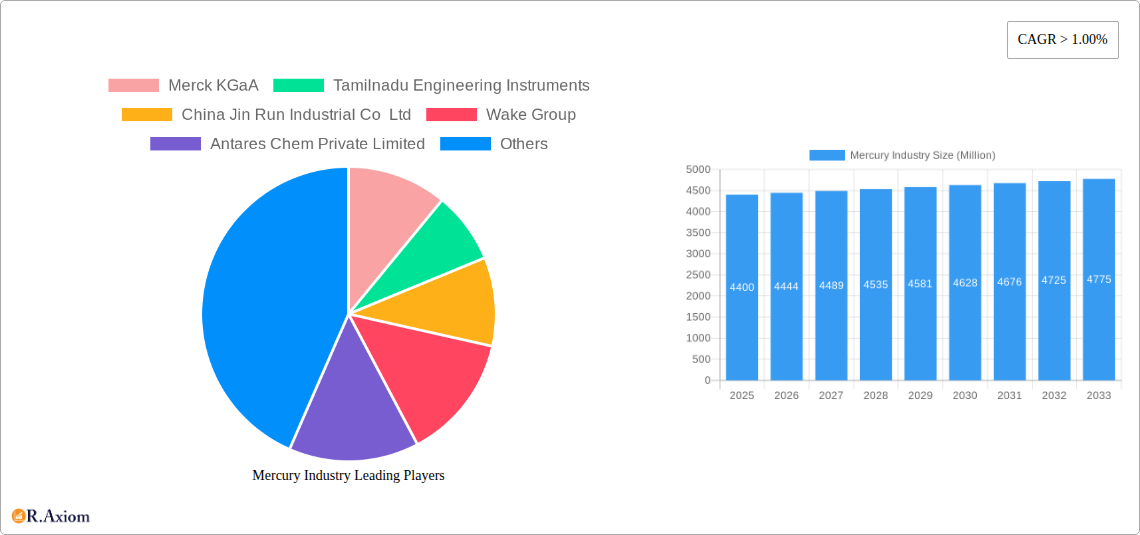
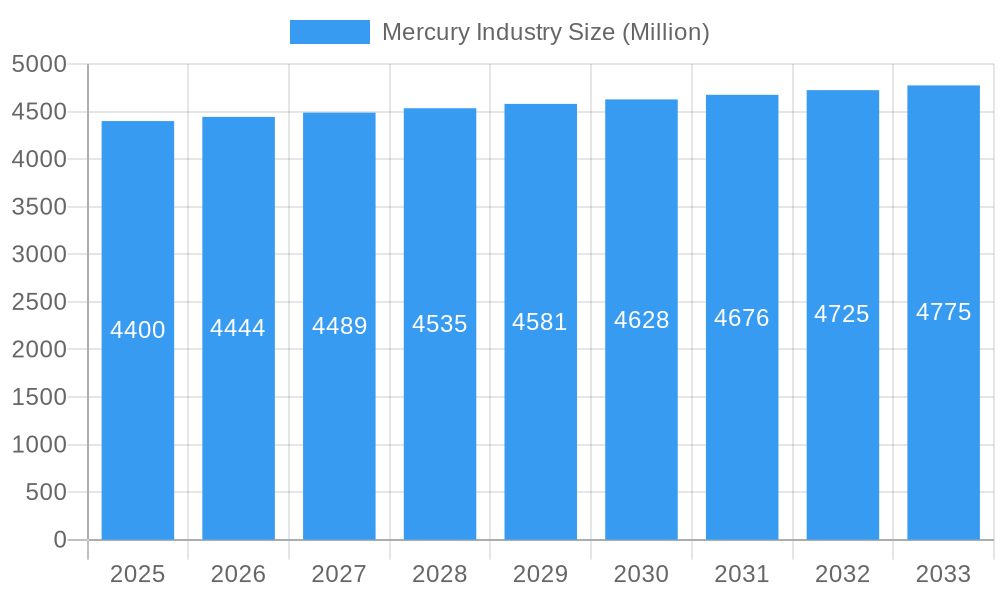
The global mercury market, valued at $4.40 billion in 2025, is projected to experience steady growth, driven primarily by its continued albeit declining use in specific applications. While the overall market exhibits a modest Compound Annual Growth Rate (CAGR) of over 1%, growth is segmented. The electrical and electronics sector, including batteries and measuring devices, continues to be a significant consumer, albeit facing pressure from stricter environmental regulations and the rise of mercury-free alternatives. The dental sector remains a stable consumer, though facing similar pressures to reduce mercury usage. Other niche applications, such as in certain lamps and the processing of gold, contribute to the overall market size. However, significant restraints include increasing global environmental regulations aimed at phasing out mercury use due to its toxicity and environmental damage. This has led to a decline in certain applications and a push for sustainable substitutes. Growth in emerging markets, particularly in Asia-Pacific regions, may offset some of the decline in developed nations, albeit at a slower pace. The market’s future growth will depend heavily on the successful development and adoption of mercury-free technologies and the enforcement of existing environmental regulations.
Mercury Industry Market Size (In Billion)
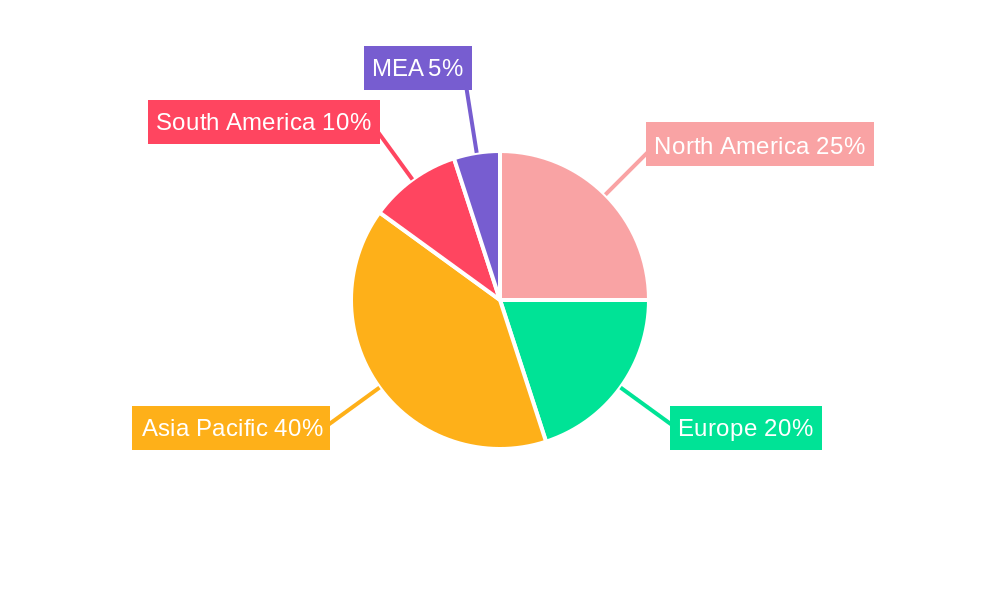
The competitive landscape is fragmented, with a mix of large multinational corporations like Merck KGaA and smaller regional players like Antares Chem Private Limited and Tamilnadu Engineering Instruments. These companies are strategically navigating the evolving regulatory environment and investing in research and development to create more sustainable products and processes. Market segmentation by product type (metal, alloy, compounds) and application further underscores the complex dynamics. While metal mercury remains the dominant form, the growing demand for mercury compounds in specific niche applications is expected to contribute to market diversification and a more nuanced growth pattern in the coming years. North America and Europe, historically major consumers, are expected to see slower growth due to stringent regulations, whereas Asia-Pacific could see more growth, although possibly at a slower rate than previously.
Mercury Industry Company Market Share
This comprehensive report provides a detailed analysis of the global mercury industry, covering market size, segmentation, key players, trends, and future outlook. The study period spans from 2019 to 2033, with 2025 as the base and estimated year. This report is essential for industry stakeholders, investors, and researchers seeking a deep understanding of this dynamic and evolving market.
Mercury Industry Market Concentration & Innovation
The global mercury market exhibits a moderately concentrated structure, with a few major players holding significant market share. Merck KGaA, Avantor Performance Materials, and Special Metals are among the leading companies, collectively accounting for an estimated xx% of the total market revenue in 2025. However, the presence of numerous smaller players, particularly in regional markets, creates a competitive landscape.
Innovation Drivers:
- Stringent environmental regulations driving the development of mercury-free alternatives.
- Advancements in material science leading to the creation of new mercury compounds with enhanced properties.
- Growing demand for mercury in niche applications like specialized lighting and electronic devices.
Regulatory Frameworks: The Minamata Convention on Mercury plays a significant role, shaping industry practices and driving innovation towards mercury-free solutions. Recent regulatory changes, such as the EU's proposed revision to the Mercury Regulation (July 2023), will significantly impact market dynamics, particularly in dental applications.
Product Substitutes: The market faces pressure from the development and adoption of mercury-free substitutes in various applications. This competition is particularly intense in the dental and electrical industries.
End-User Trends: Growing environmental awareness and stricter regulations are shifting end-user preferences towards sustainable and mercury-free alternatives. This trend is most prominent in developed economies.
M&A Activities: The mercury industry has witnessed a moderate level of M&A activity in recent years. While the total value of deals varies, these activities often aim to consolidate market share and gain access to new technologies or markets. Deal values have ranged from USD xx million to USD xx million in recent years.
Mercury Industry Industry Trends & Insights
The global mercury market is projected to witness a CAGR of xx% during the forecast period (2025-2033). This growth is driven by a combination of factors, including the continued demand for mercury in specific industrial applications, despite increasing regulatory pressure. However, market penetration of mercury-free substitutes is expected to gradually reduce the overall market size over the long term.
Technological disruptions, particularly the development of highly efficient and cost-effective mercury-free alternatives, are a major challenge to the industry's growth. Consumer preferences are shifting towards environmentally friendly products, driving the demand for sustainable solutions. Competitive dynamics are intense, with established players and emerging companies vying for market share. The industry is also characterized by fluctuating raw material prices and supply chain vulnerabilities.
Dominant Markets & Segments in Mercury Industry
While precise market share figures are confidential and require dedicated analysis, we can outline observations. The report details market dominance by region, country, and segment based on data analysis.
Dominant Regions/Countries: [Analysis will identify the dominant region/country based on factors like consumption, production, and regulatory environment. This section will provide a paragraph for each].
- Key Drivers: [Bullet points will outline specific economic policies, infrastructure developments, and other crucial factors contributing to the dominance of each region/country].
Dominant Product Types: [Analysis will identify the dominant product type (Metal, Alloy, Compounds) based on market share and growth trends. A paragraph will be provided for each].
- Key Drivers: [Bullet points will analyze economic factors and applications driving demand for each product type].
Dominant Applications: [Analysis will identify the dominant application (Batteries, Dental Applications, etc.) based on volume and value. A paragraph will be provided for each].
- Key Drivers: [Bullet points will outline specific factors influencing each application segment's market demand].
Mercury Industry Product Developments
Recent product innovations focus on improving the efficiency and safety of mercury use in specific applications. For example, advancements in mercury-based compounds have resulted in improved performance in certain specialized applications. However, the market is also seeing the rise of mercury-free substitutes which present a significant challenge to traditional applications. The market fit for these innovations varies depending on the application and regulatory landscape.
Report Scope & Segmentation Analysis
The report segments the mercury market by product type (Metal, Alloy, Compounds) and application (Batteries, Dental Applications, Measuring and Controlling Devices, Lamps, Electrical and Electronics Devices, Processing of Gold, Other Applications). Each segment's market size, growth projections, and competitive dynamics are analyzed, providing a comprehensive overview of the market's structure. For instance, the dental amalgam segment is facing significant pressure from upcoming regulations (as seen in the EU ban proposal), while the batteries segment will continue to demand mercury but face substitution pressures.
Key Drivers of Mercury Industry Growth
The growth of the mercury industry is primarily driven by continued demand in niche applications. Economic factors, particularly in developing economies, drive industrial applications. However, this is increasingly countered by stringent environmental regulations promoting mercury-free alternatives.
Challenges in the Mercury Industry Sector
The mercury industry faces significant challenges, including stringent environmental regulations that limit the use of mercury and drive demand for substitutes. Supply chain disruptions and price volatility of raw materials are also significant concerns. Increasing competitive pressure from companies offering mercury-free solutions further impacts market growth.
Emerging Opportunities in Mercury Industry
Emerging opportunities lie in the development and commercialization of innovative mercury-free technologies. New applications in specialized areas, where mercury still holds advantages, could offer limited growth. Furthermore, recycling and responsible disposal of mercury waste present opportunities for specialized companies.
Leading Players in the Mercury Industry Market
- Merck KGaA
- Tamilnadu Engineering Instruments
- China Jin Run Industrial Co Ltd
- Wake Group
- Antares Chem Private Limited
- Bethlehem Apparatus Co Inc
- Aldrett Hermanos
- Mayasa
- Special Metals
- Powder Pack Chem
- Avantor Performance Materials
Key Developments in Mercury Industry Industry
- July 2023: The European Commission's proposed revision of the Mercury Regulation will significantly impact the EU market, especially dental applications, leading to decreased demand for mercury amalgam.
- February 2023: The USD 14 million project to eliminate mercury in skin-lightening products highlights growing global concerns about mercury's health impacts and potential for market disruption.
- March 2022: The COP4 declaration on tackling illegal mercury trade underscores the ongoing need for stricter regulatory enforcement and supply chain transparency.
Strategic Outlook for Mercury Industry Market
The future of the mercury industry is intertwined with the balance between continued niche demand and the increasing pressure to transition to mercury-free alternatives. While specific applications might remain dependent on mercury for the foreseeable future, the long-term outlook is driven by the adoption of substitutes and intensified environmental regulations. Companies focusing on sustainable solutions and innovative mercury-free technologies are best positioned for long-term success.
Mercury Industry Segmentation
-
1. Product Type
- 1.1. Metal
- 1.2. Alloy
- 1.3. Compounds
-
2. Application
- 2.1. Batteries
- 2.2. Dental Applications
- 2.3. Measuring and Controlling Devices
- 2.4. Lamps
- 2.5. Electrical and Electronics Devices
- 2.6. Processing of Gold
- 2.7. Other Ap
Mercury Industry Segmentation By Geography
-
1. Asia Pacific
- 1.1. China
- 1.2. India
- 1.3. Japan
- 1.4. South Korea
- 1.5. Malaysia
- 1.6. Thailand
- 1.7. Indonesia
- 1.8. Vietnam
- 1.9. Rest of Asia Pacific
-
2. North America
- 2.1. United States
- 2.2. Canada
- 2.3. Mexico
-
3. Europe
- 3.1. Germany
- 3.2. United Kingdom
- 3.3. France
- 3.4. Italy
- 3.5. Spain
- 3.6. NORDIC
- 3.7. Turkey
- 3.8. Russia
- 3.9. Rest of Europe
-
4. South America
- 4.1. Brazil
- 4.2. Argentina
- 4.3. Colombia
- 4.4. Rest of South America
- 5. Middle East and Africa
- 6. Saudi Arabia
- 7. South Africa
- 8. Nigeria
- 9. Qatar
- 10. Egypt
- 11. UAE
- 12. Rest of Middle East and Africa
Mercury Industry Regional Market Share
Geographic Coverage of Mercury Industry
Mercury Industry REPORT HIGHLIGHTS
| Aspects | Details |
|---|---|
| Study Period | 2020-2034 |
| Base Year | 2025 |
| Estimated Year | 2026 |
| Forecast Period | 2026-2034 |
| Historical Period | 2020-2025 |
| Growth Rate | CAGR of > 1.00% from 2020-2034 |
| Segmentation |
|
Table of Contents
- 1. Introduction
- 1.1. Research Scope
- 1.2. Market Segmentation
- 1.3. Research Objective
- 1.4. Definitions and Assumptions
- 2. Executive Summary
- 2.1. Market Snapshot
- 3. Market Dynamics
- 3.1. Market Drivers
- 3.2. Market Restrains
- 3.3. Market Trends
- 3.4. Market Opportunities
- 4. Market Factor Analysis
- 4.1. Porters Five Forces
- 4.1.1. Bargaining Power of Suppliers
- 4.1.2. Bargaining Power of Buyers
- 4.1.3. Threat of New Entrants
- 4.1.4. Threat of Substitutes
- 4.1.5. Competitive Rivalry
- 4.2. PESTEL analysis
- 4.3. BCG Analysis
- 4.3.1. Stars (High Growth, High Market Share)
- 4.3.2. Cash Cows (Low Growth, High Market Share)
- 4.3.3. Question Mark (High Growth, Low Market Share)
- 4.3.4. Dogs (Low Growth, Low Market Share)
- 4.4. Ansoff Matrix Analysis
- 4.5. Supply Chain Analysis
- 4.6. Regulatory Landscape
- 4.7. Current Market Potential and Opportunity Assessment (TAM–SAM–SOM Framework)
- 4.8. RAX Analyst Note
- 4.1. Porters Five Forces
- 5. Market Analysis, Insights and Forecast 2021-2033
- 5.1. Market Analysis, Insights and Forecast - by Product Type
- 5.1.1. Metal
- 5.1.2. Alloy
- 5.1.3. Compounds
- 5.2. Market Analysis, Insights and Forecast - by Application
- 5.2.1. Batteries
- 5.2.2. Dental Applications
- 5.2.3. Measuring and Controlling Devices
- 5.2.4. Lamps
- 5.2.5. Electrical and Electronics Devices
- 5.2.6. Processing of Gold
- 5.2.7. Other Ap
- 5.3. Market Analysis, Insights and Forecast - by Region
- 5.3.1. Asia Pacific
- 5.3.2. North America
- 5.3.3. Europe
- 5.3.4. South America
- 5.3.5. Middle East and Africa
- 5.3.6. Saudi Arabia
- 5.3.7. South Africa
- 5.3.8. Nigeria
- 5.3.9. Qatar
- 5.3.10. Egypt
- 5.3.11. UAE
- 5.3.12. Rest of Middle East and Africa
- 5.1. Market Analysis, Insights and Forecast - by Product Type
- 6. Global Mercury Industry Analysis, Insights and Forecast, 2021-2033
- 6.1. Market Analysis, Insights and Forecast - by Product Type
- 6.1.1. Metal
- 6.1.2. Alloy
- 6.1.3. Compounds
- 6.2. Market Analysis, Insights and Forecast - by Application
- 6.2.1. Batteries
- 6.2.2. Dental Applications
- 6.2.3. Measuring and Controlling Devices
- 6.2.4. Lamps
- 6.2.5. Electrical and Electronics Devices
- 6.2.6. Processing of Gold
- 6.2.7. Other Ap
- 6.1. Market Analysis, Insights and Forecast - by Product Type
- 7. Asia Pacific Mercury Industry Analysis, Insights and Forecast, 2020-2032
- 7.1. Market Analysis, Insights and Forecast - by Product Type
- 7.1.1. Metal
- 7.1.2. Alloy
- 7.1.3. Compounds
- 7.2. Market Analysis, Insights and Forecast - by Application
- 7.2.1. Batteries
- 7.2.2. Dental Applications
- 7.2.3. Measuring and Controlling Devices
- 7.2.4. Lamps
- 7.2.5. Electrical and Electronics Devices
- 7.2.6. Processing of Gold
- 7.2.7. Other Ap
- 7.1. Market Analysis, Insights and Forecast - by Product Type
- 8. North America Mercury Industry Analysis, Insights and Forecast, 2020-2032
- 8.1. Market Analysis, Insights and Forecast - by Product Type
- 8.1.1. Metal
- 8.1.2. Alloy
- 8.1.3. Compounds
- 8.2. Market Analysis, Insights and Forecast - by Application
- 8.2.1. Batteries
- 8.2.2. Dental Applications
- 8.2.3. Measuring and Controlling Devices
- 8.2.4. Lamps
- 8.2.5. Electrical and Electronics Devices
- 8.2.6. Processing of Gold
- 8.2.7. Other Ap
- 8.1. Market Analysis, Insights and Forecast - by Product Type
- 9. Europe Mercury Industry Analysis, Insights and Forecast, 2020-2032
- 9.1. Market Analysis, Insights and Forecast - by Product Type
- 9.1.1. Metal
- 9.1.2. Alloy
- 9.1.3. Compounds
- 9.2. Market Analysis, Insights and Forecast - by Application
- 9.2.1. Batteries
- 9.2.2. Dental Applications
- 9.2.3. Measuring and Controlling Devices
- 9.2.4. Lamps
- 9.2.5. Electrical and Electronics Devices
- 9.2.6. Processing of Gold
- 9.2.7. Other Ap
- 9.1. Market Analysis, Insights and Forecast - by Product Type
- 10. South America Mercury Industry Analysis, Insights and Forecast, 2020-2032
- 10.1. Market Analysis, Insights and Forecast - by Product Type
- 10.1.1. Metal
- 10.1.2. Alloy
- 10.1.3. Compounds
- 10.2. Market Analysis, Insights and Forecast - by Application
- 10.2.1. Batteries
- 10.2.2. Dental Applications
- 10.2.3. Measuring and Controlling Devices
- 10.2.4. Lamps
- 10.2.5. Electrical and Electronics Devices
- 10.2.6. Processing of Gold
- 10.2.7. Other Ap
- 10.1. Market Analysis, Insights and Forecast - by Product Type
- 11. Middle East and Africa Mercury Industry Analysis, Insights and Forecast, 2020-2032
- 11.1. Market Analysis, Insights and Forecast - by Product Type
- 11.1.1. Metal
- 11.1.2. Alloy
- 11.1.3. Compounds
- 11.2. Market Analysis, Insights and Forecast - by Application
- 11.2.1. Batteries
- 11.2.2. Dental Applications
- 11.2.3. Measuring and Controlling Devices
- 11.2.4. Lamps
- 11.2.5. Electrical and Electronics Devices
- 11.2.6. Processing of Gold
- 11.2.7. Other Ap
- 11.1. Market Analysis, Insights and Forecast - by Product Type
- 12. Saudi Arabia Mercury Industry Analysis, Insights and Forecast, 2020-2032
- 12.1. Market Analysis, Insights and Forecast - by Product Type
- 12.1.1. Metal
- 12.1.2. Alloy
- 12.1.3. Compounds
- 12.2. Market Analysis, Insights and Forecast - by Application
- 12.2.1. Batteries
- 12.2.2. Dental Applications
- 12.2.3. Measuring and Controlling Devices
- 12.2.4. Lamps
- 12.2.5. Electrical and Electronics Devices
- 12.2.6. Processing of Gold
- 12.2.7. Other Ap
- 12.1. Market Analysis, Insights and Forecast - by Product Type
- 13. South Africa Mercury Industry Analysis, Insights and Forecast, 2020-2032
- 13.1. Market Analysis, Insights and Forecast - by Product Type
- 13.1.1. Metal
- 13.1.2. Alloy
- 13.1.3. Compounds
- 13.2. Market Analysis, Insights and Forecast - by Application
- 13.2.1. Batteries
- 13.2.2. Dental Applications
- 13.2.3. Measuring and Controlling Devices
- 13.2.4. Lamps
- 13.2.5. Electrical and Electronics Devices
- 13.2.6. Processing of Gold
- 13.2.7. Other Ap
- 13.1. Market Analysis, Insights and Forecast - by Product Type
- 14. Nigeria Mercury Industry Analysis, Insights and Forecast, 2020-2032
- 14.1. Market Analysis, Insights and Forecast - by Product Type
- 14.1.1. Metal
- 14.1.2. Alloy
- 14.1.3. Compounds
- 14.2. Market Analysis, Insights and Forecast - by Application
- 14.2.1. Batteries
- 14.2.2. Dental Applications
- 14.2.3. Measuring and Controlling Devices
- 14.2.4. Lamps
- 14.2.5. Electrical and Electronics Devices
- 14.2.6. Processing of Gold
- 14.2.7. Other Ap
- 14.1. Market Analysis, Insights and Forecast - by Product Type
- 15. Qatar Mercury Industry Analysis, Insights and Forecast, 2020-2032
- 15.1. Market Analysis, Insights and Forecast - by Product Type
- 15.1.1. Metal
- 15.1.2. Alloy
- 15.1.3. Compounds
- 15.2. Market Analysis, Insights and Forecast - by Application
- 15.2.1. Batteries
- 15.2.2. Dental Applications
- 15.2.3. Measuring and Controlling Devices
- 15.2.4. Lamps
- 15.2.5. Electrical and Electronics Devices
- 15.2.6. Processing of Gold
- 15.2.7. Other Ap
- 15.1. Market Analysis, Insights and Forecast - by Product Type
- 16. Egypt Mercury Industry Analysis, Insights and Forecast, 2020-2032
- 16.1. Market Analysis, Insights and Forecast - by Product Type
- 16.1.1. Metal
- 16.1.2. Alloy
- 16.1.3. Compounds
- 16.2. Market Analysis, Insights and Forecast - by Application
- 16.2.1. Batteries
- 16.2.2. Dental Applications
- 16.2.3. Measuring and Controlling Devices
- 16.2.4. Lamps
- 16.2.5. Electrical and Electronics Devices
- 16.2.6. Processing of Gold
- 16.2.7. Other Ap
- 16.1. Market Analysis, Insights and Forecast - by Product Type
- 17. UAE Mercury Industry Analysis, Insights and Forecast, 2020-2032
- 17.1. Market Analysis, Insights and Forecast - by Product Type
- 17.1.1. Metal
- 17.1.2. Alloy
- 17.1.3. Compounds
- 17.2. Market Analysis, Insights and Forecast - by Application
- 17.2.1. Batteries
- 17.2.2. Dental Applications
- 17.2.3. Measuring and Controlling Devices
- 17.2.4. Lamps
- 17.2.5. Electrical and Electronics Devices
- 17.2.6. Processing of Gold
- 17.2.7. Other Ap
- 17.1. Market Analysis, Insights and Forecast - by Product Type
- 18. Rest of Middle East and Africa Mercury Industry Analysis, Insights and Forecast, 2020-2032
- 18.1. Market Analysis, Insights and Forecast - by Product Type
- 18.1.1. Metal
- 18.1.2. Alloy
- 18.1.3. Compounds
- 18.2. Market Analysis, Insights and Forecast - by Application
- 18.2.1. Batteries
- 18.2.2. Dental Applications
- 18.2.3. Measuring and Controlling Devices
- 18.2.4. Lamps
- 18.2.5. Electrical and Electronics Devices
- 18.2.6. Processing of Gold
- 18.2.7. Other Ap
- 18.1. Market Analysis, Insights and Forecast - by Product Type
- 19. Competitive Analysis
- 19.1. Company Profiles
- 19.1.1 Merck KGaA
- 19.1.1.1. Company Overview
- 19.1.1.2. Products
- 19.1.1.3. Company Financials
- 19.1.1.4. SWOT Analysis
- 19.1.2 Tamilnadu Engineering Instruments
- 19.1.2.1. Company Overview
- 19.1.2.2. Products
- 19.1.2.3. Company Financials
- 19.1.2.4. SWOT Analysis
- 19.1.3 China Jin Run Industrial Co Ltd
- 19.1.3.1. Company Overview
- 19.1.3.2. Products
- 19.1.3.3. Company Financials
- 19.1.3.4. SWOT Analysis
- 19.1.4 Wake Group
- 19.1.4.1. Company Overview
- 19.1.4.2. Products
- 19.1.4.3. Company Financials
- 19.1.4.4. SWOT Analysis
- 19.1.5 Antares Chem Private Limited
- 19.1.5.1. Company Overview
- 19.1.5.2. Products
- 19.1.5.3. Company Financials
- 19.1.5.4. SWOT Analysis
- 19.1.6 Bethlehem Apparatus Co Inc
- 19.1.6.1. Company Overview
- 19.1.6.2. Products
- 19.1.6.3. Company Financials
- 19.1.6.4. SWOT Analysis
- 19.1.7 Aldrett Hermanos
- 19.1.7.1. Company Overview
- 19.1.7.2. Products
- 19.1.7.3. Company Financials
- 19.1.7.4. SWOT Analysis
- 19.1.8 Mayasa
- 19.1.8.1. Company Overview
- 19.1.8.2. Products
- 19.1.8.3. Company Financials
- 19.1.8.4. SWOT Analysis
- 19.1.9 Special Metals
- 19.1.9.1. Company Overview
- 19.1.9.2. Products
- 19.1.9.3. Company Financials
- 19.1.9.4. SWOT Analysis
- 19.1.10 Powder Pack Chem
- 19.1.10.1. Company Overview
- 19.1.10.2. Products
- 19.1.10.3. Company Financials
- 19.1.10.4. SWOT Analysis
- 19.1.11 Avantor Performance Materials
- 19.1.11.1. Company Overview
- 19.1.11.2. Products
- 19.1.11.3. Company Financials
- 19.1.11.4. SWOT Analysis
- 19.1.1 Merck KGaA
- 19.2. Market Entropy
- 19.2.1 Company's Key Areas Served
- 19.2.2 Recent Developments
- 19.3. Company Market Share Analysis 2025
- 19.3.1 Top 5 Companies Market Share Analysis
- 19.3.2 Top 3 Companies Market Share Analysis
- 19.4. List of Potential Customers
- 20. Research Methodology
List of Figures
- Figure 1: Global Mercury Industry Revenue Breakdown (Million, %) by Region 2025 & 2033
- Figure 2: Global Mercury Industry Volume Breakdown (K Tons, %) by Region 2025 & 2033
- Figure 3: Asia Pacific Mercury Industry Revenue (Million), by Product Type 2025 & 2033
- Figure 4: Asia Pacific Mercury Industry Volume (K Tons), by Product Type 2025 & 2033
- Figure 5: Asia Pacific Mercury Industry Revenue Share (%), by Product Type 2025 & 2033
- Figure 6: Asia Pacific Mercury Industry Volume Share (%), by Product Type 2025 & 2033
- Figure 7: Asia Pacific Mercury Industry Revenue (Million), by Application 2025 & 2033
- Figure 8: Asia Pacific Mercury Industry Volume (K Tons), by Application 2025 & 2033
- Figure 9: Asia Pacific Mercury Industry Revenue Share (%), by Application 2025 & 2033
- Figure 10: Asia Pacific Mercury Industry Volume Share (%), by Application 2025 & 2033
- Figure 11: Asia Pacific Mercury Industry Revenue (Million), by Country 2025 & 2033
- Figure 12: Asia Pacific Mercury Industry Volume (K Tons), by Country 2025 & 2033
- Figure 13: Asia Pacific Mercury Industry Revenue Share (%), by Country 2025 & 2033
- Figure 14: Asia Pacific Mercury Industry Volume Share (%), by Country 2025 & 2033
- Figure 15: North America Mercury Industry Revenue (Million), by Product Type 2025 & 2033
- Figure 16: North America Mercury Industry Volume (K Tons), by Product Type 2025 & 2033
- Figure 17: North America Mercury Industry Revenue Share (%), by Product Type 2025 & 2033
- Figure 18: North America Mercury Industry Volume Share (%), by Product Type 2025 & 2033
- Figure 19: North America Mercury Industry Revenue (Million), by Application 2025 & 2033
- Figure 20: North America Mercury Industry Volume (K Tons), by Application 2025 & 2033
- Figure 21: North America Mercury Industry Revenue Share (%), by Application 2025 & 2033
- Figure 22: North America Mercury Industry Volume Share (%), by Application 2025 & 2033
- Figure 23: North America Mercury Industry Revenue (Million), by Country 2025 & 2033
- Figure 24: North America Mercury Industry Volume (K Tons), by Country 2025 & 2033
- Figure 25: North America Mercury Industry Revenue Share (%), by Country 2025 & 2033
- Figure 26: North America Mercury Industry Volume Share (%), by Country 2025 & 2033
- Figure 27: Europe Mercury Industry Revenue (Million), by Product Type 2025 & 2033
- Figure 28: Europe Mercury Industry Volume (K Tons), by Product Type 2025 & 2033
- Figure 29: Europe Mercury Industry Revenue Share (%), by Product Type 2025 & 2033
- Figure 30: Europe Mercury Industry Volume Share (%), by Product Type 2025 & 2033
- Figure 31: Europe Mercury Industry Revenue (Million), by Application 2025 & 2033
- Figure 32: Europe Mercury Industry Volume (K Tons), by Application 2025 & 2033
- Figure 33: Europe Mercury Industry Revenue Share (%), by Application 2025 & 2033
- Figure 34: Europe Mercury Industry Volume Share (%), by Application 2025 & 2033
- Figure 35: Europe Mercury Industry Revenue (Million), by Country 2025 & 2033
- Figure 36: Europe Mercury Industry Volume (K Tons), by Country 2025 & 2033
- Figure 37: Europe Mercury Industry Revenue Share (%), by Country 2025 & 2033
- Figure 38: Europe Mercury Industry Volume Share (%), by Country 2025 & 2033
- Figure 39: South America Mercury Industry Revenue (Million), by Product Type 2025 & 2033
- Figure 40: South America Mercury Industry Volume (K Tons), by Product Type 2025 & 2033
- Figure 41: South America Mercury Industry Revenue Share (%), by Product Type 2025 & 2033
- Figure 42: South America Mercury Industry Volume Share (%), by Product Type 2025 & 2033
- Figure 43: South America Mercury Industry Revenue (Million), by Application 2025 & 2033
- Figure 44: South America Mercury Industry Volume (K Tons), by Application 2025 & 2033
- Figure 45: South America Mercury Industry Revenue Share (%), by Application 2025 & 2033
- Figure 46: South America Mercury Industry Volume Share (%), by Application 2025 & 2033
- Figure 47: South America Mercury Industry Revenue (Million), by Country 2025 & 2033
- Figure 48: South America Mercury Industry Volume (K Tons), by Country 2025 & 2033
- Figure 49: South America Mercury Industry Revenue Share (%), by Country 2025 & 2033
- Figure 50: South America Mercury Industry Volume Share (%), by Country 2025 & 2033
- Figure 51: Middle East and Africa Mercury Industry Revenue (Million), by Product Type 2025 & 2033
- Figure 52: Middle East and Africa Mercury Industry Volume (K Tons), by Product Type 2025 & 2033
- Figure 53: Middle East and Africa Mercury Industry Revenue Share (%), by Product Type 2025 & 2033
- Figure 54: Middle East and Africa Mercury Industry Volume Share (%), by Product Type 2025 & 2033
- Figure 55: Middle East and Africa Mercury Industry Revenue (Million), by Application 2025 & 2033
- Figure 56: Middle East and Africa Mercury Industry Volume (K Tons), by Application 2025 & 2033
- Figure 57: Middle East and Africa Mercury Industry Revenue Share (%), by Application 2025 & 2033
- Figure 58: Middle East and Africa Mercury Industry Volume Share (%), by Application 2025 & 2033
- Figure 59: Middle East and Africa Mercury Industry Revenue (Million), by Country 2025 & 2033
- Figure 60: Middle East and Africa Mercury Industry Volume (K Tons), by Country 2025 & 2033
- Figure 61: Middle East and Africa Mercury Industry Revenue Share (%), by Country 2025 & 2033
- Figure 62: Middle East and Africa Mercury Industry Volume Share (%), by Country 2025 & 2033
- Figure 63: Saudi Arabia Mercury Industry Revenue (Million), by Product Type 2025 & 2033
- Figure 64: Saudi Arabia Mercury Industry Volume (K Tons), by Product Type 2025 & 2033
- Figure 65: Saudi Arabia Mercury Industry Revenue Share (%), by Product Type 2025 & 2033
- Figure 66: Saudi Arabia Mercury Industry Volume Share (%), by Product Type 2025 & 2033
- Figure 67: Saudi Arabia Mercury Industry Revenue (Million), by Application 2025 & 2033
- Figure 68: Saudi Arabia Mercury Industry Volume (K Tons), by Application 2025 & 2033
- Figure 69: Saudi Arabia Mercury Industry Revenue Share (%), by Application 2025 & 2033
- Figure 70: Saudi Arabia Mercury Industry Volume Share (%), by Application 2025 & 2033
- Figure 71: Saudi Arabia Mercury Industry Revenue (Million), by Country 2025 & 2033
- Figure 72: Saudi Arabia Mercury Industry Volume (K Tons), by Country 2025 & 2033
- Figure 73: Saudi Arabia Mercury Industry Revenue Share (%), by Country 2025 & 2033
- Figure 74: Saudi Arabia Mercury Industry Volume Share (%), by Country 2025 & 2033
- Figure 75: South Africa Mercury Industry Revenue (Million), by Product Type 2025 & 2033
- Figure 76: South Africa Mercury Industry Volume (K Tons), by Product Type 2025 & 2033
- Figure 77: South Africa Mercury Industry Revenue Share (%), by Product Type 2025 & 2033
- Figure 78: South Africa Mercury Industry Volume Share (%), by Product Type 2025 & 2033
- Figure 79: South Africa Mercury Industry Revenue (Million), by Application 2025 & 2033
- Figure 80: South Africa Mercury Industry Volume (K Tons), by Application 2025 & 2033
- Figure 81: South Africa Mercury Industry Revenue Share (%), by Application 2025 & 2033
- Figure 82: South Africa Mercury Industry Volume Share (%), by Application 2025 & 2033
- Figure 83: South Africa Mercury Industry Revenue (Million), by Country 2025 & 2033
- Figure 84: South Africa Mercury Industry Volume (K Tons), by Country 2025 & 2033
- Figure 85: South Africa Mercury Industry Revenue Share (%), by Country 2025 & 2033
- Figure 86: South Africa Mercury Industry Volume Share (%), by Country 2025 & 2033
- Figure 87: Nigeria Mercury Industry Revenue (Million), by Product Type 2025 & 2033
- Figure 88: Nigeria Mercury Industry Volume (K Tons), by Product Type 2025 & 2033
- Figure 89: Nigeria Mercury Industry Revenue Share (%), by Product Type 2025 & 2033
- Figure 90: Nigeria Mercury Industry Volume Share (%), by Product Type 2025 & 2033
- Figure 91: Nigeria Mercury Industry Revenue (Million), by Application 2025 & 2033
- Figure 92: Nigeria Mercury Industry Volume (K Tons), by Application 2025 & 2033
- Figure 93: Nigeria Mercury Industry Revenue Share (%), by Application 2025 & 2033
- Figure 94: Nigeria Mercury Industry Volume Share (%), by Application 2025 & 2033
- Figure 95: Nigeria Mercury Industry Revenue (Million), by Country 2025 & 2033
- Figure 96: Nigeria Mercury Industry Volume (K Tons), by Country 2025 & 2033
- Figure 97: Nigeria Mercury Industry Revenue Share (%), by Country 2025 & 2033
- Figure 98: Nigeria Mercury Industry Volume Share (%), by Country 2025 & 2033
- Figure 99: Qatar Mercury Industry Revenue (Million), by Product Type 2025 & 2033
- Figure 100: Qatar Mercury Industry Volume (K Tons), by Product Type 2025 & 2033
- Figure 101: Qatar Mercury Industry Revenue Share (%), by Product Type 2025 & 2033
- Figure 102: Qatar Mercury Industry Volume Share (%), by Product Type 2025 & 2033
- Figure 103: Qatar Mercury Industry Revenue (Million), by Application 2025 & 2033
- Figure 104: Qatar Mercury Industry Volume (K Tons), by Application 2025 & 2033
- Figure 105: Qatar Mercury Industry Revenue Share (%), by Application 2025 & 2033
- Figure 106: Qatar Mercury Industry Volume Share (%), by Application 2025 & 2033
- Figure 107: Qatar Mercury Industry Revenue (Million), by Country 2025 & 2033
- Figure 108: Qatar Mercury Industry Volume (K Tons), by Country 2025 & 2033
- Figure 109: Qatar Mercury Industry Revenue Share (%), by Country 2025 & 2033
- Figure 110: Qatar Mercury Industry Volume Share (%), by Country 2025 & 2033
- Figure 111: Egypt Mercury Industry Revenue (Million), by Product Type 2025 & 2033
- Figure 112: Egypt Mercury Industry Volume (K Tons), by Product Type 2025 & 2033
- Figure 113: Egypt Mercury Industry Revenue Share (%), by Product Type 2025 & 2033
- Figure 114: Egypt Mercury Industry Volume Share (%), by Product Type 2025 & 2033
- Figure 115: Egypt Mercury Industry Revenue (Million), by Application 2025 & 2033
- Figure 116: Egypt Mercury Industry Volume (K Tons), by Application 2025 & 2033
- Figure 117: Egypt Mercury Industry Revenue Share (%), by Application 2025 & 2033
- Figure 118: Egypt Mercury Industry Volume Share (%), by Application 2025 & 2033
- Figure 119: Egypt Mercury Industry Revenue (Million), by Country 2025 & 2033
- Figure 120: Egypt Mercury Industry Volume (K Tons), by Country 2025 & 2033
- Figure 121: Egypt Mercury Industry Revenue Share (%), by Country 2025 & 2033
- Figure 122: Egypt Mercury Industry Volume Share (%), by Country 2025 & 2033
- Figure 123: UAE Mercury Industry Revenue (Million), by Product Type 2025 & 2033
- Figure 124: UAE Mercury Industry Volume (K Tons), by Product Type 2025 & 2033
- Figure 125: UAE Mercury Industry Revenue Share (%), by Product Type 2025 & 2033
- Figure 126: UAE Mercury Industry Volume Share (%), by Product Type 2025 & 2033
- Figure 127: UAE Mercury Industry Revenue (Million), by Application 2025 & 2033
- Figure 128: UAE Mercury Industry Volume (K Tons), by Application 2025 & 2033
- Figure 129: UAE Mercury Industry Revenue Share (%), by Application 2025 & 2033
- Figure 130: UAE Mercury Industry Volume Share (%), by Application 2025 & 2033
- Figure 131: UAE Mercury Industry Revenue (Million), by Country 2025 & 2033
- Figure 132: UAE Mercury Industry Volume (K Tons), by Country 2025 & 2033
- Figure 133: UAE Mercury Industry Revenue Share (%), by Country 2025 & 2033
- Figure 134: UAE Mercury Industry Volume Share (%), by Country 2025 & 2033
- Figure 135: Rest of Middle East and Africa Mercury Industry Revenue (Million), by Product Type 2025 & 2033
- Figure 136: Rest of Middle East and Africa Mercury Industry Volume (K Tons), by Product Type 2025 & 2033
- Figure 137: Rest of Middle East and Africa Mercury Industry Revenue Share (%), by Product Type 2025 & 2033
- Figure 138: Rest of Middle East and Africa Mercury Industry Volume Share (%), by Product Type 2025 & 2033
- Figure 139: Rest of Middle East and Africa Mercury Industry Revenue (Million), by Application 2025 & 2033
- Figure 140: Rest of Middle East and Africa Mercury Industry Volume (K Tons), by Application 2025 & 2033
- Figure 141: Rest of Middle East and Africa Mercury Industry Revenue Share (%), by Application 2025 & 2033
- Figure 142: Rest of Middle East and Africa Mercury Industry Volume Share (%), by Application 2025 & 2033
- Figure 143: Rest of Middle East and Africa Mercury Industry Revenue (Million), by Country 2025 & 2033
- Figure 144: Rest of Middle East and Africa Mercury Industry Volume (K Tons), by Country 2025 & 2033
- Figure 145: Rest of Middle East and Africa Mercury Industry Revenue Share (%), by Country 2025 & 2033
- Figure 146: Rest of Middle East and Africa Mercury Industry Volume Share (%), by Country 2025 & 2033
List of Tables
- Table 1: Global Mercury Industry Revenue Million Forecast, by Product Type 2020 & 2033
- Table 2: Global Mercury Industry Volume K Tons Forecast, by Product Type 2020 & 2033
- Table 3: Global Mercury Industry Revenue Million Forecast, by Application 2020 & 2033
- Table 4: Global Mercury Industry Volume K Tons Forecast, by Application 2020 & 2033
- Table 5: Global Mercury Industry Revenue Million Forecast, by Region 2020 & 2033
- Table 6: Global Mercury Industry Volume K Tons Forecast, by Region 2020 & 2033
- Table 7: Global Mercury Industry Revenue Million Forecast, by Product Type 2020 & 2033
- Table 8: Global Mercury Industry Volume K Tons Forecast, by Product Type 2020 & 2033
- Table 9: Global Mercury Industry Revenue Million Forecast, by Application 2020 & 2033
- Table 10: Global Mercury Industry Volume K Tons Forecast, by Application 2020 & 2033
- Table 11: Global Mercury Industry Revenue Million Forecast, by Country 2020 & 2033
- Table 12: Global Mercury Industry Volume K Tons Forecast, by Country 2020 & 2033
- Table 13: China Mercury Industry Revenue (Million) Forecast, by Application 2020 & 2033
- Table 14: China Mercury Industry Volume (K Tons) Forecast, by Application 2020 & 2033
- Table 15: India Mercury Industry Revenue (Million) Forecast, by Application 2020 & 2033
- Table 16: India Mercury Industry Volume (K Tons) Forecast, by Application 2020 & 2033
- Table 17: Japan Mercury Industry Revenue (Million) Forecast, by Application 2020 & 2033
- Table 18: Japan Mercury Industry Volume (K Tons) Forecast, by Application 2020 & 2033
- Table 19: South Korea Mercury Industry Revenue (Million) Forecast, by Application 2020 & 2033
- Table 20: South Korea Mercury Industry Volume (K Tons) Forecast, by Application 2020 & 2033
- Table 21: Malaysia Mercury Industry Revenue (Million) Forecast, by Application 2020 & 2033
- Table 22: Malaysia Mercury Industry Volume (K Tons) Forecast, by Application 2020 & 2033
- Table 23: Thailand Mercury Industry Revenue (Million) Forecast, by Application 2020 & 2033
- Table 24: Thailand Mercury Industry Volume (K Tons) Forecast, by Application 2020 & 2033
- Table 25: Indonesia Mercury Industry Revenue (Million) Forecast, by Application 2020 & 2033
- Table 26: Indonesia Mercury Industry Volume (K Tons) Forecast, by Application 2020 & 2033
- Table 27: Vietnam Mercury Industry Revenue (Million) Forecast, by Application 2020 & 2033
- Table 28: Vietnam Mercury Industry Volume (K Tons) Forecast, by Application 2020 & 2033
- Table 29: Rest of Asia Pacific Mercury Industry Revenue (Million) Forecast, by Application 2020 & 2033
- Table 30: Rest of Asia Pacific Mercury Industry Volume (K Tons) Forecast, by Application 2020 & 2033
- Table 31: Global Mercury Industry Revenue Million Forecast, by Product Type 2020 & 2033
- Table 32: Global Mercury Industry Volume K Tons Forecast, by Product Type 2020 & 2033
- Table 33: Global Mercury Industry Revenue Million Forecast, by Application 2020 & 2033
- Table 34: Global Mercury Industry Volume K Tons Forecast, by Application 2020 & 2033
- Table 35: Global Mercury Industry Revenue Million Forecast, by Country 2020 & 2033
- Table 36: Global Mercury Industry Volume K Tons Forecast, by Country 2020 & 2033
- Table 37: United States Mercury Industry Revenue (Million) Forecast, by Application 2020 & 2033
- Table 38: United States Mercury Industry Volume (K Tons) Forecast, by Application 2020 & 2033
- Table 39: Canada Mercury Industry Revenue (Million) Forecast, by Application 2020 & 2033
- Table 40: Canada Mercury Industry Volume (K Tons) Forecast, by Application 2020 & 2033
- Table 41: Mexico Mercury Industry Revenue (Million) Forecast, by Application 2020 & 2033
- Table 42: Mexico Mercury Industry Volume (K Tons) Forecast, by Application 2020 & 2033
- Table 43: Global Mercury Industry Revenue Million Forecast, by Product Type 2020 & 2033
- Table 44: Global Mercury Industry Volume K Tons Forecast, by Product Type 2020 & 2033
- Table 45: Global Mercury Industry Revenue Million Forecast, by Application 2020 & 2033
- Table 46: Global Mercury Industry Volume K Tons Forecast, by Application 2020 & 2033
- Table 47: Global Mercury Industry Revenue Million Forecast, by Country 2020 & 2033
- Table 48: Global Mercury Industry Volume K Tons Forecast, by Country 2020 & 2033
- Table 49: Germany Mercury Industry Revenue (Million) Forecast, by Application 2020 & 2033
- Table 50: Germany Mercury Industry Volume (K Tons) Forecast, by Application 2020 & 2033
- Table 51: United Kingdom Mercury Industry Revenue (Million) Forecast, by Application 2020 & 2033
- Table 52: United Kingdom Mercury Industry Volume (K Tons) Forecast, by Application 2020 & 2033
- Table 53: France Mercury Industry Revenue (Million) Forecast, by Application 2020 & 2033
- Table 54: France Mercury Industry Volume (K Tons) Forecast, by Application 2020 & 2033
- Table 55: Italy Mercury Industry Revenue (Million) Forecast, by Application 2020 & 2033
- Table 56: Italy Mercury Industry Volume (K Tons) Forecast, by Application 2020 & 2033
- Table 57: Spain Mercury Industry Revenue (Million) Forecast, by Application 2020 & 2033
- Table 58: Spain Mercury Industry Volume (K Tons) Forecast, by Application 2020 & 2033
- Table 59: NORDIC Mercury Industry Revenue (Million) Forecast, by Application 2020 & 2033
- Table 60: NORDIC Mercury Industry Volume (K Tons) Forecast, by Application 2020 & 2033
- Table 61: Turkey Mercury Industry Revenue (Million) Forecast, by Application 2020 & 2033
- Table 62: Turkey Mercury Industry Volume (K Tons) Forecast, by Application 2020 & 2033
- Table 63: Russia Mercury Industry Revenue (Million) Forecast, by Application 2020 & 2033
- Table 64: Russia Mercury Industry Volume (K Tons) Forecast, by Application 2020 & 2033
- Table 65: Rest of Europe Mercury Industry Revenue (Million) Forecast, by Application 2020 & 2033
- Table 66: Rest of Europe Mercury Industry Volume (K Tons) Forecast, by Application 2020 & 2033
- Table 67: Global Mercury Industry Revenue Million Forecast, by Product Type 2020 & 2033
- Table 68: Global Mercury Industry Volume K Tons Forecast, by Product Type 2020 & 2033
- Table 69: Global Mercury Industry Revenue Million Forecast, by Application 2020 & 2033
- Table 70: Global Mercury Industry Volume K Tons Forecast, by Application 2020 & 2033
- Table 71: Global Mercury Industry Revenue Million Forecast, by Country 2020 & 2033
- Table 72: Global Mercury Industry Volume K Tons Forecast, by Country 2020 & 2033
- Table 73: Brazil Mercury Industry Revenue (Million) Forecast, by Application 2020 & 2033
- Table 74: Brazil Mercury Industry Volume (K Tons) Forecast, by Application 2020 & 2033
- Table 75: Argentina Mercury Industry Revenue (Million) Forecast, by Application 2020 & 2033
- Table 76: Argentina Mercury Industry Volume (K Tons) Forecast, by Application 2020 & 2033
- Table 77: Colombia Mercury Industry Revenue (Million) Forecast, by Application 2020 & 2033
- Table 78: Colombia Mercury Industry Volume (K Tons) Forecast, by Application 2020 & 2033
- Table 79: Rest of South America Mercury Industry Revenue (Million) Forecast, by Application 2020 & 2033
- Table 80: Rest of South America Mercury Industry Volume (K Tons) Forecast, by Application 2020 & 2033
- Table 81: Global Mercury Industry Revenue Million Forecast, by Product Type 2020 & 2033
- Table 82: Global Mercury Industry Volume K Tons Forecast, by Product Type 2020 & 2033
- Table 83: Global Mercury Industry Revenue Million Forecast, by Application 2020 & 2033
- Table 84: Global Mercury Industry Volume K Tons Forecast, by Application 2020 & 2033
- Table 85: Global Mercury Industry Revenue Million Forecast, by Country 2020 & 2033
- Table 86: Global Mercury Industry Volume K Tons Forecast, by Country 2020 & 2033
- Table 87: Global Mercury Industry Revenue Million Forecast, by Product Type 2020 & 2033
- Table 88: Global Mercury Industry Volume K Tons Forecast, by Product Type 2020 & 2033
- Table 89: Global Mercury Industry Revenue Million Forecast, by Application 2020 & 2033
- Table 90: Global Mercury Industry Volume K Tons Forecast, by Application 2020 & 2033
- Table 91: Global Mercury Industry Revenue Million Forecast, by Country 2020 & 2033
- Table 92: Global Mercury Industry Volume K Tons Forecast, by Country 2020 & 2033
- Table 93: Global Mercury Industry Revenue Million Forecast, by Product Type 2020 & 2033
- Table 94: Global Mercury Industry Volume K Tons Forecast, by Product Type 2020 & 2033
- Table 95: Global Mercury Industry Revenue Million Forecast, by Application 2020 & 2033
- Table 96: Global Mercury Industry Volume K Tons Forecast, by Application 2020 & 2033
- Table 97: Global Mercury Industry Revenue Million Forecast, by Country 2020 & 2033
- Table 98: Global Mercury Industry Volume K Tons Forecast, by Country 2020 & 2033
- Table 99: Global Mercury Industry Revenue Million Forecast, by Product Type 2020 & 2033
- Table 100: Global Mercury Industry Volume K Tons Forecast, by Product Type 2020 & 2033
- Table 101: Global Mercury Industry Revenue Million Forecast, by Application 2020 & 2033
- Table 102: Global Mercury Industry Volume K Tons Forecast, by Application 2020 & 2033
- Table 103: Global Mercury Industry Revenue Million Forecast, by Country 2020 & 2033
- Table 104: Global Mercury Industry Volume K Tons Forecast, by Country 2020 & 2033
- Table 105: Global Mercury Industry Revenue Million Forecast, by Product Type 2020 & 2033
- Table 106: Global Mercury Industry Volume K Tons Forecast, by Product Type 2020 & 2033
- Table 107: Global Mercury Industry Revenue Million Forecast, by Application 2020 & 2033
- Table 108: Global Mercury Industry Volume K Tons Forecast, by Application 2020 & 2033
- Table 109: Global Mercury Industry Revenue Million Forecast, by Country 2020 & 2033
- Table 110: Global Mercury Industry Volume K Tons Forecast, by Country 2020 & 2033
- Table 111: Global Mercury Industry Revenue Million Forecast, by Product Type 2020 & 2033
- Table 112: Global Mercury Industry Volume K Tons Forecast, by Product Type 2020 & 2033
- Table 113: Global Mercury Industry Revenue Million Forecast, by Application 2020 & 2033
- Table 114: Global Mercury Industry Volume K Tons Forecast, by Application 2020 & 2033
- Table 115: Global Mercury Industry Revenue Million Forecast, by Country 2020 & 2033
- Table 116: Global Mercury Industry Volume K Tons Forecast, by Country 2020 & 2033
- Table 117: Global Mercury Industry Revenue Million Forecast, by Product Type 2020 & 2033
- Table 118: Global Mercury Industry Volume K Tons Forecast, by Product Type 2020 & 2033
- Table 119: Global Mercury Industry Revenue Million Forecast, by Application 2020 & 2033
- Table 120: Global Mercury Industry Volume K Tons Forecast, by Application 2020 & 2033
- Table 121: Global Mercury Industry Revenue Million Forecast, by Country 2020 & 2033
- Table 122: Global Mercury Industry Volume K Tons Forecast, by Country 2020 & 2033
- Table 123: Global Mercury Industry Revenue Million Forecast, by Product Type 2020 & 2033
- Table 124: Global Mercury Industry Volume K Tons Forecast, by Product Type 2020 & 2033
- Table 125: Global Mercury Industry Revenue Million Forecast, by Application 2020 & 2033
- Table 126: Global Mercury Industry Volume K Tons Forecast, by Application 2020 & 2033
- Table 127: Global Mercury Industry Revenue Million Forecast, by Country 2020 & 2033
- Table 128: Global Mercury Industry Volume K Tons Forecast, by Country 2020 & 2033
Frequently Asked Questions
1. What is the projected Compound Annual Growth Rate (CAGR) of the Mercury Industry?
The projected CAGR is approximately > 1.00%.
2. Which companies are prominent players in the Mercury Industry?
Key companies in the market include Merck KGaA, Tamilnadu Engineering Instruments, China Jin Run Industrial Co Ltd, Wake Group, Antares Chem Private Limited, Bethlehem Apparatus Co Inc, Aldrett Hermanos, Mayasa, Special Metals, Powder Pack Chem, Avantor Performance Materials.
3. What are the main segments of the Mercury Industry?
The market segments include Product Type, Application.
4. Can you provide details about the market size?
The market size is estimated to be USD 4.40 Million as of 2022.
5. What are some drivers contributing to market growth?
Demand from Measuring and Controlling Devices; Demand for Sphygmomanometer for the Measurement of Blood Pressure; Widely Used in the Mining Sector for the Extraction of Gold.
6. What are the notable trends driving market growth?
Measuring and Controlling Devices to be the largest segment.
7. Are there any restraints impacting market growth?
Hazardous Properties of Mercury; Other Restraints.
8. Can you provide examples of recent developments in the market?
Jul 2023: The European Commission adopted a proposal to revise the Mercury Regulation to protect EU citizens and the environment from toxic mercury. The revision will fully prohibit the use of dental amalgam, which currently uses 40 tonnes of mercury in the EU annually.
9. What pricing options are available for accessing the report?
Pricing options include single-user, multi-user, and enterprise licenses priced at USD 4750, USD 5250, and USD 8750 respectively.
10. Is the market size provided in terms of value or volume?
The market size is provided in terms of value, measured in Million and volume, measured in K Tons.
11. Are there any specific market keywords associated with the report?
Yes, the market keyword associated with the report is "Mercury Industry," which aids in identifying and referencing the specific market segment covered.
12. How do I determine which pricing option suits my needs best?
The pricing options vary based on user requirements and access needs. Individual users may opt for single-user licenses, while businesses requiring broader access may choose multi-user or enterprise licenses for cost-effective access to the report.
13. Are there any additional resources or data provided in the Mercury Industry report?
While the report offers comprehensive insights, it's advisable to review the specific contents or supplementary materials provided to ascertain if additional resources or data are available.
14. How can I stay updated on further developments or reports in the Mercury Industry?
To stay informed about further developments, trends, and reports in the Mercury Industry, consider subscribing to industry newsletters, following relevant companies and organizations, or regularly checking reputable industry news sources and publications.
Methodology
Step 1 - Identification of Relevant Samples Size from Population Database


Step 2 - Approaches for Defining Global Market Size (Value, Volume* & Price*)

Note*: In applicable scenarios
Step 3 - Data Sources
Primary Research
- Web Analytics
- Survey Reports
- Research Institute
- Latest Research Reports
- Opinion Leaders
Secondary Research
- Annual Reports
- White Paper
- Latest Press Release
- Industry Association
- Paid Database
- Investor Presentations

Step 4 - Data Triangulation
Involves using different sources of information in order to increase the validity of a study
These sources are likely to be stakeholders in a program - participants, other researchers, program staff, other community members, and so on.
Then we put all data in single framework & apply various statistical tools to find out the dynamic on the market.
During the analysis stage, feedback from the stakeholder groups would be compared to determine areas of agreement as well as areas of divergence

