

Key Insights
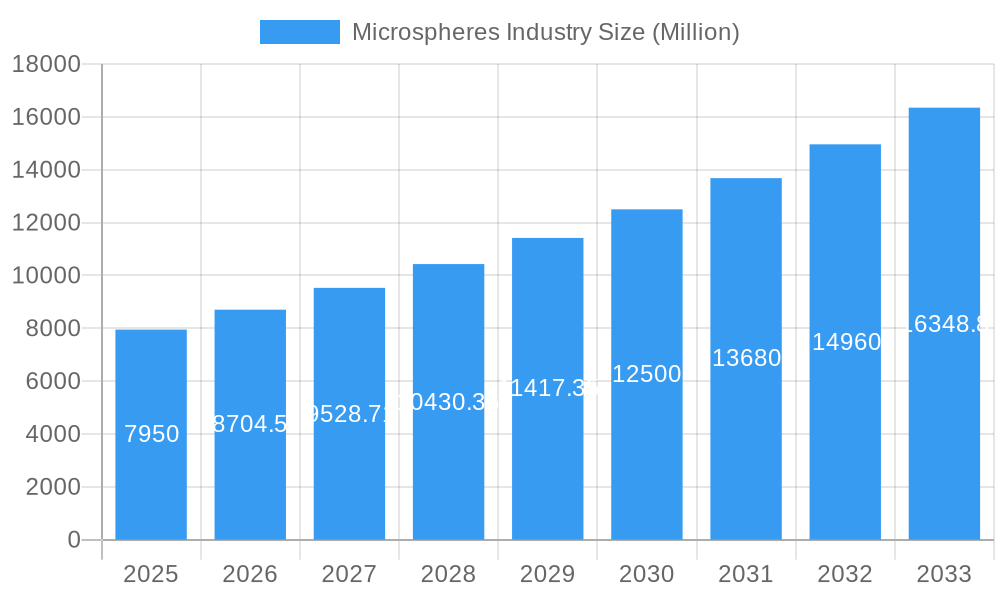
The global microspheres market, valued at $7.95 billion in 2025, is projected to experience robust growth, driven by increasing demand across diverse applications. A Compound Annual Growth Rate (CAGR) of 9.10% from 2025 to 2033 indicates significant expansion potential. Key drivers include the rising adoption of microspheres in advanced medical technologies, particularly drug delivery systems and diagnostics, alongside growing applications in the automotive and aerospace industries for lightweighting and enhanced material properties. The automotive sector's push for fuel efficiency and improved performance is a significant catalyst, while the aerospace industry leverages microspheres for their unique thermal and insulation characteristics. Furthermore, the cosmetics and paints and coatings sectors are experiencing growth due to the incorporation of microspheres for enhanced texture, durability, and aesthetic properties. The market segmentation reveals a diverse landscape, with glass, polymer, and ceramic microspheres holding significant market share in terms of raw materials, while hollow and solid types cater to specific application requirements. The Asia Pacific region, particularly China and India, is expected to be a key growth driver due to increasing industrialization and expanding healthcare sectors. However, challenges such as the high cost of specialized microsphere manufacturing and the need for stringent quality control measures might pose limitations to the overall market growth.

Microspheres Industry Market Size (In Billion)
The market is characterized by both large established players and specialized niche companies. Key players such as 3M, Momentive, and Siemens Healthineers AG contribute significantly to the market's growth through their innovative product offerings and robust distribution networks. However, the presence of numerous smaller, specialized companies indicates a high degree of innovation and competition in the market. Future growth is anticipated to be further shaped by advancements in microsphere manufacturing technologies, the development of novel materials with improved functionalities, and increased regulatory approvals for medical applications. The continued emphasis on sustainability and the exploration of eco-friendly raw materials like fly ash will also play a crucial role in shaping the market dynamics in the coming years.
Microspheres Industry Company Market Share
This comprehensive report provides an in-depth analysis of the global microspheres industry, covering market size, segmentation, key players, growth drivers, challenges, and future outlook. The study period spans from 2019 to 2033, with 2025 serving as the base and estimated year. The forecast period is 2025-2033, and the historical period is 2019-2024. The report offers actionable insights for industry stakeholders, including manufacturers, suppliers, distributors, and investors. The global market value is projected to reach xx Million by 2033.
Microspheres Industry Market Concentration & Innovation
The microspheres market presents a moderately concentrated landscape, dominated by several key players holding substantial market share. Prominent companies such as Merit Medical Systems, Nouryon, and 3M significantly contribute to the overall market volume. However, a dynamic competitive environment exists due to the presence of numerous smaller, specialized manufacturers, fostering innovation and competition. Technological advancements in microsphere technology are driven by the persistent demand for lightweight yet high-strength materials across a wide array of applications. Regulatory compliance, particularly concerning material safety and environmental impact, significantly influences both product development and market access. While product substitution is limited due to the unique properties of microspheres, the emergence of advanced nanomaterials poses a potential long-term competitive threat. End-user trends strongly favor microspheres in applications demanding enhanced performance and reduced weight, notably within the automotive, aerospace, and medical sectors. This preference is fueled by increasing sustainability concerns and the drive for efficiency gains.
- Market Share: A precise quantification of market share held by the top five players in 2025 requires further investigation and access to proprietary market data. Industry reports and analysis from reputable market research firms should be consulted for definitive figures.
- M&A Activity: While precise figures on M&A deal values within the microspheres industry over the past five years are not readily accessible publicly, significant activity has been observed. These transactions often center on strategic expansions of product portfolios and geographical reach, aiming to enhance market penetration and competitiveness.
Microspheres Industry Industry Trends & Insights
The global microspheres market is experiencing robust growth, driven by increasing demand from various sectors. The Compound Annual Growth Rate (CAGR) is estimated at xx% during the forecast period (2025-2033). Technological advancements, such as the development of novel materials and improved production techniques, are further propelling market expansion. Consumer preferences for lightweight, high-performance products are fueling the adoption of microspheres in diverse applications. Competitive dynamics are characterized by innovation, strategic partnerships, and capacity expansion. Market penetration varies considerably across different segments and geographical regions. For example, the medical technology sector is showing a higher CAGR (xx%) compared to the automotive sector (xx%). The increasing adoption of microspheres in lightweighting applications in the automotive industry is projected to drive significant market growth, with a market penetration rate reaching xx% by 2033.
Dominant Markets & Segments in Microspheres Industry
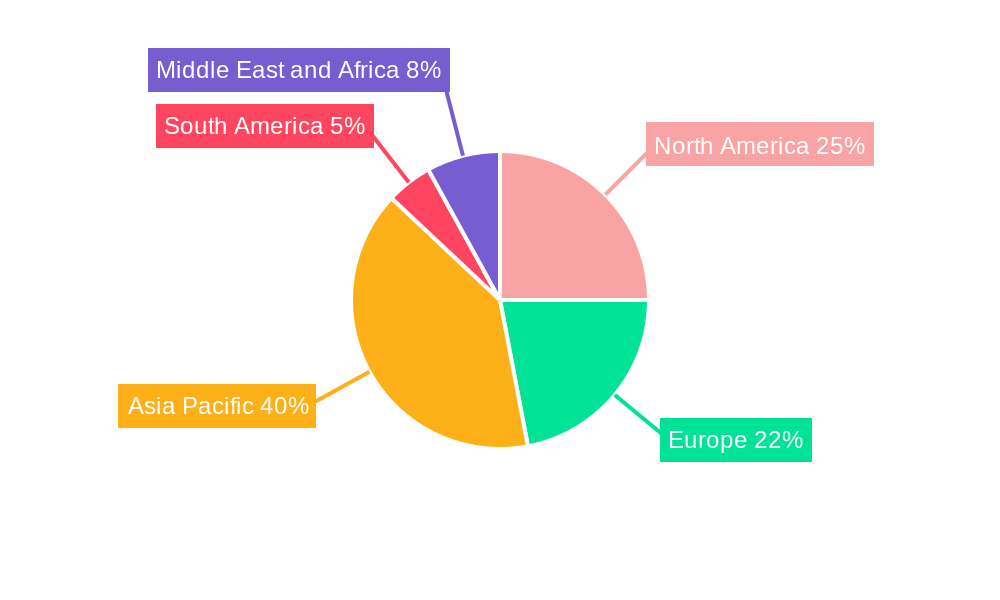
The global microspheres market is dominated by the [Region Name], representing xx% of the global market in 2025. Key drivers for this dominance include robust industrial growth, favorable government policies, and a well-established manufacturing infrastructure. Within the segments, the Hollow microspheres type holds the largest market share due to its superior properties in specific applications such as insulation and lightweighting. The Glass raw material segment is the largest, followed by the Polymer segment. The Automotive and Medical Technology application segments demonstrate the strongest growth prospects, driven by increasing demand for lightweight and high-performance materials.
Key Drivers for Dominant Region:
- Strong industrial growth and manufacturing base.
- Supportive government policies and regulations.
- Availability of skilled labor and resources.
- Growing investments in R&D.
Dominant Segments:
- Raw Material: Glass (Market Size: xx Million in 2025)
- Type: Hollow (Market Size: xx Million in 2025)
- Application: Automotive (Market Size: xx Million in 2025), Medical Technology (Market Size: xx Million in 2025)
Microspheres Industry Product Developments
Recent advancements in microsphere technology focus on improving material properties, such as strength, durability, and thermal stability. New manufacturing processes enable the creation of microspheres with customized properties tailored to specific applications. These innovations have broadened the market applications of microspheres and enhance their competitive advantages in various industries. The introduction of novel polymer and ceramic microspheres with enhanced properties such as improved biocompatibility, higher strength, and temperature resistance are driving the expansion into high-value applications.
Report Scope & Segmentation Analysis
This report provides a comprehensive segmentation of the microspheres market, categorized by raw material (Glass, Polymer, Ceramic, Fly Ash, Metallic, and Other Raw Materials), type (Hollow and Solid), and application (Automotive, Aerospace, Cosmetics, Oil and Gas, Paints and Coatings, Medical Technology, Composites, and Other Applications). A detailed analysis is presented for each segment, encompassing growth projections, market sizes (in Million USD), and competitive landscapes. For instance, the Glass raw material segment consistently demonstrates robust growth due to its cost-effectiveness and widespread applicability. Simultaneously, the Medical Technology application segment exhibits substantial growth potential, driven by the escalating demand for sophisticated medical devices. The overall market forecast points towards sustained growth across all segments, fueled by the previously outlined market drivers.
Key Drivers of Microspheres Industry Growth
The expansion of the microspheres market is propelled by several key factors:
- Lightweighting trends: The burgeoning demand for lightweight materials across diverse industries, particularly in the automotive and aerospace sectors, serves as a primary growth catalyst. This is driven by fuel efficiency demands and performance optimization.
- Technological advancements: Continuous refinements in manufacturing processes and material properties consistently enhance the performance and versatility of microspheres, opening up new application possibilities.
- Favorable government regulations: Supportive government policies and initiatives promoting sustainable and energy-efficient technologies significantly boost the adoption of microspheres in insulation and related applications.
- Increasing demand in various end-use industries: The robust and expanding demand from key sectors such as automotive, aerospace, medical technology, and construction is a major contributor to market growth.
Challenges in the Microspheres Industry Sector
Despite significant growth potential, the microspheres industry faces several challenges:
- Fluctuations in raw material prices: Volatility in raw material costs directly impacts overall production expenses and profitability, potentially hindering market growth.
- Stringent regulatory requirements: Meeting stringent environmental and safety regulations introduces complexity and increases costs throughout the manufacturing process.
- Intense competition: The presence of numerous established and emerging players creates a highly competitive market landscape, influencing market share dynamics.
- Supply chain disruptions: Global supply chain vulnerabilities and disruptions can significantly impact the availability of raw materials and compromise production efficiency.
Emerging Opportunities in Microspheres Industry
The microspheres industry presents several exciting opportunities, such as:
- Development of advanced materials: The development of novel microspheres with enhanced properties opens doors to new applications and markets.
- Expansion into new applications: Exploration of novel applications in emerging industries like renewable energy and 3D printing offers significant growth potential.
- Strategic partnerships and collaborations: Synergistic partnerships and collaborations can accelerate innovation and market penetration.
- Focus on sustainable and eco-friendly materials: Growing environmental concerns create a demand for sustainable microsphere solutions.
Leading Players in the Microspheres Industry Market
- Merit Medical Systems
- Nouryon
- Matsumoto Yushi-seiyaku Co Ltd
- Cospheric LLC
- Luminex Corporation (Diasorin Spa)
- Bangs Laboratories Inc
- 3M
- Chase Corporation
- Momentive
- Potters Industries LLC
- Siemens Healthineers AG
- Mo-sci Corporation (Heraeus Holdings)
- Kureha Corporation
- Trelleborg AB
Key Developments in Microspheres Industry Industry
- June 2022: Nouryon introduced expancel HP92 microspheres for lightweight, high-pressure-resistant automotive underbody coatings and sealants. Production began in Stockvik, Sweden, with expansion planned for Green Bay, Wisconsin in early 2023.
- February 2022: 3M's glass bubbles were used for large-scale insulation of NASA's new liquid hydrogen storage tank, showcasing the material's high strength and low density. Two tankers of glass bubbles were delivered daily for 30 days.
Strategic Outlook for Microspheres Industry Market
The microspheres market is poised for continued growth, driven by the factors discussed earlier. Expanding applications in lightweighting, insulation, and advanced medical devices will fuel market expansion. Innovation in material science and manufacturing processes will further enhance the performance and versatility of microspheres, opening new market opportunities. Strategic partnerships and investments in R&D will play a critical role in shaping the future of the industry. The market is expected to witness significant growth in the coming years, with an estimated value of xx Million by 2033.
Microspheres Industry Segmentation
-
1. Raw Material
- 1.1. Glass
- 1.2. Polymer
- 1.3. Ceramic
- 1.4. Fly Ash
- 1.5. Metallic
- 1.6. Other Raw Materials
-
2. Type
- 2.1. Hollow
- 2.2. Soild
-
3. Application
- 3.1. Automotive
- 3.2. Aerospace
- 3.3. Cosmetics
- 3.4. Oil and Gas
- 3.5. Paints and Coatings
- 3.6. Medical Technology
- 3.7. Composites
- 3.8. Other Applications
Microspheres Industry Segmentation By Geography
-
1. Asia Pacific
- 1.1. China
- 1.2. India
- 1.3. Japan
- 1.4. South Korea
- 1.5. Rest of Asia Pacific
-
2. North America
- 2.1. United States
- 2.2. Canada
- 2.3. Mexico
-
3. Europe
- 3.1. Germany
- 3.2. United Kingdom
- 3.3. Italy
- 3.4. France
- 3.5. Rest of Europe
-
4. South America
- 4.1. Brazil
- 4.2. Argentina
- 4.3. Rest of South America
-
5. Middle East and Africa
- 5.1. Saudi Arabia
- 5.2. South Africa
- 5.3. Rest of Middle East and Africa
Microspheres Industry Regional Market Share
Geographic Coverage of Microspheres Industry
Microspheres Industry REPORT HIGHLIGHTS
| Aspects | Details |
|---|---|
| Study Period | 2020-2034 |
| Base Year | 2025 |
| Estimated Year | 2026 |
| Forecast Period | 2026-2034 |
| Historical Period | 2020-2025 |
| Growth Rate | CAGR of 9.10% from 2020-2034 |
| Segmentation |
|
Table of Contents
- 1. Introduction
- 1.1. Research Scope
- 1.2. Market Segmentation
- 1.3. Research Objective
- 1.4. Definitions and Assumptions
- 2. Executive Summary
- 2.1. Market Snapshot
- 3. Market Dynamics
- 3.1. Market Drivers
- 3.2. Market Restrains
- 3.3. Market Trends
- 3.4. Market Opportunities
- 4. Market Factor Analysis
- 4.1. Porters Five Forces
- 4.1.1. Bargaining Power of Suppliers
- 4.1.2. Bargaining Power of Buyers
- 4.1.3. Threat of New Entrants
- 4.1.4. Threat of Substitutes
- 4.1.5. Competitive Rivalry
- 4.2. PESTEL analysis
- 4.3. BCG Analysis
- 4.3.1. Stars (High Growth, High Market Share)
- 4.3.2. Cash Cows (Low Growth, High Market Share)
- 4.3.3. Question Mark (High Growth, Low Market Share)
- 4.3.4. Dogs (Low Growth, Low Market Share)
- 4.4. Ansoff Matrix Analysis
- 4.5. Supply Chain Analysis
- 4.6. Regulatory Landscape
- 4.7. Current Market Potential and Opportunity Assessment (TAM–SAM–SOM Framework)
- 4.8. RAX Analyst Note
- 4.1. Porters Five Forces
- 5. Market Analysis, Insights and Forecast 2021-2033
- 5.1. Market Analysis, Insights and Forecast - by Raw Material
- 5.1.1. Glass
- 5.1.2. Polymer
- 5.1.3. Ceramic
- 5.1.4. Fly Ash
- 5.1.5. Metallic
- 5.1.6. Other Raw Materials
- 5.2. Market Analysis, Insights and Forecast - by Type
- 5.2.1. Hollow
- 5.2.2. Soild
- 5.3. Market Analysis, Insights and Forecast - by Application
- 5.3.1. Automotive
- 5.3.2. Aerospace
- 5.3.3. Cosmetics
- 5.3.4. Oil and Gas
- 5.3.5. Paints and Coatings
- 5.3.6. Medical Technology
- 5.3.7. Composites
- 5.3.8. Other Applications
- 5.4. Market Analysis, Insights and Forecast - by Region
- 5.4.1. Asia Pacific
- 5.4.2. North America
- 5.4.3. Europe
- 5.4.4. South America
- 5.4.5. Middle East and Africa
- 5.1. Market Analysis, Insights and Forecast - by Raw Material
- 6. Global Microspheres Industry Analysis, Insights and Forecast, 2021-2033
- 6.1. Market Analysis, Insights and Forecast - by Raw Material
- 6.1.1. Glass
- 6.1.2. Polymer
- 6.1.3. Ceramic
- 6.1.4. Fly Ash
- 6.1.5. Metallic
- 6.1.6. Other Raw Materials
- 6.2. Market Analysis, Insights and Forecast - by Type
- 6.2.1. Hollow
- 6.2.2. Soild
- 6.3. Market Analysis, Insights and Forecast - by Application
- 6.3.1. Automotive
- 6.3.2. Aerospace
- 6.3.3. Cosmetics
- 6.3.4. Oil and Gas
- 6.3.5. Paints and Coatings
- 6.3.6. Medical Technology
- 6.3.7. Composites
- 6.3.8. Other Applications
- 6.1. Market Analysis, Insights and Forecast - by Raw Material
- 7. Asia Pacific Microspheres Industry Analysis, Insights and Forecast, 2020-2032
- 7.1. Market Analysis, Insights and Forecast - by Raw Material
- 7.1.1. Glass
- 7.1.2. Polymer
- 7.1.3. Ceramic
- 7.1.4. Fly Ash
- 7.1.5. Metallic
- 7.1.6. Other Raw Materials
- 7.2. Market Analysis, Insights and Forecast - by Type
- 7.2.1. Hollow
- 7.2.2. Soild
- 7.3. Market Analysis, Insights and Forecast - by Application
- 7.3.1. Automotive
- 7.3.2. Aerospace
- 7.3.3. Cosmetics
- 7.3.4. Oil and Gas
- 7.3.5. Paints and Coatings
- 7.3.6. Medical Technology
- 7.3.7. Composites
- 7.3.8. Other Applications
- 7.1. Market Analysis, Insights and Forecast - by Raw Material
- 8. North America Microspheres Industry Analysis, Insights and Forecast, 2020-2032
- 8.1. Market Analysis, Insights and Forecast - by Raw Material
- 8.1.1. Glass
- 8.1.2. Polymer
- 8.1.3. Ceramic
- 8.1.4. Fly Ash
- 8.1.5. Metallic
- 8.1.6. Other Raw Materials
- 8.2. Market Analysis, Insights and Forecast - by Type
- 8.2.1. Hollow
- 8.2.2. Soild
- 8.3. Market Analysis, Insights and Forecast - by Application
- 8.3.1. Automotive
- 8.3.2. Aerospace
- 8.3.3. Cosmetics
- 8.3.4. Oil and Gas
- 8.3.5. Paints and Coatings
- 8.3.6. Medical Technology
- 8.3.7. Composites
- 8.3.8. Other Applications
- 8.1. Market Analysis, Insights and Forecast - by Raw Material
- 9. Europe Microspheres Industry Analysis, Insights and Forecast, 2020-2032
- 9.1. Market Analysis, Insights and Forecast - by Raw Material
- 9.1.1. Glass
- 9.1.2. Polymer
- 9.1.3. Ceramic
- 9.1.4. Fly Ash
- 9.1.5. Metallic
- 9.1.6. Other Raw Materials
- 9.2. Market Analysis, Insights and Forecast - by Type
- 9.2.1. Hollow
- 9.2.2. Soild
- 9.3. Market Analysis, Insights and Forecast - by Application
- 9.3.1. Automotive
- 9.3.2. Aerospace
- 9.3.3. Cosmetics
- 9.3.4. Oil and Gas
- 9.3.5. Paints and Coatings
- 9.3.6. Medical Technology
- 9.3.7. Composites
- 9.3.8. Other Applications
- 9.1. Market Analysis, Insights and Forecast - by Raw Material
- 10. South America Microspheres Industry Analysis, Insights and Forecast, 2020-2032
- 10.1. Market Analysis, Insights and Forecast - by Raw Material
- 10.1.1. Glass
- 10.1.2. Polymer
- 10.1.3. Ceramic
- 10.1.4. Fly Ash
- 10.1.5. Metallic
- 10.1.6. Other Raw Materials
- 10.2. Market Analysis, Insights and Forecast - by Type
- 10.2.1. Hollow
- 10.2.2. Soild
- 10.3. Market Analysis, Insights and Forecast - by Application
- 10.3.1. Automotive
- 10.3.2. Aerospace
- 10.3.3. Cosmetics
- 10.3.4. Oil and Gas
- 10.3.5. Paints and Coatings
- 10.3.6. Medical Technology
- 10.3.7. Composites
- 10.3.8. Other Applications
- 10.1. Market Analysis, Insights and Forecast - by Raw Material
- 11. Middle East and Africa Microspheres Industry Analysis, Insights and Forecast, 2020-2032
- 11.1. Market Analysis, Insights and Forecast - by Raw Material
- 11.1.1. Glass
- 11.1.2. Polymer
- 11.1.3. Ceramic
- 11.1.4. Fly Ash
- 11.1.5. Metallic
- 11.1.6. Other Raw Materials
- 11.2. Market Analysis, Insights and Forecast - by Type
- 11.2.1. Hollow
- 11.2.2. Soild
- 11.3. Market Analysis, Insights and Forecast - by Application
- 11.3.1. Automotive
- 11.3.2. Aerospace
- 11.3.3. Cosmetics
- 11.3.4. Oil and Gas
- 11.3.5. Paints and Coatings
- 11.3.6. Medical Technology
- 11.3.7. Composites
- 11.3.8. Other Applications
- 11.1. Market Analysis, Insights and Forecast - by Raw Material
- 12. Competitive Analysis
- 12.1. Company Profiles
- 12.1.1 Merit Medical Systems
- 12.1.1.1. Company Overview
- 12.1.1.2. Products
- 12.1.1.3. Company Financials
- 12.1.1.4. SWOT Analysis
- 12.1.2 Nouryon
- 12.1.2.1. Company Overview
- 12.1.2.2. Products
- 12.1.2.3. Company Financials
- 12.1.2.4. SWOT Analysis
- 12.1.3 Matsumoto Yushi-seiyaku Co Ltd
- 12.1.3.1. Company Overview
- 12.1.3.2. Products
- 12.1.3.3. Company Financials
- 12.1.3.4. SWOT Analysis
- 12.1.4 Cospheric LLC
- 12.1.4.1. Company Overview
- 12.1.4.2. Products
- 12.1.4.3. Company Financials
- 12.1.4.4. SWOT Analysis
- 12.1.5 Luminex Corporation (Diasorin Spa)
- 12.1.5.1. Company Overview
- 12.1.5.2. Products
- 12.1.5.3. Company Financials
- 12.1.5.4. SWOT Analysis
- 12.1.6 Bangs Laboratories Inc
- 12.1.6.1. Company Overview
- 12.1.6.2. Products
- 12.1.6.3. Company Financials
- 12.1.6.4. SWOT Analysis
- 12.1.7 3M
- 12.1.7.1. Company Overview
- 12.1.7.2. Products
- 12.1.7.3. Company Financials
- 12.1.7.4. SWOT Analysis
- 12.1.8 Chase Corporation
- 12.1.8.1. Company Overview
- 12.1.8.2. Products
- 12.1.8.3. Company Financials
- 12.1.8.4. SWOT Analysis
- 12.1.9 Momentive
- 12.1.9.1. Company Overview
- 12.1.9.2. Products
- 12.1.9.3. Company Financials
- 12.1.9.4. SWOT Analysis
- 12.1.10 Potters Industries LLC
- 12.1.10.1. Company Overview
- 12.1.10.2. Products
- 12.1.10.3. Company Financials
- 12.1.10.4. SWOT Analysis
- 12.1.11 Siemens Healthineers AG
- 12.1.11.1. Company Overview
- 12.1.11.2. Products
- 12.1.11.3. Company Financials
- 12.1.11.4. SWOT Analysis
- 12.1.12 Mo-sci Corporation (Heraeus Holdings)
- 12.1.12.1. Company Overview
- 12.1.12.2. Products
- 12.1.12.3. Company Financials
- 12.1.12.4. SWOT Analysis
- 12.1.13 Kureha Corporation
- 12.1.13.1. Company Overview
- 12.1.13.2. Products
- 12.1.13.3. Company Financials
- 12.1.13.4. SWOT Analysis
- 12.1.14 Trelleborg AB*List Not Exhaustive
- 12.1.14.1. Company Overview
- 12.1.14.2. Products
- 12.1.14.3. Company Financials
- 12.1.14.4. SWOT Analysis
- 12.1.1 Merit Medical Systems
- 12.2. Market Entropy
- 12.2.1 Company's Key Areas Served
- 12.2.2 Recent Developments
- 12.3. Company Market Share Analysis 2025
- 12.3.1 Top 5 Companies Market Share Analysis
- 12.3.2 Top 3 Companies Market Share Analysis
- 12.4. List of Potential Customers
- 13. Research Methodology
List of Figures
- Figure 1: Global Microspheres Industry Revenue Breakdown (Million, %) by Region 2025 & 2033
- Figure 2: Asia Pacific Microspheres Industry Revenue (Million), by Raw Material 2025 & 2033
- Figure 3: Asia Pacific Microspheres Industry Revenue Share (%), by Raw Material 2025 & 2033
- Figure 4: Asia Pacific Microspheres Industry Revenue (Million), by Type 2025 & 2033
- Figure 5: Asia Pacific Microspheres Industry Revenue Share (%), by Type 2025 & 2033
- Figure 6: Asia Pacific Microspheres Industry Revenue (Million), by Application 2025 & 2033
- Figure 7: Asia Pacific Microspheres Industry Revenue Share (%), by Application 2025 & 2033
- Figure 8: Asia Pacific Microspheres Industry Revenue (Million), by Country 2025 & 2033
- Figure 9: Asia Pacific Microspheres Industry Revenue Share (%), by Country 2025 & 2033
- Figure 10: North America Microspheres Industry Revenue (Million), by Raw Material 2025 & 2033
- Figure 11: North America Microspheres Industry Revenue Share (%), by Raw Material 2025 & 2033
- Figure 12: North America Microspheres Industry Revenue (Million), by Type 2025 & 2033
- Figure 13: North America Microspheres Industry Revenue Share (%), by Type 2025 & 2033
- Figure 14: North America Microspheres Industry Revenue (Million), by Application 2025 & 2033
- Figure 15: North America Microspheres Industry Revenue Share (%), by Application 2025 & 2033
- Figure 16: North America Microspheres Industry Revenue (Million), by Country 2025 & 2033
- Figure 17: North America Microspheres Industry Revenue Share (%), by Country 2025 & 2033
- Figure 18: Europe Microspheres Industry Revenue (Million), by Raw Material 2025 & 2033
- Figure 19: Europe Microspheres Industry Revenue Share (%), by Raw Material 2025 & 2033
- Figure 20: Europe Microspheres Industry Revenue (Million), by Type 2025 & 2033
- Figure 21: Europe Microspheres Industry Revenue Share (%), by Type 2025 & 2033
- Figure 22: Europe Microspheres Industry Revenue (Million), by Application 2025 & 2033
- Figure 23: Europe Microspheres Industry Revenue Share (%), by Application 2025 & 2033
- Figure 24: Europe Microspheres Industry Revenue (Million), by Country 2025 & 2033
- Figure 25: Europe Microspheres Industry Revenue Share (%), by Country 2025 & 2033
- Figure 26: South America Microspheres Industry Revenue (Million), by Raw Material 2025 & 2033
- Figure 27: South America Microspheres Industry Revenue Share (%), by Raw Material 2025 & 2033
- Figure 28: South America Microspheres Industry Revenue (Million), by Type 2025 & 2033
- Figure 29: South America Microspheres Industry Revenue Share (%), by Type 2025 & 2033
- Figure 30: South America Microspheres Industry Revenue (Million), by Application 2025 & 2033
- Figure 31: South America Microspheres Industry Revenue Share (%), by Application 2025 & 2033
- Figure 32: South America Microspheres Industry Revenue (Million), by Country 2025 & 2033
- Figure 33: South America Microspheres Industry Revenue Share (%), by Country 2025 & 2033
- Figure 34: Middle East and Africa Microspheres Industry Revenue (Million), by Raw Material 2025 & 2033
- Figure 35: Middle East and Africa Microspheres Industry Revenue Share (%), by Raw Material 2025 & 2033
- Figure 36: Middle East and Africa Microspheres Industry Revenue (Million), by Type 2025 & 2033
- Figure 37: Middle East and Africa Microspheres Industry Revenue Share (%), by Type 2025 & 2033
- Figure 38: Middle East and Africa Microspheres Industry Revenue (Million), by Application 2025 & 2033
- Figure 39: Middle East and Africa Microspheres Industry Revenue Share (%), by Application 2025 & 2033
- Figure 40: Middle East and Africa Microspheres Industry Revenue (Million), by Country 2025 & 2033
- Figure 41: Middle East and Africa Microspheres Industry Revenue Share (%), by Country 2025 & 2033
List of Tables
- Table 1: Global Microspheres Industry Revenue Million Forecast, by Raw Material 2020 & 2033
- Table 2: Global Microspheres Industry Revenue Million Forecast, by Type 2020 & 2033
- Table 3: Global Microspheres Industry Revenue Million Forecast, by Application 2020 & 2033
- Table 4: Global Microspheres Industry Revenue Million Forecast, by Region 2020 & 2033
- Table 5: Global Microspheres Industry Revenue Million Forecast, by Raw Material 2020 & 2033
- Table 6: Global Microspheres Industry Revenue Million Forecast, by Type 2020 & 2033
- Table 7: Global Microspheres Industry Revenue Million Forecast, by Application 2020 & 2033
- Table 8: Global Microspheres Industry Revenue Million Forecast, by Country 2020 & 2033
- Table 9: China Microspheres Industry Revenue (Million) Forecast, by Application 2020 & 2033
- Table 10: India Microspheres Industry Revenue (Million) Forecast, by Application 2020 & 2033
- Table 11: Japan Microspheres Industry Revenue (Million) Forecast, by Application 2020 & 2033
- Table 12: South Korea Microspheres Industry Revenue (Million) Forecast, by Application 2020 & 2033
- Table 13: Rest of Asia Pacific Microspheres Industry Revenue (Million) Forecast, by Application 2020 & 2033
- Table 14: Global Microspheres Industry Revenue Million Forecast, by Raw Material 2020 & 2033
- Table 15: Global Microspheres Industry Revenue Million Forecast, by Type 2020 & 2033
- Table 16: Global Microspheres Industry Revenue Million Forecast, by Application 2020 & 2033
- Table 17: Global Microspheres Industry Revenue Million Forecast, by Country 2020 & 2033
- Table 18: United States Microspheres Industry Revenue (Million) Forecast, by Application 2020 & 2033
- Table 19: Canada Microspheres Industry Revenue (Million) Forecast, by Application 2020 & 2033
- Table 20: Mexico Microspheres Industry Revenue (Million) Forecast, by Application 2020 & 2033
- Table 21: Global Microspheres Industry Revenue Million Forecast, by Raw Material 2020 & 2033
- Table 22: Global Microspheres Industry Revenue Million Forecast, by Type 2020 & 2033
- Table 23: Global Microspheres Industry Revenue Million Forecast, by Application 2020 & 2033
- Table 24: Global Microspheres Industry Revenue Million Forecast, by Country 2020 & 2033
- Table 25: Germany Microspheres Industry Revenue (Million) Forecast, by Application 2020 & 2033
- Table 26: United Kingdom Microspheres Industry Revenue (Million) Forecast, by Application 2020 & 2033
- Table 27: Italy Microspheres Industry Revenue (Million) Forecast, by Application 2020 & 2033
- Table 28: France Microspheres Industry Revenue (Million) Forecast, by Application 2020 & 2033
- Table 29: Rest of Europe Microspheres Industry Revenue (Million) Forecast, by Application 2020 & 2033
- Table 30: Global Microspheres Industry Revenue Million Forecast, by Raw Material 2020 & 2033
- Table 31: Global Microspheres Industry Revenue Million Forecast, by Type 2020 & 2033
- Table 32: Global Microspheres Industry Revenue Million Forecast, by Application 2020 & 2033
- Table 33: Global Microspheres Industry Revenue Million Forecast, by Country 2020 & 2033
- Table 34: Brazil Microspheres Industry Revenue (Million) Forecast, by Application 2020 & 2033
- Table 35: Argentina Microspheres Industry Revenue (Million) Forecast, by Application 2020 & 2033
- Table 36: Rest of South America Microspheres Industry Revenue (Million) Forecast, by Application 2020 & 2033
- Table 37: Global Microspheres Industry Revenue Million Forecast, by Raw Material 2020 & 2033
- Table 38: Global Microspheres Industry Revenue Million Forecast, by Type 2020 & 2033
- Table 39: Global Microspheres Industry Revenue Million Forecast, by Application 2020 & 2033
- Table 40: Global Microspheres Industry Revenue Million Forecast, by Country 2020 & 2033
- Table 41: Saudi Arabia Microspheres Industry Revenue (Million) Forecast, by Application 2020 & 2033
- Table 42: South Africa Microspheres Industry Revenue (Million) Forecast, by Application 2020 & 2033
- Table 43: Rest of Middle East and Africa Microspheres Industry Revenue (Million) Forecast, by Application 2020 & 2033
Frequently Asked Questions
1. What is the projected Compound Annual Growth Rate (CAGR) of the Microspheres Industry?
The projected CAGR is approximately 9.10%.
2. Which companies are prominent players in the Microspheres Industry?
Key companies in the market include Merit Medical Systems, Nouryon, Matsumoto Yushi-seiyaku Co Ltd, Cospheric LLC, Luminex Corporation (Diasorin Spa), Bangs Laboratories Inc, 3M, Chase Corporation, Momentive, Potters Industries LLC, Siemens Healthineers AG, Mo-sci Corporation (Heraeus Holdings), Kureha Corporation, Trelleborg AB*List Not Exhaustive.
3. What are the main segments of the Microspheres Industry?
The market segments include Raw Material, Type, Application.
4. Can you provide details about the market size?
The market size is estimated to be USD 7.95 Million as of 2022.
5. What are some drivers contributing to market growth?
Increasing Application and Advancements in Medical Industry; Increasing Demand from Cosmetics Industry.
6. What are the notable trends driving market growth?
Increasing Usage in the Medical Technology.
7. Are there any restraints impacting market growth?
High Production and Research and Development Cost.
8. Can you provide examples of recent developments in the market?
In June 2022, Nouryon introduced expancel HP92 microspheres to reduce weight and withstand high pressure in underbody coatings and sealants for the automotive industry. These microspheres are currently produced in Stockvik, Sweden, with production expected in Green Bay, Wisconsin, the United States, in early 2023.
9. What pricing options are available for accessing the report?
Pricing options include single-user, multi-user, and enterprise licenses priced at USD 4750, USD 5250, and USD 8750 respectively.
10. Is the market size provided in terms of value or volume?
The market size is provided in terms of value, measured in Million.
11. Are there any specific market keywords associated with the report?
Yes, the market keyword associated with the report is "Microspheres Industry," which aids in identifying and referencing the specific market segment covered.
12. How do I determine which pricing option suits my needs best?
The pricing options vary based on user requirements and access needs. Individual users may opt for single-user licenses, while businesses requiring broader access may choose multi-user or enterprise licenses for cost-effective access to the report.
13. Are there any additional resources or data provided in the Microspheres Industry report?
While the report offers comprehensive insights, it's advisable to review the specific contents or supplementary materials provided to ascertain if additional resources or data are available.
14. How can I stay updated on further developments or reports in the Microspheres Industry?
To stay informed about further developments, trends, and reports in the Microspheres Industry, consider subscribing to industry newsletters, following relevant companies and organizations, or regularly checking reputable industry news sources and publications.
Methodology
Step 1 - Identification of Relevant Samples Size from Population Database


Step 2 - Approaches for Defining Global Market Size (Value, Volume* & Price*)

Note*: In applicable scenarios
Step 3 - Data Sources
Primary Research
- Web Analytics
- Survey Reports
- Research Institute
- Latest Research Reports
- Opinion Leaders
Secondary Research
- Annual Reports
- White Paper
- Latest Press Release
- Industry Association
- Paid Database
- Investor Presentations

Step 4 - Data Triangulation
Involves using different sources of information in order to increase the validity of a study
These sources are likely to be stakeholders in a program - participants, other researchers, program staff, other community members, and so on.
Then we put all data in single framework & apply various statistical tools to find out the dynamic on the market.
During the analysis stage, feedback from the stakeholder groups would be compared to determine areas of agreement as well as areas of divergence