

Key Insights
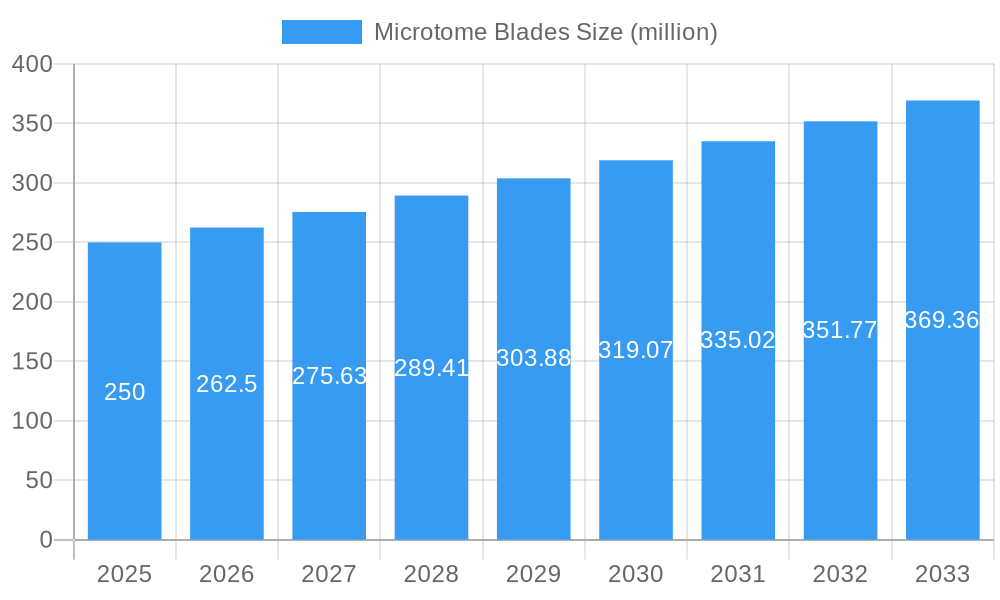
The global microtome blade market is poised for robust expansion, driven by escalating demand for precision tissue sectioning in histopathology, diagnostics, and life sciences research. The market size is projected to reach 339.52 million by 2025, with a projected Compound Annual Growth Rate (CAGR) of 6.16%. This growth trajectory is underpinned by several key factors: the rising incidence of chronic diseases requiring enhanced diagnostic capabilities, continuous technological advancements in microtome blade design for superior sectioning quality and efficiency, and expanding research initiatives in critical areas like oncology and neuroscience.
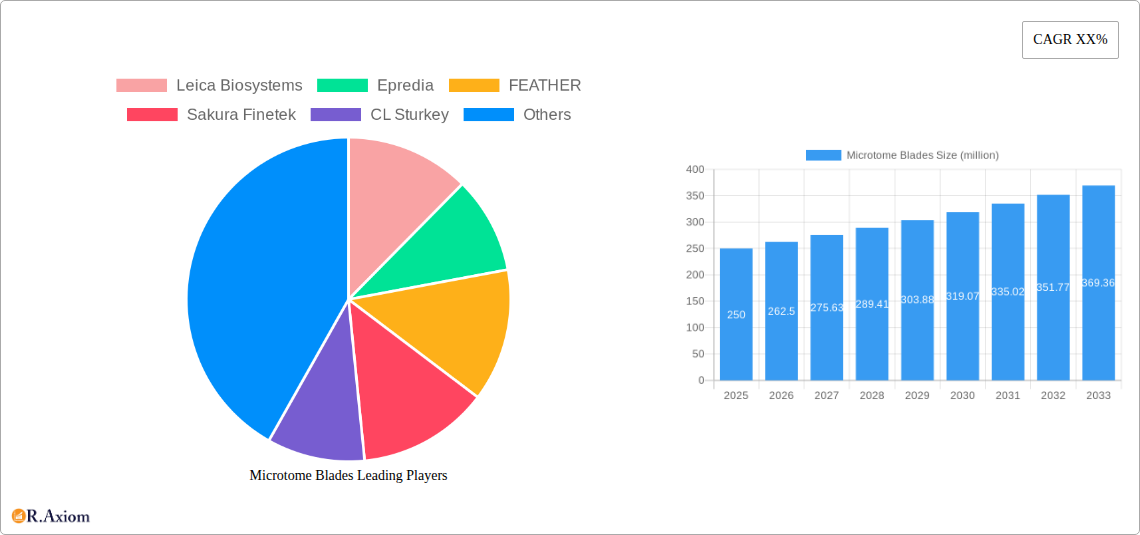
Microtome Blades Market Size (In Million)
Key market participants, including Leica Biosystems, Epredia, and Sakura Finetek, maintain significant market influence through their established brand equity and extensive product offerings. While premium blade costs and potential technological substitutions present some market challenges, the outlook remains optimistic. For the forecast period beginning in 2025, continued growth is anticipated, propelled by innovations such as disposable blades mitigating cross-contamination risks, the increasing integration of automated microtome systems, and the surge in personalized medicine demanding highly granular tissue analysis.
Microtome Blades Company Market Share
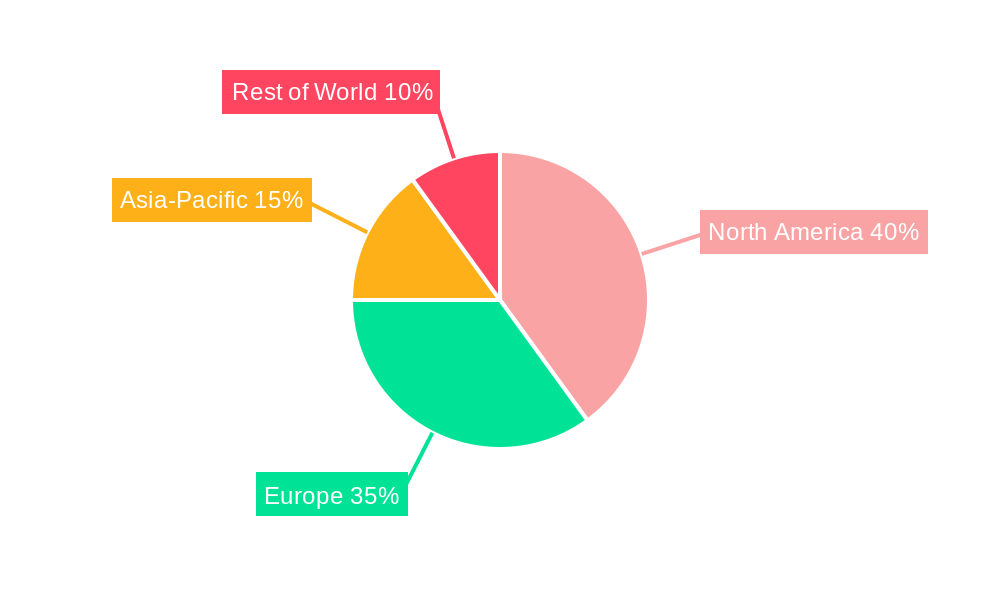
Geographically, North America and Europe are expected to retain substantial market shares, supported by advanced healthcare infrastructures and a dense network of research facilities. Concurrently, emerging economies in the Asia-Pacific region are positioned for accelerated growth, fueled by rising healthcare investments and expanding diagnostic infrastructure. Market segmentation is anticipated to diversify, with an increasing focus on specialized blades tailored for specific applications and materials, fostering opportunities for niche market entrants.
Microtome Blades Market Report: A Comprehensive Analysis (2019-2033)
This comprehensive report provides a detailed analysis of the global microtome blades market, offering invaluable insights for industry stakeholders, investors, and researchers. The study period covers 2019-2033, with 2025 serving as the base and estimated year. The report delves into market dynamics, competitive landscapes, technological advancements, and future growth projections, providing actionable intelligence to navigate the evolving market. The total market value is estimated to reach xx million by 2033.
Microtome Blades Market Concentration & Innovation
The global microtome blades market exhibits a moderately concentrated landscape, with key players like Leica Biosystems, Epredia, FEATHER, and Sakura Finetek holding significant market share. Leica Biosystems, for instance, commands an estimated xx% market share in 2025, while Epredia holds approximately xx%. The market is characterized by ongoing innovation, driven by the need for improved blade sharpness, durability, and reduced sectioning artifacts. Regulatory frameworks, such as those related to medical device approvals, significantly influence market dynamics. Product substitutes, such as laser microdissection, are emerging but currently hold a relatively small market share (estimated at xx million in 2025). End-user trends towards automation and high-throughput processing are also shaping the market. M&A activities, while not as frequent as in other sectors, have played a role in shaping the competitive landscape. For example, the xx million acquisition of Company X by Company Y in 2022 contributed to market consolidation.
- Market Concentration: Moderate, with a few dominant players.
- Innovation Drivers: Improved blade performance, automation, regulatory compliance.
- Regulatory Frameworks: Stringent medical device regulations impact market entry and product development.
- Product Substitutes: Laser microdissection and other advanced technologies present limited competition.
- M&A Activity: Occasional mergers and acquisitions contribute to market consolidation. Total M&A deal value in the period 2019-2024 is estimated at xx million.
Microtome Blades Industry Trends & Insights
The global microtome blades market is experiencing steady growth, driven by increasing demand for diagnostic and research applications. The market is projected to register a CAGR of xx% during the forecast period (2025-2033). Key growth drivers include the rising prevalence of chronic diseases necessitating increased diagnostic testing, advancements in microscopy techniques, and the growing adoption of automated histopathology systems. Technological disruptions, particularly in the development of diamond-coated blades and other advanced materials, are enhancing blade performance and durability. Consumer preferences are shifting towards high-precision blades that offer superior sectioning quality and reduced tissue damage. Competitive dynamics are characterized by intense competition among established players, focusing on product differentiation, technological innovation, and pricing strategies. Market penetration of automated microtomes is steadily increasing, contributing to greater demand for high-quality blades.
Dominant Markets & Segments in Microtome Blades
The North American region holds a dominant position in the global microtome blades market, accounting for an estimated xx% of the global market in 2025. This dominance is largely attributable to robust healthcare infrastructure, high investment in research and development, and the presence of major players in the region. The high prevalence of chronic diseases further fuels demand.
- Key Drivers in North America:
- Robust healthcare infrastructure.
- High R&D investment in medical research.
- Presence of major microtome blade manufacturers.
- High prevalence of chronic diseases.
Europe holds the second-largest market share (xx% in 2025), with growth driven by similar factors to North America, particularly the increasing demand for advanced diagnostics. Within the segments, the hospital and research labs segment dominates the market, accounting for the largest share of revenue, driven by high-volume usage and the need for high-precision blades.
Microtome Blades Product Developments
Recent years have witnessed significant advancements in microtome blade technology, leading to the development of sharper, more durable blades with enhanced sectioning capabilities. Innovations include diamond-coated blades offering improved longevity and reduced sectioning artifacts, and the introduction of disposable blades to enhance safety and hygiene. These advancements improve efficiency and reduce the overall cost-per-section in high-throughput settings. Market fit is enhanced by focusing on ease of use and reduced handling time, thus promoting adoption in clinical and research labs.
Report Scope & Segmentation Analysis
This report segments the microtome blades market by type (disposable, reusable), application (clinical diagnostics, research, industrial), end-user (hospitals & clinics, research labs, pharmaceutical companies), and geography (North America, Europe, Asia-Pacific, Rest of World). Each segment provides distinct growth opportunities and challenges. Disposable blades are projected to exhibit faster growth due to improved hygiene and reduced cross-contamination risks. The clinical diagnostics segment dominates, driven by high-volume usage. The growth projections for each segment vary; for example, the disposable blade segment is expected to grow at xx% CAGR, while the research segment shows a xx% CAGR over the forecast period. Competitive dynamics differ significantly across segments, with varying levels of concentration and competition intensity.
Key Drivers of Microtome Blades Growth
The growth of the microtome blades market is propelled by several factors. Technological advancements, such as the development of diamond-coated blades and improved blade geometries, enhance sectioning quality and efficiency. The rising prevalence of chronic diseases drives the need for more diagnostic testing, fueling demand for microtome blades. Favorable economic conditions in key markets support investment in healthcare infrastructure, while supportive government regulations and initiatives promoting medical research also play a significant role.
Challenges in the Microtome Blades Sector
The microtome blades market faces several challenges. Stringent regulatory requirements for medical devices can increase the time and cost associated with product development and market entry. Fluctuations in raw material prices and potential supply chain disruptions can negatively impact manufacturing costs and profitability. Intense competition among established players necessitates continuous innovation and investment in R&D to maintain a competitive edge. These challenges impact margins and necessitate adaptive strategies by market participants.
Emerging Opportunities in Microtome Blades
Emerging opportunities exist in the microtome blades sector. The growing adoption of automated histopathology systems creates demand for high-volume, high-performance blades. Developing new blade materials and coatings, like those utilizing nanotechnology, can further improve performance and durability. Expanding into emerging markets with unmet healthcare needs also presents significant potential. These opportunities require strategic investment and technological advancements to capture emerging market share.
Leading Players in the Microtome Blades Market
- Leica Biosystems
- Epredia
- FEATHER
- Sakura Finetek
- CL Sturkey
- AccuTec Blades
- Diapath
- Trajan
- Crescent Blades
- General Data
- StatLab
- Avantik
Key Developments in Microtome Blades Industry
- 2022 (Q3): Leica Biosystems launched a new line of diamond-coated microtome blades.
- 2021 (Q4): Epredia acquired a smaller blade manufacturer, expanding its market share.
- 2020 (Q1): Sakura Finetek introduced a new automated microtome system compatible with its blade range.
- 2019 (Q2): FEATHER announced improvements to its blade coating technology. (Further detailed developments with specific dates and impact can be added here if data is available)
Strategic Outlook for Microtome Blades Market
The microtome blades market is poised for continued growth, driven by technological advancements, increasing demand for diagnostics, and expansion into emerging markets. The focus on automation, precision, and enhanced blade performance will continue to shape the market landscape. Companies investing in R&D, building strong distribution networks, and adopting effective marketing strategies are well-positioned to capture significant market share and achieve sustainable growth in this dynamic sector.
Microtome Blades Segmentation
-
1. Application
- 1.1. Research
- 1.2. Clinical
- 1.3. Others
-
2. Types
- 2.1. Low Profile Blades
- 2.2. High Profile Blades
- 2.3. Others
Microtome Blades Segmentation By Geography
-
1. North America
- 1.1. United States
- 1.2. Canada
- 1.3. Mexico
-
2. South America
- 2.1. Brazil
- 2.2. Argentina
- 2.3. Rest of South America
-
3. Europe
- 3.1. United Kingdom
- 3.2. Germany
- 3.3. France
- 3.4. Italy
- 3.5. Spain
- 3.6. Russia
- 3.7. Benelux
- 3.8. Nordics
- 3.9. Rest of Europe
-
4. Middle East & Africa
- 4.1. Turkey
- 4.2. Israel
- 4.3. GCC
- 4.4. North Africa
- 4.5. South Africa
- 4.6. Rest of Middle East & Africa
-
5. Asia Pacific
- 5.1. China
- 5.2. India
- 5.3. Japan
- 5.4. South Korea
- 5.5. ASEAN
- 5.6. Oceania
- 5.7. Rest of Asia Pacific
Microtome Blades Regional Market Share
Geographic Coverage of Microtome Blades
Microtome Blades REPORT HIGHLIGHTS
| Aspects | Details |
|---|---|
| Study Period | 2020-2034 |
| Base Year | 2025 |
| Estimated Year | 2026 |
| Forecast Period | 2026-2034 |
| Historical Period | 2020-2025 |
| Growth Rate | CAGR of 6.16% from 2020-2034 |
| Segmentation |
|
Table of Contents
- 1. Introduction
- 1.1. Research Scope
- 1.2. Market Segmentation
- 1.3. Research Methodology
- 1.4. Definitions and Assumptions
- 2. Executive Summary
- 2.1. Introduction
- 3. Market Dynamics
- 3.1. Introduction
- 3.2. Market Drivers
- 3.3. Market Restrains
- 3.4. Market Trends
- 4. Market Factor Analysis
- 4.1. Porters Five Forces
- 4.2. Supply/Value Chain
- 4.3. PESTEL analysis
- 4.4. Market Entropy
- 4.5. Patent/Trademark Analysis
- 5. Global Microtome Blades Analysis, Insights and Forecast, 2020-2032
- 5.1. Market Analysis, Insights and Forecast - by Application
- 5.1.1. Research
- 5.1.2. Clinical
- 5.1.3. Others
- 5.2. Market Analysis, Insights and Forecast - by Types
- 5.2.1. Low Profile Blades
- 5.2.2. High Profile Blades
- 5.2.3. Others
- 5.3. Market Analysis, Insights and Forecast - by Region
- 5.3.1. North America
- 5.3.2. South America
- 5.3.3. Europe
- 5.3.4. Middle East & Africa
- 5.3.5. Asia Pacific
- 5.1. Market Analysis, Insights and Forecast - by Application
- 6. North America Microtome Blades Analysis, Insights and Forecast, 2020-2032
- 6.1. Market Analysis, Insights and Forecast - by Application
- 6.1.1. Research
- 6.1.2. Clinical
- 6.1.3. Others
- 6.2. Market Analysis, Insights and Forecast - by Types
- 6.2.1. Low Profile Blades
- 6.2.2. High Profile Blades
- 6.2.3. Others
- 6.1. Market Analysis, Insights and Forecast - by Application
- 7. South America Microtome Blades Analysis, Insights and Forecast, 2020-2032
- 7.1. Market Analysis, Insights and Forecast - by Application
- 7.1.1. Research
- 7.1.2. Clinical
- 7.1.3. Others
- 7.2. Market Analysis, Insights and Forecast - by Types
- 7.2.1. Low Profile Blades
- 7.2.2. High Profile Blades
- 7.2.3. Others
- 7.1. Market Analysis, Insights and Forecast - by Application
- 8. Europe Microtome Blades Analysis, Insights and Forecast, 2020-2032
- 8.1. Market Analysis, Insights and Forecast - by Application
- 8.1.1. Research
- 8.1.2. Clinical
- 8.1.3. Others
- 8.2. Market Analysis, Insights and Forecast - by Types
- 8.2.1. Low Profile Blades
- 8.2.2. High Profile Blades
- 8.2.3. Others
- 8.1. Market Analysis, Insights and Forecast - by Application
- 9. Middle East & Africa Microtome Blades Analysis, Insights and Forecast, 2020-2032
- 9.1. Market Analysis, Insights and Forecast - by Application
- 9.1.1. Research
- 9.1.2. Clinical
- 9.1.3. Others
- 9.2. Market Analysis, Insights and Forecast - by Types
- 9.2.1. Low Profile Blades
- 9.2.2. High Profile Blades
- 9.2.3. Others
- 9.1. Market Analysis, Insights and Forecast - by Application
- 10. Asia Pacific Microtome Blades Analysis, Insights and Forecast, 2020-2032
- 10.1. Market Analysis, Insights and Forecast - by Application
- 10.1.1. Research
- 10.1.2. Clinical
- 10.1.3. Others
- 10.2. Market Analysis, Insights and Forecast - by Types
- 10.2.1. Low Profile Blades
- 10.2.2. High Profile Blades
- 10.2.3. Others
- 10.1. Market Analysis, Insights and Forecast - by Application
- 11. Competitive Analysis
- 11.1. Global Market Share Analysis 2025
- 11.2. Company Profiles
- 11.2.1 Leica Biosystems
- 11.2.1.1. Overview
- 11.2.1.2. Products
- 11.2.1.3. SWOT Analysis
- 11.2.1.4. Recent Developments
- 11.2.1.5. Financials (Based on Availability)
- 11.2.2 Epredia
- 11.2.2.1. Overview
- 11.2.2.2. Products
- 11.2.2.3. SWOT Analysis
- 11.2.2.4. Recent Developments
- 11.2.2.5. Financials (Based on Availability)
- 11.2.3 FEATHER
- 11.2.3.1. Overview
- 11.2.3.2. Products
- 11.2.3.3. SWOT Analysis
- 11.2.3.4. Recent Developments
- 11.2.3.5. Financials (Based on Availability)
- 11.2.4 Sakura Finetek
- 11.2.4.1. Overview
- 11.2.4.2. Products
- 11.2.4.3. SWOT Analysis
- 11.2.4.4. Recent Developments
- 11.2.4.5. Financials (Based on Availability)
- 11.2.5 CL Sturkey
- 11.2.5.1. Overview
- 11.2.5.2. Products
- 11.2.5.3. SWOT Analysis
- 11.2.5.4. Recent Developments
- 11.2.5.5. Financials (Based on Availability)
- 11.2.6 AccuTec Blades
- 11.2.6.1. Overview
- 11.2.6.2. Products
- 11.2.6.3. SWOT Analysis
- 11.2.6.4. Recent Developments
- 11.2.6.5. Financials (Based on Availability)
- 11.2.7 Diapath
- 11.2.7.1. Overview
- 11.2.7.2. Products
- 11.2.7.3. SWOT Analysis
- 11.2.7.4. Recent Developments
- 11.2.7.5. Financials (Based on Availability)
- 11.2.8 Trajan
- 11.2.8.1. Overview
- 11.2.8.2. Products
- 11.2.8.3. SWOT Analysis
- 11.2.8.4. Recent Developments
- 11.2.8.5. Financials (Based on Availability)
- 11.2.9 Crescent Blades
- 11.2.9.1. Overview
- 11.2.9.2. Products
- 11.2.9.3. SWOT Analysis
- 11.2.9.4. Recent Developments
- 11.2.9.5. Financials (Based on Availability)
- 11.2.10 General Data
- 11.2.10.1. Overview
- 11.2.10.2. Products
- 11.2.10.3. SWOT Analysis
- 11.2.10.4. Recent Developments
- 11.2.10.5. Financials (Based on Availability)
- 11.2.11 StatLab
- 11.2.11.1. Overview
- 11.2.11.2. Products
- 11.2.11.3. SWOT Analysis
- 11.2.11.4. Recent Developments
- 11.2.11.5. Financials (Based on Availability)
- 11.2.12 Avantik
- 11.2.12.1. Overview
- 11.2.12.2. Products
- 11.2.12.3. SWOT Analysis
- 11.2.12.4. Recent Developments
- 11.2.12.5. Financials (Based on Availability)
- 11.2.1 Leica Biosystems
List of Figures
- Figure 1: Global Microtome Blades Revenue Breakdown (million, %) by Region 2025 & 2033
- Figure 2: Global Microtome Blades Volume Breakdown (K, %) by Region 2025 & 2033
- Figure 3: North America Microtome Blades Revenue (million), by Application 2025 & 2033
- Figure 4: North America Microtome Blades Volume (K), by Application 2025 & 2033
- Figure 5: North America Microtome Blades Revenue Share (%), by Application 2025 & 2033
- Figure 6: North America Microtome Blades Volume Share (%), by Application 2025 & 2033
- Figure 7: North America Microtome Blades Revenue (million), by Types 2025 & 2033
- Figure 8: North America Microtome Blades Volume (K), by Types 2025 & 2033
- Figure 9: North America Microtome Blades Revenue Share (%), by Types 2025 & 2033
- Figure 10: North America Microtome Blades Volume Share (%), by Types 2025 & 2033
- Figure 11: North America Microtome Blades Revenue (million), by Country 2025 & 2033
- Figure 12: North America Microtome Blades Volume (K), by Country 2025 & 2033
- Figure 13: North America Microtome Blades Revenue Share (%), by Country 2025 & 2033
- Figure 14: North America Microtome Blades Volume Share (%), by Country 2025 & 2033
- Figure 15: South America Microtome Blades Revenue (million), by Application 2025 & 2033
- Figure 16: South America Microtome Blades Volume (K), by Application 2025 & 2033
- Figure 17: South America Microtome Blades Revenue Share (%), by Application 2025 & 2033
- Figure 18: South America Microtome Blades Volume Share (%), by Application 2025 & 2033
- Figure 19: South America Microtome Blades Revenue (million), by Types 2025 & 2033
- Figure 20: South America Microtome Blades Volume (K), by Types 2025 & 2033
- Figure 21: South America Microtome Blades Revenue Share (%), by Types 2025 & 2033
- Figure 22: South America Microtome Blades Volume Share (%), by Types 2025 & 2033
- Figure 23: South America Microtome Blades Revenue (million), by Country 2025 & 2033
- Figure 24: South America Microtome Blades Volume (K), by Country 2025 & 2033
- Figure 25: South America Microtome Blades Revenue Share (%), by Country 2025 & 2033
- Figure 26: South America Microtome Blades Volume Share (%), by Country 2025 & 2033
- Figure 27: Europe Microtome Blades Revenue (million), by Application 2025 & 2033
- Figure 28: Europe Microtome Blades Volume (K), by Application 2025 & 2033
- Figure 29: Europe Microtome Blades Revenue Share (%), by Application 2025 & 2033
- Figure 30: Europe Microtome Blades Volume Share (%), by Application 2025 & 2033
- Figure 31: Europe Microtome Blades Revenue (million), by Types 2025 & 2033
- Figure 32: Europe Microtome Blades Volume (K), by Types 2025 & 2033
- Figure 33: Europe Microtome Blades Revenue Share (%), by Types 2025 & 2033
- Figure 34: Europe Microtome Blades Volume Share (%), by Types 2025 & 2033
- Figure 35: Europe Microtome Blades Revenue (million), by Country 2025 & 2033
- Figure 36: Europe Microtome Blades Volume (K), by Country 2025 & 2033
- Figure 37: Europe Microtome Blades Revenue Share (%), by Country 2025 & 2033
- Figure 38: Europe Microtome Blades Volume Share (%), by Country 2025 & 2033
- Figure 39: Middle East & Africa Microtome Blades Revenue (million), by Application 2025 & 2033
- Figure 40: Middle East & Africa Microtome Blades Volume (K), by Application 2025 & 2033
- Figure 41: Middle East & Africa Microtome Blades Revenue Share (%), by Application 2025 & 2033
- Figure 42: Middle East & Africa Microtome Blades Volume Share (%), by Application 2025 & 2033
- Figure 43: Middle East & Africa Microtome Blades Revenue (million), by Types 2025 & 2033
- Figure 44: Middle East & Africa Microtome Blades Volume (K), by Types 2025 & 2033
- Figure 45: Middle East & Africa Microtome Blades Revenue Share (%), by Types 2025 & 2033
- Figure 46: Middle East & Africa Microtome Blades Volume Share (%), by Types 2025 & 2033
- Figure 47: Middle East & Africa Microtome Blades Revenue (million), by Country 2025 & 2033
- Figure 48: Middle East & Africa Microtome Blades Volume (K), by Country 2025 & 2033
- Figure 49: Middle East & Africa Microtome Blades Revenue Share (%), by Country 2025 & 2033
- Figure 50: Middle East & Africa Microtome Blades Volume Share (%), by Country 2025 & 2033
- Figure 51: Asia Pacific Microtome Blades Revenue (million), by Application 2025 & 2033
- Figure 52: Asia Pacific Microtome Blades Volume (K), by Application 2025 & 2033
- Figure 53: Asia Pacific Microtome Blades Revenue Share (%), by Application 2025 & 2033
- Figure 54: Asia Pacific Microtome Blades Volume Share (%), by Application 2025 & 2033
- Figure 55: Asia Pacific Microtome Blades Revenue (million), by Types 2025 & 2033
- Figure 56: Asia Pacific Microtome Blades Volume (K), by Types 2025 & 2033
- Figure 57: Asia Pacific Microtome Blades Revenue Share (%), by Types 2025 & 2033
- Figure 58: Asia Pacific Microtome Blades Volume Share (%), by Types 2025 & 2033
- Figure 59: Asia Pacific Microtome Blades Revenue (million), by Country 2025 & 2033
- Figure 60: Asia Pacific Microtome Blades Volume (K), by Country 2025 & 2033
- Figure 61: Asia Pacific Microtome Blades Revenue Share (%), by Country 2025 & 2033
- Figure 62: Asia Pacific Microtome Blades Volume Share (%), by Country 2025 & 2033
List of Tables
- Table 1: Global Microtome Blades Revenue million Forecast, by Application 2020 & 2033
- Table 2: Global Microtome Blades Volume K Forecast, by Application 2020 & 2033
- Table 3: Global Microtome Blades Revenue million Forecast, by Types 2020 & 2033
- Table 4: Global Microtome Blades Volume K Forecast, by Types 2020 & 2033
- Table 5: Global Microtome Blades Revenue million Forecast, by Region 2020 & 2033
- Table 6: Global Microtome Blades Volume K Forecast, by Region 2020 & 2033
- Table 7: Global Microtome Blades Revenue million Forecast, by Application 2020 & 2033
- Table 8: Global Microtome Blades Volume K Forecast, by Application 2020 & 2033
- Table 9: Global Microtome Blades Revenue million Forecast, by Types 2020 & 2033
- Table 10: Global Microtome Blades Volume K Forecast, by Types 2020 & 2033
- Table 11: Global Microtome Blades Revenue million Forecast, by Country 2020 & 2033
- Table 12: Global Microtome Blades Volume K Forecast, by Country 2020 & 2033
- Table 13: United States Microtome Blades Revenue (million) Forecast, by Application 2020 & 2033
- Table 14: United States Microtome Blades Volume (K) Forecast, by Application 2020 & 2033
- Table 15: Canada Microtome Blades Revenue (million) Forecast, by Application 2020 & 2033
- Table 16: Canada Microtome Blades Volume (K) Forecast, by Application 2020 & 2033
- Table 17: Mexico Microtome Blades Revenue (million) Forecast, by Application 2020 & 2033
- Table 18: Mexico Microtome Blades Volume (K) Forecast, by Application 2020 & 2033
- Table 19: Global Microtome Blades Revenue million Forecast, by Application 2020 & 2033
- Table 20: Global Microtome Blades Volume K Forecast, by Application 2020 & 2033
- Table 21: Global Microtome Blades Revenue million Forecast, by Types 2020 & 2033
- Table 22: Global Microtome Blades Volume K Forecast, by Types 2020 & 2033
- Table 23: Global Microtome Blades Revenue million Forecast, by Country 2020 & 2033
- Table 24: Global Microtome Blades Volume K Forecast, by Country 2020 & 2033
- Table 25: Brazil Microtome Blades Revenue (million) Forecast, by Application 2020 & 2033
- Table 26: Brazil Microtome Blades Volume (K) Forecast, by Application 2020 & 2033
- Table 27: Argentina Microtome Blades Revenue (million) Forecast, by Application 2020 & 2033
- Table 28: Argentina Microtome Blades Volume (K) Forecast, by Application 2020 & 2033
- Table 29: Rest of South America Microtome Blades Revenue (million) Forecast, by Application 2020 & 2033
- Table 30: Rest of South America Microtome Blades Volume (K) Forecast, by Application 2020 & 2033
- Table 31: Global Microtome Blades Revenue million Forecast, by Application 2020 & 2033
- Table 32: Global Microtome Blades Volume K Forecast, by Application 2020 & 2033
- Table 33: Global Microtome Blades Revenue million Forecast, by Types 2020 & 2033
- Table 34: Global Microtome Blades Volume K Forecast, by Types 2020 & 2033
- Table 35: Global Microtome Blades Revenue million Forecast, by Country 2020 & 2033
- Table 36: Global Microtome Blades Volume K Forecast, by Country 2020 & 2033
- Table 37: United Kingdom Microtome Blades Revenue (million) Forecast, by Application 2020 & 2033
- Table 38: United Kingdom Microtome Blades Volume (K) Forecast, by Application 2020 & 2033
- Table 39: Germany Microtome Blades Revenue (million) Forecast, by Application 2020 & 2033
- Table 40: Germany Microtome Blades Volume (K) Forecast, by Application 2020 & 2033
- Table 41: France Microtome Blades Revenue (million) Forecast, by Application 2020 & 2033
- Table 42: France Microtome Blades Volume (K) Forecast, by Application 2020 & 2033
- Table 43: Italy Microtome Blades Revenue (million) Forecast, by Application 2020 & 2033
- Table 44: Italy Microtome Blades Volume (K) Forecast, by Application 2020 & 2033
- Table 45: Spain Microtome Blades Revenue (million) Forecast, by Application 2020 & 2033
- Table 46: Spain Microtome Blades Volume (K) Forecast, by Application 2020 & 2033
- Table 47: Russia Microtome Blades Revenue (million) Forecast, by Application 2020 & 2033
- Table 48: Russia Microtome Blades Volume (K) Forecast, by Application 2020 & 2033
- Table 49: Benelux Microtome Blades Revenue (million) Forecast, by Application 2020 & 2033
- Table 50: Benelux Microtome Blades Volume (K) Forecast, by Application 2020 & 2033
- Table 51: Nordics Microtome Blades Revenue (million) Forecast, by Application 2020 & 2033
- Table 52: Nordics Microtome Blades Volume (K) Forecast, by Application 2020 & 2033
- Table 53: Rest of Europe Microtome Blades Revenue (million) Forecast, by Application 2020 & 2033
- Table 54: Rest of Europe Microtome Blades Volume (K) Forecast, by Application 2020 & 2033
- Table 55: Global Microtome Blades Revenue million Forecast, by Application 2020 & 2033
- Table 56: Global Microtome Blades Volume K Forecast, by Application 2020 & 2033
- Table 57: Global Microtome Blades Revenue million Forecast, by Types 2020 & 2033
- Table 58: Global Microtome Blades Volume K Forecast, by Types 2020 & 2033
- Table 59: Global Microtome Blades Revenue million Forecast, by Country 2020 & 2033
- Table 60: Global Microtome Blades Volume K Forecast, by Country 2020 & 2033
- Table 61: Turkey Microtome Blades Revenue (million) Forecast, by Application 2020 & 2033
- Table 62: Turkey Microtome Blades Volume (K) Forecast, by Application 2020 & 2033
- Table 63: Israel Microtome Blades Revenue (million) Forecast, by Application 2020 & 2033
- Table 64: Israel Microtome Blades Volume (K) Forecast, by Application 2020 & 2033
- Table 65: GCC Microtome Blades Revenue (million) Forecast, by Application 2020 & 2033
- Table 66: GCC Microtome Blades Volume (K) Forecast, by Application 2020 & 2033
- Table 67: North Africa Microtome Blades Revenue (million) Forecast, by Application 2020 & 2033
- Table 68: North Africa Microtome Blades Volume (K) Forecast, by Application 2020 & 2033
- Table 69: South Africa Microtome Blades Revenue (million) Forecast, by Application 2020 & 2033
- Table 70: South Africa Microtome Blades Volume (K) Forecast, by Application 2020 & 2033
- Table 71: Rest of Middle East & Africa Microtome Blades Revenue (million) Forecast, by Application 2020 & 2033
- Table 72: Rest of Middle East & Africa Microtome Blades Volume (K) Forecast, by Application 2020 & 2033
- Table 73: Global Microtome Blades Revenue million Forecast, by Application 2020 & 2033
- Table 74: Global Microtome Blades Volume K Forecast, by Application 2020 & 2033
- Table 75: Global Microtome Blades Revenue million Forecast, by Types 2020 & 2033
- Table 76: Global Microtome Blades Volume K Forecast, by Types 2020 & 2033
- Table 77: Global Microtome Blades Revenue million Forecast, by Country 2020 & 2033
- Table 78: Global Microtome Blades Volume K Forecast, by Country 2020 & 2033
- Table 79: China Microtome Blades Revenue (million) Forecast, by Application 2020 & 2033
- Table 80: China Microtome Blades Volume (K) Forecast, by Application 2020 & 2033
- Table 81: India Microtome Blades Revenue (million) Forecast, by Application 2020 & 2033
- Table 82: India Microtome Blades Volume (K) Forecast, by Application 2020 & 2033
- Table 83: Japan Microtome Blades Revenue (million) Forecast, by Application 2020 & 2033
- Table 84: Japan Microtome Blades Volume (K) Forecast, by Application 2020 & 2033
- Table 85: South Korea Microtome Blades Revenue (million) Forecast, by Application 2020 & 2033
- Table 86: South Korea Microtome Blades Volume (K) Forecast, by Application 2020 & 2033
- Table 87: ASEAN Microtome Blades Revenue (million) Forecast, by Application 2020 & 2033
- Table 88: ASEAN Microtome Blades Volume (K) Forecast, by Application 2020 & 2033
- Table 89: Oceania Microtome Blades Revenue (million) Forecast, by Application 2020 & 2033
- Table 90: Oceania Microtome Blades Volume (K) Forecast, by Application 2020 & 2033
- Table 91: Rest of Asia Pacific Microtome Blades Revenue (million) Forecast, by Application 2020 & 2033
- Table 92: Rest of Asia Pacific Microtome Blades Volume (K) Forecast, by Application 2020 & 2033
Frequently Asked Questions
1. What is the projected Compound Annual Growth Rate (CAGR) of the Microtome Blades?
The projected CAGR is approximately 6.16%.
2. Which companies are prominent players in the Microtome Blades?
Key companies in the market include Leica Biosystems, Epredia, FEATHER, Sakura Finetek, CL Sturkey, AccuTec Blades, Diapath, Trajan, Crescent Blades, General Data, StatLab, Avantik.
3. What are the main segments of the Microtome Blades?
The market segments include Application, Types.
4. Can you provide details about the market size?
The market size is estimated to be USD 339.52 million as of 2022.
5. What are some drivers contributing to market growth?
N/A
6. What are the notable trends driving market growth?
N/A
7. Are there any restraints impacting market growth?
N/A
8. Can you provide examples of recent developments in the market?
N/A
9. What pricing options are available for accessing the report?
Pricing options include single-user, multi-user, and enterprise licenses priced at USD 3350.00, USD 5025.00, and USD 6700.00 respectively.
10. Is the market size provided in terms of value or volume?
The market size is provided in terms of value, measured in million and volume, measured in K.
11. Are there any specific market keywords associated with the report?
Yes, the market keyword associated with the report is "Microtome Blades," which aids in identifying and referencing the specific market segment covered.
12. How do I determine which pricing option suits my needs best?
The pricing options vary based on user requirements and access needs. Individual users may opt for single-user licenses, while businesses requiring broader access may choose multi-user or enterprise licenses for cost-effective access to the report.
13. Are there any additional resources or data provided in the Microtome Blades report?
While the report offers comprehensive insights, it's advisable to review the specific contents or supplementary materials provided to ascertain if additional resources or data are available.
14. How can I stay updated on further developments or reports in the Microtome Blades?
To stay informed about further developments, trends, and reports in the Microtome Blades, consider subscribing to industry newsletters, following relevant companies and organizations, or regularly checking reputable industry news sources and publications.
Methodology
Step 1 - Identification of Relevant Samples Size from Population Database


Step 2 - Approaches for Defining Global Market Size (Value, Volume* & Price*)

Note*: In applicable scenarios
Step 3 - Data Sources
Primary Research
- Web Analytics
- Survey Reports
- Research Institute
- Latest Research Reports
- Opinion Leaders
Secondary Research
- Annual Reports
- White Paper
- Latest Press Release
- Industry Association
- Paid Database
- Investor Presentations

Step 4 - Data Triangulation
Involves using different sources of information in order to increase the validity of a study
These sources are likely to be stakeholders in a program - participants, other researchers, program staff, other community members, and so on.
Then we put all data in single framework & apply various statistical tools to find out the dynamic on the market.
During the analysis stage, feedback from the stakeholder groups would be compared to determine areas of agreement as well as areas of divergence