

Key Insights
The Military 3D and 4D Printing market is experiencing significant expansion, driven by the escalating demand for advanced, lightweight, and high-performance military equipment. This sector is projected for robust growth, fueled by the need for rapid prototyping, enhanced supply chain resilience, and the creation of highly specialized weaponry and adaptable equipment. Additive manufacturing, including 4D printing's innovative material properties, enables the production of complex, optimized components for aerospace, land vehicles, and naval applications, surpassing traditional manufacturing limitations. Key growth regions include North America and Europe, with substantial potential in the Asia-Pacific due to increasing defense investments and technological innovation. While initial investment costs and the need for skilled personnel present challenges, ongoing advancements and elevated military spending are poised to propel substantial market growth.
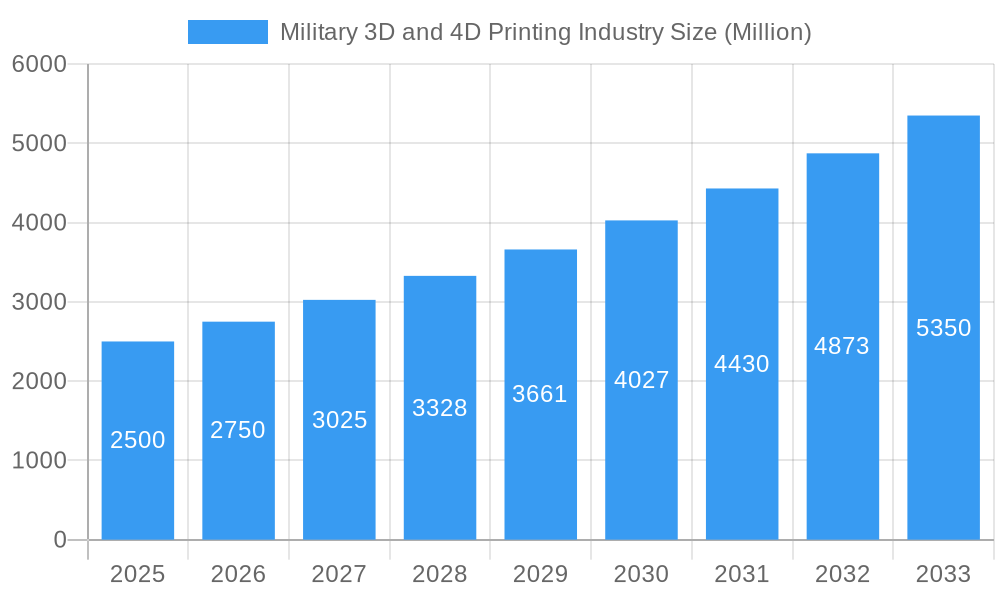
Military 3D and 4D Printing Industry Market Size (In Million)
Market segmentation across airborne, land, and sea platforms reveals extensive opportunities. Airborne applications, particularly for drones and aircraft components, are rapidly advancing due to the demand for lightweight, high-strength parts. Land-based applications benefit from the production of customized vehicle components and personal protective equipment. Sea-based applications are adopting additive manufacturing for durable, corrosion-resistant naval and underwater equipment. Leading innovators are driving market progress through continuous technological development and strategic expansion into new defense applications, fostering a dynamic and competitive global landscape across North America, Europe, and Asia-Pacific.
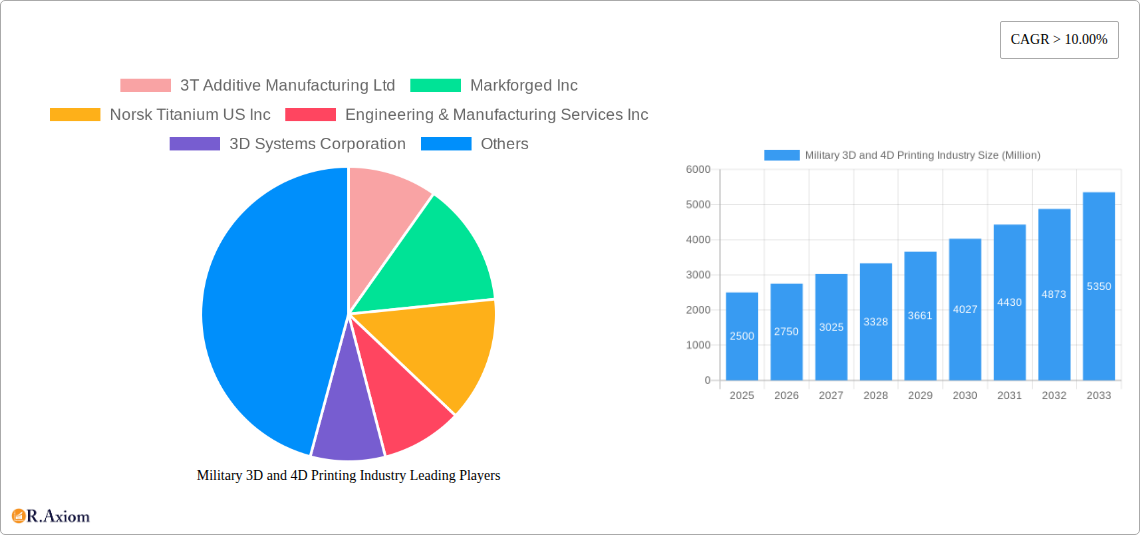
Military 3D and 4D Printing Industry Company Market Share
Military 3D and 4D Printing Industry Analysis (2019-2033)
This comprehensive analysis of the Military 3D and 4D Printing industry offers actionable insights for stakeholders. The study covers 2019-2033, with 2025 as the base year. The forecast period is 2025-2033. The report examines market trends, key players, technological advancements, and future growth prospects. The global market size is projected to reach 307.72 million by 2033, exhibiting a CAGR of 40.9% during the forecast period.
Military 3D and 4D Printing Industry Market Concentration & Innovation
The Military 3D and 4D printing market exhibits a moderately concentrated landscape, with a handful of major players controlling a significant market share. 3T Additive Manufacturing Ltd, Markforged Inc, Norsk Titanium US Inc, Engineering & Manufacturing Services Inc, 3D Systems Corporation, EOS Gmbh, Nano Dimensions Ltd, Stratasys Ltd, and ExOne Company are some key players driving innovation. Market share is highly dynamic, with ongoing M&A activity and the emergence of specialized niche players. Recent M&A deals have involved valuations ranging from xx Million to xx Million, reflecting the significant investment in the sector. Innovation is driven by the need for lighter, stronger, and more customized military equipment. Regulatory frameworks, such as those concerning material safety and export controls, influence market growth. Product substitutes, such as traditional manufacturing techniques, continue to compete, although additive manufacturing's advantages in customization and rapid prototyping are creating a shift. End-user trends favor increased adoption of 3D printing for prototyping, low-volume production, and on-demand manufacturing within the military.
- Market Share: The top five players collectively hold approximately xx% of the market share.
- M&A Activity: Significant M&A activity indicates consolidation and expansion within the industry.
- Innovation Drivers: Demand for customized, lightweight, and high-performance military equipment.
Military 3D and 4D Printing Industry Industry Trends & Insights
The Military 3D and 4D printing industry is experiencing substantial growth, driven by several key factors. The increasing demand for lightweight and customized military equipment is a major growth catalyst. Advancements in 3D printing technologies, including improvements in material science and printing speed, are also fueling market expansion. Furthermore, the adoption of 3D printing for rapid prototyping and on-demand manufacturing within the military is creating opportunities for market expansion. Consumer preferences within the military industry emphasize durability, lightweight materials and reduced production timelines. Competitive dynamics are shaped by intense competition among established players and emerging startups, focusing on innovation, cost optimization, and strategic partnerships. The CAGR of the market is projected at xx%, and market penetration is expected to increase significantly over the next decade. The use of 4D printing, which incorporates materials that change shape or properties in response to stimuli, presents significant future opportunities.
Dominant Markets & Segments in Military 3D and 4D Printing Industry
The Airborne segment currently dominates the Military 3D and 4D printing market, driven by the high demand for lightweight and customized aircraft components. This dominance is attributed to factors such as the inherent need for customized parts in aircraft and the ability of 3D printing to efficiently produce those components. The Land segment is witnessing consistent growth driven by increasing demand for customized weaponry and military vehicles. The Sea segment is also expected to witness significant growth, with increasing investments and the adoption of 3D printing in naval applications.
- Airborne Segment Drivers: Demand for lightweight aircraft components, reduced production costs, and rapid prototyping capabilities.
- Land Segment Drivers: Production of customized weaponry, armored vehicles, and other ground-based military equipment.
- Sea Segment Drivers: Increased naval investments, demand for customized components, and need for improved vessel durability.
Military 3D and 4D Printing Industry Product Developments
Recent product innovations focus on high-performance materials like advanced polymers and metals, enabling the production of stronger, lighter, and more resilient military components. The applications span from creating customized weapons and parts for military vehicles to producing complex aerospace components. Competitive advantages stem from enhanced printing speed, improved material properties, and the ability to produce highly complex geometries. This creates a market niche for rapid prototyping and the production of highly specialized parts not feasible with traditional manufacturing methods.
Report Scope & Segmentation Analysis
This report segments the Military 3D and 4D printing market by platform: Airborne, Land, and Sea. The Airborne segment is expected to exhibit the highest growth rate, driven by the increasing demand for lightweight and high-performance aircraft components. The Land segment, focusing on ground vehicles and weaponry, is predicted to experience steady growth, while the Sea segment, including naval applications, shows a promising upward trend. Each segment showcases unique competitive dynamics, with differing material requirements and manufacturing processes. Growth projections and market sizes are provided for each segment, offering a detailed view of the market's structure and potential.
Key Drivers of Military 3D and 4D Printing Industry Growth
Several factors drive the growth of the Military 3D and 4D printing industry. Technological advancements lead to faster printing speeds, enhanced material properties, and greater design flexibility. Economic benefits, such as reduced production costs and shorter lead times, make 3D printing increasingly attractive. Furthermore, supportive government regulations and increased military investments in advanced manufacturing technologies fuel the sector's expansion.
Challenges in the Military 3D and 4D Printing Industry Sector
The Military 3D and 4D printing industry faces several challenges. Stringent regulatory requirements related to material safety and export controls can create barriers to entry and increase production costs. Supply chain disruptions can significantly impact material availability and production schedules. Intense competition among numerous companies also presents a challenge in maintaining market share and profitability. These challenges can collectively impact the industry's growth trajectory, albeit not necessarily halting it entirely.
Emerging Opportunities in Military 3D and 4D Printing Industry
Emerging trends present significant opportunities. The integration of Artificial Intelligence (AI) in design and manufacturing processes enhances efficiency and optimizes part performance. The development of new, high-performance materials unlocks broader applications and pushes the boundaries of what can be produced. Expanding into new military applications, such as personalized protective gear and advanced weaponry, provides further growth potential.
Leading Players in the Military 3D and 4D Printing Industry Market
- 3T Additive Manufacturing Ltd
- Markforged Inc
- Norsk Titanium US Inc
- Engineering & Manufacturing Services Inc
- 3D Systems Corporation
- EOS Gmbh
- Nano Dimensions Ltd
- Stratasys Ltd
- ExOne Company
Key Developments in Military 3D and 4D Printing Industry Industry
- November 2022: 3D Systems and ALM partnered to expand access to industry-leading 3D printing materials, accelerating material adoption and driving industry growth.
- September 2021: General Lattice secured a US Army contract to develop a 3D-printed combat helmet with improved energy absorption, showcasing the potential of additive manufacturing in enhancing military equipment.
Strategic Outlook for Military 3D and 4D Printing Industry Market
The Military 3D and 4D printing market is poised for significant growth, driven by continuous technological advancements, increasing demand for customized equipment, and supportive government policies. The integration of AI and the development of novel materials will create new opportunities, while addressing the challenges of regulation and supply chain management will be crucial for sustained growth. The market’s future potential lies in expanding its applications within the military and leveraging the unique capabilities of additive manufacturing to create innovative, high-performance equipment.
Military 3D and 4D Printing Industry Segmentation
- 1. Production Analysis
- 2. Consumption Analysis
- 3. Import Market Analysis (Value & Volume)
- 4. Export Market Analysis (Value & Volume)
- 5. Price Trend Analysis
Military 3D and 4D Printing Industry Segmentation By Geography
-
1. North America
- 1.1. United States
- 1.2. Canada
- 1.3. Mexico
-
2. South America
- 2.1. Brazil
- 2.2. Argentina
- 2.3. Rest of South America
-
3. Europe
- 3.1. United Kingdom
- 3.2. Germany
- 3.3. France
- 3.4. Italy
- 3.5. Spain
- 3.6. Russia
- 3.7. Benelux
- 3.8. Nordics
- 3.9. Rest of Europe
-
4. Middle East & Africa
- 4.1. Turkey
- 4.2. Israel
- 4.3. GCC
- 4.4. North Africa
- 4.5. South Africa
- 4.6. Rest of Middle East & Africa
-
5. Asia Pacific
- 5.1. China
- 5.2. India
- 5.3. Japan
- 5.4. South Korea
- 5.5. ASEAN
- 5.6. Oceania
- 5.7. Rest of Asia Pacific
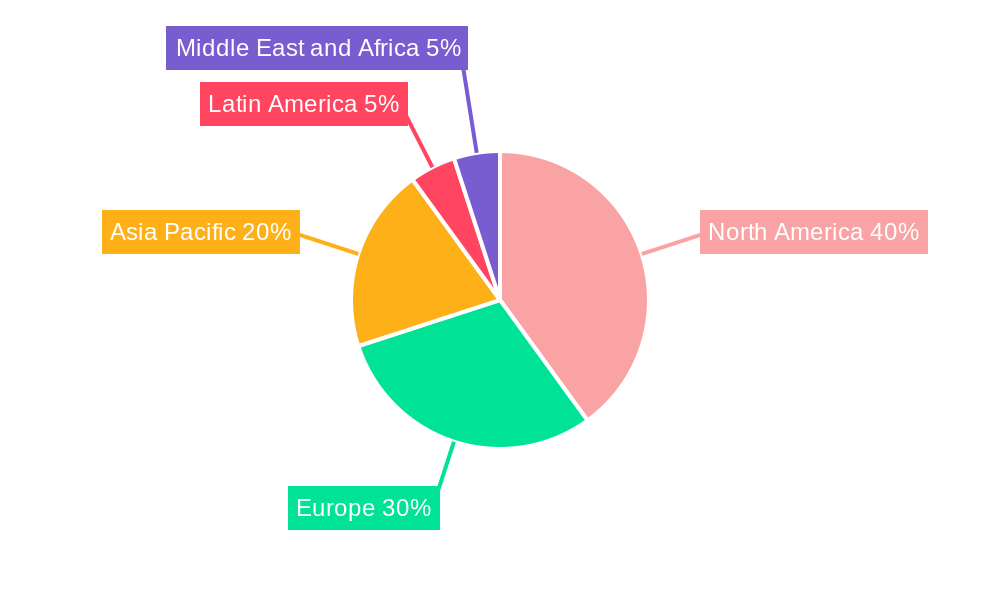
Military 3D and 4D Printing Industry Regional Market Share
Geographic Coverage of Military 3D and 4D Printing Industry
Military 3D and 4D Printing Industry REPORT HIGHLIGHTS
| Aspects | Details |
|---|---|
| Study Period | 2020-2034 |
| Base Year | 2025 |
| Estimated Year | 2026 |
| Forecast Period | 2026-2034 |
| Historical Period | 2020-2025 |
| Growth Rate | CAGR of 35.8% from 2020-2034 |
| Segmentation |
|
Table of Contents
- 1. Introduction
- 1.1. Research Scope
- 1.2. Market Segmentation
- 1.3. Research Objective
- 1.4. Definitions and Assumptions
- 2. Executive Summary
- 2.1. Market Snapshot
- 3. Market Dynamics
- 3.1. Market Drivers
- 3.2. Market Restrains
- 3.3. Market Trends
- 3.4. Market Opportunities
- 4. Market Factor Analysis
- 4.1. Porters Five Forces
- 4.1.1. Bargaining Power of Suppliers
- 4.1.2. Bargaining Power of Buyers
- 4.1.3. Threat of New Entrants
- 4.1.4. Threat of Substitutes
- 4.1.5. Competitive Rivalry
- 4.2. PESTEL analysis
- 4.3. BCG Analysis
- 4.3.1. Stars (High Growth, High Market Share)
- 4.3.2. Cash Cows (Low Growth, High Market Share)
- 4.3.3. Question Mark (High Growth, Low Market Share)
- 4.3.4. Dogs (Low Growth, Low Market Share)
- 4.4. Ansoff Matrix Analysis
- 4.5. Supply Chain Analysis
- 4.6. Regulatory Landscape
- 4.7. Current Market Potential and Opportunity Assessment (TAM–SAM–SOM Framework)
- 4.8. RAX Analyst Note
- 4.1. Porters Five Forces
- 5. Market Analysis, Insights and Forecast 2021-2033
- 5.1. Market Analysis, Insights and Forecast - by Production Analysis
- 5.2. Market Analysis, Insights and Forecast - by Consumption Analysis
- 5.3. Market Analysis, Insights and Forecast - by Import Market Analysis (Value & Volume)
- 5.4. Market Analysis, Insights and Forecast - by Export Market Analysis (Value & Volume)
- 5.5. Market Analysis, Insights and Forecast - by Price Trend Analysis
- 5.6. Market Analysis, Insights and Forecast - by Region
- 5.6.1. North America
- 5.6.2. South America
- 5.6.3. Europe
- 5.6.4. Middle East & Africa
- 5.6.5. Asia Pacific
- 6. Global Military 3D and 4D Printing Industry Analysis, Insights and Forecast, 2021-2033
- 6.1. Market Analysis, Insights and Forecast - by Production Analysis
- 6.2. Market Analysis, Insights and Forecast - by Consumption Analysis
- 6.3. Market Analysis, Insights and Forecast - by Import Market Analysis (Value & Volume)
- 6.4. Market Analysis, Insights and Forecast - by Export Market Analysis (Value & Volume)
- 6.5. Market Analysis, Insights and Forecast - by Price Trend Analysis
- 7. North America Military 3D and 4D Printing Industry Analysis, Insights and Forecast, 2020-2032
- 7.1. Market Analysis, Insights and Forecast - by Production Analysis
- 7.2. Market Analysis, Insights and Forecast - by Consumption Analysis
- 7.3. Market Analysis, Insights and Forecast - by Import Market Analysis (Value & Volume)
- 7.4. Market Analysis, Insights and Forecast - by Export Market Analysis (Value & Volume)
- 7.5. Market Analysis, Insights and Forecast - by Price Trend Analysis
- 8. South America Military 3D and 4D Printing Industry Analysis, Insights and Forecast, 2020-2032
- 8.1. Market Analysis, Insights and Forecast - by Production Analysis
- 8.2. Market Analysis, Insights and Forecast - by Consumption Analysis
- 8.3. Market Analysis, Insights and Forecast - by Import Market Analysis (Value & Volume)
- 8.4. Market Analysis, Insights and Forecast - by Export Market Analysis (Value & Volume)
- 8.5. Market Analysis, Insights and Forecast - by Price Trend Analysis
- 9. Europe Military 3D and 4D Printing Industry Analysis, Insights and Forecast, 2020-2032
- 9.1. Market Analysis, Insights and Forecast - by Production Analysis
- 9.2. Market Analysis, Insights and Forecast - by Consumption Analysis
- 9.3. Market Analysis, Insights and Forecast - by Import Market Analysis (Value & Volume)
- 9.4. Market Analysis, Insights and Forecast - by Export Market Analysis (Value & Volume)
- 9.5. Market Analysis, Insights and Forecast - by Price Trend Analysis
- 10. Middle East & Africa Military 3D and 4D Printing Industry Analysis, Insights and Forecast, 2020-2032
- 10.1. Market Analysis, Insights and Forecast - by Production Analysis
- 10.2. Market Analysis, Insights and Forecast - by Consumption Analysis
- 10.3. Market Analysis, Insights and Forecast - by Import Market Analysis (Value & Volume)
- 10.4. Market Analysis, Insights and Forecast - by Export Market Analysis (Value & Volume)
- 10.5. Market Analysis, Insights and Forecast - by Price Trend Analysis
- 11. Asia Pacific Military 3D and 4D Printing Industry Analysis, Insights and Forecast, 2020-2032
- 11.1. Market Analysis, Insights and Forecast - by Production Analysis
- 11.2. Market Analysis, Insights and Forecast - by Consumption Analysis
- 11.3. Market Analysis, Insights and Forecast - by Import Market Analysis (Value & Volume)
- 11.4. Market Analysis, Insights and Forecast - by Export Market Analysis (Value & Volume)
- 11.5. Market Analysis, Insights and Forecast - by Price Trend Analysis
- 12. Competitive Analysis
- 12.1. Company Profiles
- 12.1.1 3T Additive Manufacturing Ltd
- 12.1.1.1. Company Overview
- 12.1.1.2. Products
- 12.1.1.3. Company Financials
- 12.1.1.4. SWOT Analysis
- 12.1.2 Markforged Inc
- 12.1.2.1. Company Overview
- 12.1.2.2. Products
- 12.1.2.3. Company Financials
- 12.1.2.4. SWOT Analysis
- 12.1.3 Norsk Titanium US Inc
- 12.1.3.1. Company Overview
- 12.1.3.2. Products
- 12.1.3.3. Company Financials
- 12.1.3.4. SWOT Analysis
- 12.1.4 Engineering & Manufacturing Services Inc
- 12.1.4.1. Company Overview
- 12.1.4.2. Products
- 12.1.4.3. Company Financials
- 12.1.4.4. SWOT Analysis
- 12.1.5 3D Systems Corporation
- 12.1.5.1. Company Overview
- 12.1.5.2. Products
- 12.1.5.3. Company Financials
- 12.1.5.4. SWOT Analysis
- 12.1.6 EOS Gmbh
- 12.1.6.1. Company Overview
- 12.1.6.2. Products
- 12.1.6.3. Company Financials
- 12.1.6.4. SWOT Analysis
- 12.1.7 Nano Dimensions Ltd
- 12.1.7.1. Company Overview
- 12.1.7.2. Products
- 12.1.7.3. Company Financials
- 12.1.7.4. SWOT Analysis
- 12.1.8 Stratasys Ltd
- 12.1.8.1. Company Overview
- 12.1.8.2. Products
- 12.1.8.3. Company Financials
- 12.1.8.4. SWOT Analysis
- 12.1.9 ExOne Company
- 12.1.9.1. Company Overview
- 12.1.9.2. Products
- 12.1.9.3. Company Financials
- 12.1.9.4. SWOT Analysis
- 12.1.1 3T Additive Manufacturing Ltd
- 12.2. Market Entropy
- 12.2.1 Company's Key Areas Served
- 12.2.2 Recent Developments
- 12.3. Company Market Share Analysis 2025
- 12.3.1 Top 5 Companies Market Share Analysis
- 12.3.2 Top 3 Companies Market Share Analysis
- 12.4. List of Potential Customers
- 13. Research Methodology
List of Figures
- Figure 1: Global Military 3D and 4D Printing Industry Revenue Breakdown (million, %) by Region 2025 & 2033
- Figure 2: North America Military 3D and 4D Printing Industry Revenue (million), by Production Analysis 2025 & 2033
- Figure 3: North America Military 3D and 4D Printing Industry Revenue Share (%), by Production Analysis 2025 & 2033
- Figure 4: North America Military 3D and 4D Printing Industry Revenue (million), by Consumption Analysis 2025 & 2033
- Figure 5: North America Military 3D and 4D Printing Industry Revenue Share (%), by Consumption Analysis 2025 & 2033
- Figure 6: North America Military 3D and 4D Printing Industry Revenue (million), by Import Market Analysis (Value & Volume) 2025 & 2033
- Figure 7: North America Military 3D and 4D Printing Industry Revenue Share (%), by Import Market Analysis (Value & Volume) 2025 & 2033
- Figure 8: North America Military 3D and 4D Printing Industry Revenue (million), by Export Market Analysis (Value & Volume) 2025 & 2033
- Figure 9: North America Military 3D and 4D Printing Industry Revenue Share (%), by Export Market Analysis (Value & Volume) 2025 & 2033
- Figure 10: North America Military 3D and 4D Printing Industry Revenue (million), by Price Trend Analysis 2025 & 2033
- Figure 11: North America Military 3D and 4D Printing Industry Revenue Share (%), by Price Trend Analysis 2025 & 2033
- Figure 12: North America Military 3D and 4D Printing Industry Revenue (million), by Country 2025 & 2033
- Figure 13: North America Military 3D and 4D Printing Industry Revenue Share (%), by Country 2025 & 2033
- Figure 14: South America Military 3D and 4D Printing Industry Revenue (million), by Production Analysis 2025 & 2033
- Figure 15: South America Military 3D and 4D Printing Industry Revenue Share (%), by Production Analysis 2025 & 2033
- Figure 16: South America Military 3D and 4D Printing Industry Revenue (million), by Consumption Analysis 2025 & 2033
- Figure 17: South America Military 3D and 4D Printing Industry Revenue Share (%), by Consumption Analysis 2025 & 2033
- Figure 18: South America Military 3D and 4D Printing Industry Revenue (million), by Import Market Analysis (Value & Volume) 2025 & 2033
- Figure 19: South America Military 3D and 4D Printing Industry Revenue Share (%), by Import Market Analysis (Value & Volume) 2025 & 2033
- Figure 20: South America Military 3D and 4D Printing Industry Revenue (million), by Export Market Analysis (Value & Volume) 2025 & 2033
- Figure 21: South America Military 3D and 4D Printing Industry Revenue Share (%), by Export Market Analysis (Value & Volume) 2025 & 2033
- Figure 22: South America Military 3D and 4D Printing Industry Revenue (million), by Price Trend Analysis 2025 & 2033
- Figure 23: South America Military 3D and 4D Printing Industry Revenue Share (%), by Price Trend Analysis 2025 & 2033
- Figure 24: South America Military 3D and 4D Printing Industry Revenue (million), by Country 2025 & 2033
- Figure 25: South America Military 3D and 4D Printing Industry Revenue Share (%), by Country 2025 & 2033
- Figure 26: Europe Military 3D and 4D Printing Industry Revenue (million), by Production Analysis 2025 & 2033
- Figure 27: Europe Military 3D and 4D Printing Industry Revenue Share (%), by Production Analysis 2025 & 2033
- Figure 28: Europe Military 3D and 4D Printing Industry Revenue (million), by Consumption Analysis 2025 & 2033
- Figure 29: Europe Military 3D and 4D Printing Industry Revenue Share (%), by Consumption Analysis 2025 & 2033
- Figure 30: Europe Military 3D and 4D Printing Industry Revenue (million), by Import Market Analysis (Value & Volume) 2025 & 2033
- Figure 31: Europe Military 3D and 4D Printing Industry Revenue Share (%), by Import Market Analysis (Value & Volume) 2025 & 2033
- Figure 32: Europe Military 3D and 4D Printing Industry Revenue (million), by Export Market Analysis (Value & Volume) 2025 & 2033
- Figure 33: Europe Military 3D and 4D Printing Industry Revenue Share (%), by Export Market Analysis (Value & Volume) 2025 & 2033
- Figure 34: Europe Military 3D and 4D Printing Industry Revenue (million), by Price Trend Analysis 2025 & 2033
- Figure 35: Europe Military 3D and 4D Printing Industry Revenue Share (%), by Price Trend Analysis 2025 & 2033
- Figure 36: Europe Military 3D and 4D Printing Industry Revenue (million), by Country 2025 & 2033
- Figure 37: Europe Military 3D and 4D Printing Industry Revenue Share (%), by Country 2025 & 2033
- Figure 38: Middle East & Africa Military 3D and 4D Printing Industry Revenue (million), by Production Analysis 2025 & 2033
- Figure 39: Middle East & Africa Military 3D and 4D Printing Industry Revenue Share (%), by Production Analysis 2025 & 2033
- Figure 40: Middle East & Africa Military 3D and 4D Printing Industry Revenue (million), by Consumption Analysis 2025 & 2033
- Figure 41: Middle East & Africa Military 3D and 4D Printing Industry Revenue Share (%), by Consumption Analysis 2025 & 2033
- Figure 42: Middle East & Africa Military 3D and 4D Printing Industry Revenue (million), by Import Market Analysis (Value & Volume) 2025 & 2033
- Figure 43: Middle East & Africa Military 3D and 4D Printing Industry Revenue Share (%), by Import Market Analysis (Value & Volume) 2025 & 2033
- Figure 44: Middle East & Africa Military 3D and 4D Printing Industry Revenue (million), by Export Market Analysis (Value & Volume) 2025 & 2033
- Figure 45: Middle East & Africa Military 3D and 4D Printing Industry Revenue Share (%), by Export Market Analysis (Value & Volume) 2025 & 2033
- Figure 46: Middle East & Africa Military 3D and 4D Printing Industry Revenue (million), by Price Trend Analysis 2025 & 2033
- Figure 47: Middle East & Africa Military 3D and 4D Printing Industry Revenue Share (%), by Price Trend Analysis 2025 & 2033
- Figure 48: Middle East & Africa Military 3D and 4D Printing Industry Revenue (million), by Country 2025 & 2033
- Figure 49: Middle East & Africa Military 3D and 4D Printing Industry Revenue Share (%), by Country 2025 & 2033
- Figure 50: Asia Pacific Military 3D and 4D Printing Industry Revenue (million), by Production Analysis 2025 & 2033
- Figure 51: Asia Pacific Military 3D and 4D Printing Industry Revenue Share (%), by Production Analysis 2025 & 2033
- Figure 52: Asia Pacific Military 3D and 4D Printing Industry Revenue (million), by Consumption Analysis 2025 & 2033
- Figure 53: Asia Pacific Military 3D and 4D Printing Industry Revenue Share (%), by Consumption Analysis 2025 & 2033
- Figure 54: Asia Pacific Military 3D and 4D Printing Industry Revenue (million), by Import Market Analysis (Value & Volume) 2025 & 2033
- Figure 55: Asia Pacific Military 3D and 4D Printing Industry Revenue Share (%), by Import Market Analysis (Value & Volume) 2025 & 2033
- Figure 56: Asia Pacific Military 3D and 4D Printing Industry Revenue (million), by Export Market Analysis (Value & Volume) 2025 & 2033
- Figure 57: Asia Pacific Military 3D and 4D Printing Industry Revenue Share (%), by Export Market Analysis (Value & Volume) 2025 & 2033
- Figure 58: Asia Pacific Military 3D and 4D Printing Industry Revenue (million), by Price Trend Analysis 2025 & 2033
- Figure 59: Asia Pacific Military 3D and 4D Printing Industry Revenue Share (%), by Price Trend Analysis 2025 & 2033
- Figure 60: Asia Pacific Military 3D and 4D Printing Industry Revenue (million), by Country 2025 & 2033
- Figure 61: Asia Pacific Military 3D and 4D Printing Industry Revenue Share (%), by Country 2025 & 2033
List of Tables
- Table 1: Global Military 3D and 4D Printing Industry Revenue million Forecast, by Production Analysis 2020 & 2033
- Table 2: Global Military 3D and 4D Printing Industry Revenue million Forecast, by Consumption Analysis 2020 & 2033
- Table 3: Global Military 3D and 4D Printing Industry Revenue million Forecast, by Import Market Analysis (Value & Volume) 2020 & 2033
- Table 4: Global Military 3D and 4D Printing Industry Revenue million Forecast, by Export Market Analysis (Value & Volume) 2020 & 2033
- Table 5: Global Military 3D and 4D Printing Industry Revenue million Forecast, by Price Trend Analysis 2020 & 2033
- Table 6: Global Military 3D and 4D Printing Industry Revenue million Forecast, by Region 2020 & 2033
- Table 7: Global Military 3D and 4D Printing Industry Revenue million Forecast, by Production Analysis 2020 & 2033
- Table 8: Global Military 3D and 4D Printing Industry Revenue million Forecast, by Consumption Analysis 2020 & 2033
- Table 9: Global Military 3D and 4D Printing Industry Revenue million Forecast, by Import Market Analysis (Value & Volume) 2020 & 2033
- Table 10: Global Military 3D and 4D Printing Industry Revenue million Forecast, by Export Market Analysis (Value & Volume) 2020 & 2033
- Table 11: Global Military 3D and 4D Printing Industry Revenue million Forecast, by Price Trend Analysis 2020 & 2033
- Table 12: Global Military 3D and 4D Printing Industry Revenue million Forecast, by Country 2020 & 2033
- Table 13: United States Military 3D and 4D Printing Industry Revenue (million) Forecast, by Application 2020 & 2033
- Table 14: Canada Military 3D and 4D Printing Industry Revenue (million) Forecast, by Application 2020 & 2033
- Table 15: Mexico Military 3D and 4D Printing Industry Revenue (million) Forecast, by Application 2020 & 2033
- Table 16: Global Military 3D and 4D Printing Industry Revenue million Forecast, by Production Analysis 2020 & 2033
- Table 17: Global Military 3D and 4D Printing Industry Revenue million Forecast, by Consumption Analysis 2020 & 2033
- Table 18: Global Military 3D and 4D Printing Industry Revenue million Forecast, by Import Market Analysis (Value & Volume) 2020 & 2033
- Table 19: Global Military 3D and 4D Printing Industry Revenue million Forecast, by Export Market Analysis (Value & Volume) 2020 & 2033
- Table 20: Global Military 3D and 4D Printing Industry Revenue million Forecast, by Price Trend Analysis 2020 & 2033
- Table 21: Global Military 3D and 4D Printing Industry Revenue million Forecast, by Country 2020 & 2033
- Table 22: Brazil Military 3D and 4D Printing Industry Revenue (million) Forecast, by Application 2020 & 2033
- Table 23: Argentina Military 3D and 4D Printing Industry Revenue (million) Forecast, by Application 2020 & 2033
- Table 24: Rest of South America Military 3D and 4D Printing Industry Revenue (million) Forecast, by Application 2020 & 2033
- Table 25: Global Military 3D and 4D Printing Industry Revenue million Forecast, by Production Analysis 2020 & 2033
- Table 26: Global Military 3D and 4D Printing Industry Revenue million Forecast, by Consumption Analysis 2020 & 2033
- Table 27: Global Military 3D and 4D Printing Industry Revenue million Forecast, by Import Market Analysis (Value & Volume) 2020 & 2033
- Table 28: Global Military 3D and 4D Printing Industry Revenue million Forecast, by Export Market Analysis (Value & Volume) 2020 & 2033
- Table 29: Global Military 3D and 4D Printing Industry Revenue million Forecast, by Price Trend Analysis 2020 & 2033
- Table 30: Global Military 3D and 4D Printing Industry Revenue million Forecast, by Country 2020 & 2033
- Table 31: United Kingdom Military 3D and 4D Printing Industry Revenue (million) Forecast, by Application 2020 & 2033
- Table 32: Germany Military 3D and 4D Printing Industry Revenue (million) Forecast, by Application 2020 & 2033
- Table 33: France Military 3D and 4D Printing Industry Revenue (million) Forecast, by Application 2020 & 2033
- Table 34: Italy Military 3D and 4D Printing Industry Revenue (million) Forecast, by Application 2020 & 2033
- Table 35: Spain Military 3D and 4D Printing Industry Revenue (million) Forecast, by Application 2020 & 2033
- Table 36: Russia Military 3D and 4D Printing Industry Revenue (million) Forecast, by Application 2020 & 2033
- Table 37: Benelux Military 3D and 4D Printing Industry Revenue (million) Forecast, by Application 2020 & 2033
- Table 38: Nordics Military 3D and 4D Printing Industry Revenue (million) Forecast, by Application 2020 & 2033
- Table 39: Rest of Europe Military 3D and 4D Printing Industry Revenue (million) Forecast, by Application 2020 & 2033
- Table 40: Global Military 3D and 4D Printing Industry Revenue million Forecast, by Production Analysis 2020 & 2033
- Table 41: Global Military 3D and 4D Printing Industry Revenue million Forecast, by Consumption Analysis 2020 & 2033
- Table 42: Global Military 3D and 4D Printing Industry Revenue million Forecast, by Import Market Analysis (Value & Volume) 2020 & 2033
- Table 43: Global Military 3D and 4D Printing Industry Revenue million Forecast, by Export Market Analysis (Value & Volume) 2020 & 2033
- Table 44: Global Military 3D and 4D Printing Industry Revenue million Forecast, by Price Trend Analysis 2020 & 2033
- Table 45: Global Military 3D and 4D Printing Industry Revenue million Forecast, by Country 2020 & 2033
- Table 46: Turkey Military 3D and 4D Printing Industry Revenue (million) Forecast, by Application 2020 & 2033
- Table 47: Israel Military 3D and 4D Printing Industry Revenue (million) Forecast, by Application 2020 & 2033
- Table 48: GCC Military 3D and 4D Printing Industry Revenue (million) Forecast, by Application 2020 & 2033
- Table 49: North Africa Military 3D and 4D Printing Industry Revenue (million) Forecast, by Application 2020 & 2033
- Table 50: South Africa Military 3D and 4D Printing Industry Revenue (million) Forecast, by Application 2020 & 2033
- Table 51: Rest of Middle East & Africa Military 3D and 4D Printing Industry Revenue (million) Forecast, by Application 2020 & 2033
- Table 52: Global Military 3D and 4D Printing Industry Revenue million Forecast, by Production Analysis 2020 & 2033
- Table 53: Global Military 3D and 4D Printing Industry Revenue million Forecast, by Consumption Analysis 2020 & 2033
- Table 54: Global Military 3D and 4D Printing Industry Revenue million Forecast, by Import Market Analysis (Value & Volume) 2020 & 2033
- Table 55: Global Military 3D and 4D Printing Industry Revenue million Forecast, by Export Market Analysis (Value & Volume) 2020 & 2033
- Table 56: Global Military 3D and 4D Printing Industry Revenue million Forecast, by Price Trend Analysis 2020 & 2033
- Table 57: Global Military 3D and 4D Printing Industry Revenue million Forecast, by Country 2020 & 2033
- Table 58: China Military 3D and 4D Printing Industry Revenue (million) Forecast, by Application 2020 & 2033
- Table 59: India Military 3D and 4D Printing Industry Revenue (million) Forecast, by Application 2020 & 2033
- Table 60: Japan Military 3D and 4D Printing Industry Revenue (million) Forecast, by Application 2020 & 2033
- Table 61: South Korea Military 3D and 4D Printing Industry Revenue (million) Forecast, by Application 2020 & 2033
- Table 62: ASEAN Military 3D and 4D Printing Industry Revenue (million) Forecast, by Application 2020 & 2033
- Table 63: Oceania Military 3D and 4D Printing Industry Revenue (million) Forecast, by Application 2020 & 2033
- Table 64: Rest of Asia Pacific Military 3D and 4D Printing Industry Revenue (million) Forecast, by Application 2020 & 2033
Frequently Asked Questions
1. What is the projected Compound Annual Growth Rate (CAGR) of the Military 3D and 4D Printing Industry?
The projected CAGR is approximately 35.8%.
2. Which companies are prominent players in the Military 3D and 4D Printing Industry?
Key companies in the market include 3T Additive Manufacturing Ltd, Markforged Inc, Norsk Titanium US Inc, Engineering & Manufacturing Services Inc, 3D Systems Corporation, EOS Gmbh, Nano Dimensions Ltd, Stratasys Ltd, ExOne Company.
3. What are the main segments of the Military 3D and 4D Printing Industry?
The market segments include Production Analysis, Consumption Analysis, Import Market Analysis (Value & Volume), Export Market Analysis (Value & Volume), Price Trend Analysis.
4. Can you provide details about the market size?
The market size is estimated to be USD 156.8 million as of 2022.
5. What are some drivers contributing to market growth?
N/A
6. What are the notable trends driving market growth?
Airborne Segment Held Highest Shares in the Market.
7. Are there any restraints impacting market growth?
N/A
8. Can you provide examples of recent developments in the market?
November 2022: 3D Systems and ALM announced their partnership to expand access to industry-leading 3D printing materials. The companies plan to accelerate material adoption and drive additive manufacturing industry growth by providing access to industry-leading 3D printing materials.
9. What pricing options are available for accessing the report?
Pricing options include single-user, multi-user, and enterprise licenses priced at USD 4750, USD 5250, and USD 8750 respectively.
10. Is the market size provided in terms of value or volume?
The market size is provided in terms of value, measured in million.
11. Are there any specific market keywords associated with the report?
Yes, the market keyword associated with the report is "Military 3D and 4D Printing Industry," which aids in identifying and referencing the specific market segment covered.
12. How do I determine which pricing option suits my needs best?
The pricing options vary based on user requirements and access needs. Individual users may opt for single-user licenses, while businesses requiring broader access may choose multi-user or enterprise licenses for cost-effective access to the report.
13. Are there any additional resources or data provided in the Military 3D and 4D Printing Industry report?
While the report offers comprehensive insights, it's advisable to review the specific contents or supplementary materials provided to ascertain if additional resources or data are available.
14. How can I stay updated on further developments or reports in the Military 3D and 4D Printing Industry?
To stay informed about further developments, trends, and reports in the Military 3D and 4D Printing Industry, consider subscribing to industry newsletters, following relevant companies and organizations, or regularly checking reputable industry news sources and publications.
Methodology
Step 1 - Identification of Relevant Samples Size from Population Database


Step 2 - Approaches for Defining Global Market Size (Value, Volume* & Price*)

Note*: In applicable scenarios
Step 3 - Data Sources
Primary Research
- Web Analytics
- Survey Reports
- Research Institute
- Latest Research Reports
- Opinion Leaders
Secondary Research
- Annual Reports
- White Paper
- Latest Press Release
- Industry Association
- Paid Database
- Investor Presentations

Step 4 - Data Triangulation
Involves using different sources of information in order to increase the validity of a study
These sources are likely to be stakeholders in a program - participants, other researchers, program staff, other community members, and so on.
Then we put all data in single framework & apply various statistical tools to find out the dynamic on the market.
During the analysis stage, feedback from the stakeholder groups would be compared to determine areas of agreement as well as areas of divergence