

Key Insights
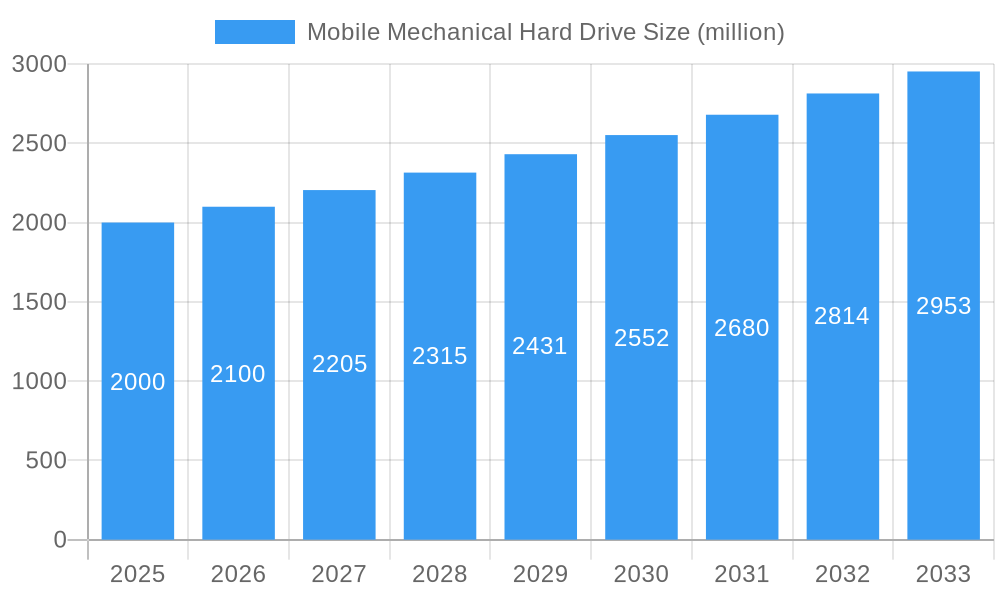
The mobile mechanical hard drive (MMHD) market, while facing challenges from the rise of solid-state storage (SSD), continues to hold a niche position driven by its cost-effectiveness and high storage capacity. The market, estimated at $2 billion in 2025, exhibits a compound annual growth rate (CAGR) of 5%, primarily fueled by demand in surveillance systems, automotive applications, and certain industrial sectors where cost is a major factor and high storage density is critical. Key players such as Toshiba, Western Digital, Seagate, and others continue to innovate, offering solutions optimized for mobile applications, focusing on durability and power efficiency. However, the market faces constraints such as the increasing popularity of faster and more reliable SSDs, particularly in high-performance applications. This ongoing competition leads manufacturers to focus on niche market segments and specialized offerings like ruggedized drives for harsh environments. The forecast period of 2025-2033 suggests steady, albeit modest, growth, driven by continued demand in applications less sensitive to speed, where the cost-per-gigabyte advantage of MMHDs remains significant.
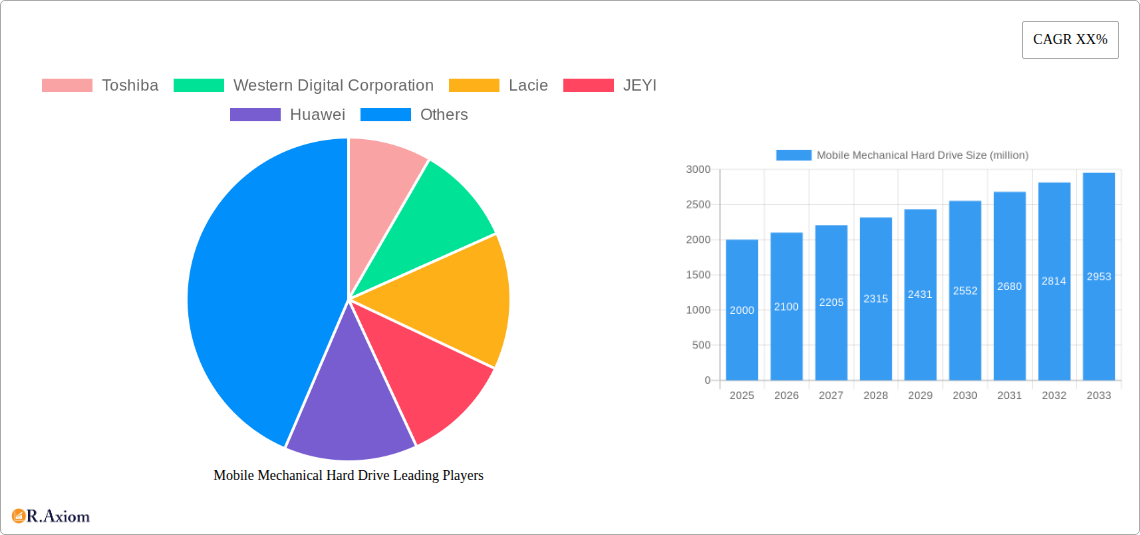
Mobile Mechanical Hard Drive Market Size (In Billion)
The segmentation of the MMHD market reveals diverse applications, each with specific requirements. For instance, the automotive sector demands drives with high vibration resistance and extended temperature tolerance. Similarly, surveillance systems prioritize large storage capacity for extended recording periods. Regional analysis indicates variations in market penetration; mature markets may see slower growth compared to emerging economies where increasing digitalization and infrastructural development spur demand. The competitive landscape is dynamic, with established players focusing on strategic partnerships and technological advancements to maintain their market share and cater to the evolving needs of specific segments. The future of MMHDs likely rests in catering to these specialized needs rather than competing directly with SSDs in high-performance applications.
Mobile Mechanical Hard Drive Company Market Share
Mobile Mechanical Hard Drive Market Report: 2019-2033
This comprehensive report provides an in-depth analysis of the global mobile mechanical hard drive market, offering invaluable insights for industry stakeholders, investors, and strategic decision-makers. The report covers the period from 2019 to 2033, with a focus on the forecast period of 2025-2033, using 2025 as the base year and estimated year. The market is valued at xx million USD in 2025 and is projected to reach xx million USD by 2033, exhibiting a Compound Annual Growth Rate (CAGR) of xx% during the forecast period. Key players analyzed include Toshiba, Western Digital Corporation, Lacie, JEYI, Huawei, Lenovo, Seagate Technology, Newsmy, Kesu, and Netac Technology.
Mobile Mechanical Hard Drive Market Concentration & Innovation
The mobile mechanical hard drive market exhibits a moderately concentrated landscape, with the top five players holding an estimated xx% market share in 2025. Seagate Technology and Western Digital Corporation are the dominant players, commanding a significant portion of the market. Innovation in this sector is driven by the need for increased storage capacity, improved energy efficiency, and enhanced durability for mobile applications. Regulatory frameworks, particularly those related to data privacy and environmental standards, are influencing product development and market dynamics. The emergence of solid-state drives (SSDs) presents a significant substitute, impacting market growth. However, the relatively lower cost of mechanical hard drives continues to fuel demand, particularly in price-sensitive segments. Recent M&A activities have been relatively limited in this mature market, with deal values estimated at xx million USD in the last five years. End-user trends indicate a preference for higher storage capacity devices, especially for multimedia storage and data backup.
Mobile Mechanical Hard Drive Industry Trends & Insights
The mobile mechanical hard drive market is experiencing moderate growth, driven primarily by the expanding demand for data storage in various mobile applications. The CAGR for the forecast period (2025-2033) is estimated at xx%, with market penetration reaching xx% by 2033. Technological disruptions, such as the rise of cloud storage and SSDs, are posing challenges. However, the cost advantage of mechanical hard drives continues to maintain their relevance, particularly in applications where high storage capacity is prioritized over speed. Consumer preferences are shifting towards smaller, lighter, and more energy-efficient devices. Competitive dynamics are largely driven by pricing strategies, product differentiation (based on capacity, durability, and features), and brand recognition. The increasing adoption of mobile devices across various demographics is a key growth driver. The market exhibits regional variations in growth rates and adoption patterns due to economic factors and technological infrastructure development.
Dominant Markets & Segments in Mobile Mechanical Hard Drive
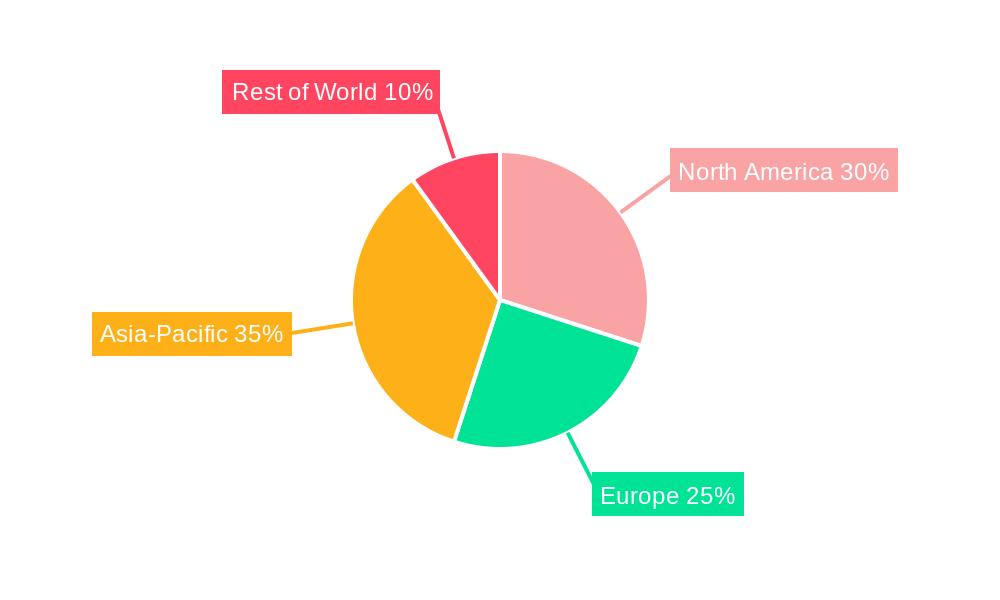
The Asia-Pacific region is currently the dominant market for mobile mechanical hard drives, accounting for xx% of the global market in 2025. This dominance is primarily attributed to:
- Rapid growth in mobile device adoption: The region is witnessing significant growth in smartphone and tablet usage, fueling the demand for portable storage solutions.
- Favorable economic conditions: The increasing disposable income and expanding middle class in several Asian countries are driving consumer electronics spending.
- Robust manufacturing ecosystem: A well-established electronics manufacturing infrastructure further supports the market's expansion.
The dominance of the Asia-Pacific region is expected to continue throughout the forecast period, although other regions are expected to exhibit moderate growth. China and India are the key contributing countries within the region. Detailed analysis reveals that the segment focused on xx dominates with a market share of xx% in 2025.
Mobile Mechanical Hard Drive Product Developments
Recent product innovations focus on increasing storage capacity while simultaneously reducing power consumption and improving shock resistance. Manufacturers are employing advanced technologies to enhance data transfer speeds and improve overall reliability. The emphasis is on creating cost-effective, compact, and ruggedized devices that can withstand the rigors of mobile use. These advancements cater to the growing demand for high-capacity, portable storage solutions across various applications, offering a competitive advantage in a market facing significant pressure from alternative storage technologies.
Report Scope & Segmentation Analysis
This report segments the mobile mechanical hard drive market based on capacity (e.g., 1TB, 2TB, 4TB, etc.), form factor (e.g., 2.5-inch, 3.5-inch), interface (e.g., SATA, USB), application (e.g., consumer electronics, enterprise), and region. Each segment's growth projections, market sizes, and competitive dynamics are extensively analyzed, highlighting the distinct opportunities and challenges within each category. The report provides detailed insights into the market share of each segment and its expected growth trajectory during the forecast period.
Key Drivers of Mobile Mechanical Hard Drive Growth
The growth of the mobile mechanical hard drive market is fueled by several factors: the continued increase in data generation from mobile devices; the demand for cost-effective mass storage solutions; and the ongoing expansion of the mobile computing market. Furthermore, advances in hard drive technology, such as increased storage densities and improved power efficiency, are contributing to the market's expansion. Government initiatives promoting digitalization in various sectors also present growth opportunities.
Challenges in the Mobile Mechanical Hard Drive Sector
The mobile mechanical hard drive sector faces several challenges, including the increasing competition from SSDs, which offer superior speed and durability; fluctuating raw material prices which directly impact production costs; and the growing importance of data security and privacy regulations. Supply chain disruptions and geopolitical instability could cause significant uncertainty in the market, impacting production capacity and pricing dynamics. This results in an estimated xx million USD loss annually in revenue for the industry.
Emerging Opportunities in Mobile Mechanical Hard Drive
Emerging opportunities lie in the development of energy-efficient, high-capacity, and robust devices. Growth is expected in niche applications like surveillance systems, industrial automation, and edge computing. The integration of advanced data management features and improved data security measures can further enhance market appeal. Exploring new markets in developing economies, focusing on affordable storage solutions, presents a significant avenue for growth.
Leading Players in the Mobile Mechanical Hard Drive Market
- Toshiba
- Western Digital Corporation
- Lacie
- JEYI
- Huawei
- Lenovo
- Seagate Technology
- Newsmy
- Kesu
- Netac Technology
Key Developments in Mobile Mechanical Hard Drive Industry
- January 2022: Seagate Technology launched a new line of high-capacity mobile hard drives with enhanced durability.
- March 2023: Western Digital Corporation announced a strategic partnership to develop advanced data storage technologies.
- June 2024: A major merger between two smaller players resulted in a significant consolidation of market share. (Further details unavailable - xx)
Strategic Outlook for Mobile Mechanical Hard Drive Market
The mobile mechanical hard drive market is poised for continued growth, although at a moderate pace, driven by persistent demand for cost-effective high-capacity storage in various mobile and portable applications. The market's long-term success will depend on the industry's ability to innovate and address the challenges posed by competing technologies while capitalizing on emerging opportunities in niche markets and developing economies. Focusing on energy efficiency, enhanced durability, and data security will be crucial for maintaining competitiveness.
Mobile Mechanical Hard Drive Segmentation
-
1. Application
- 1.1. Commercial Use
- 1.2. Private Use
-
2. Types
- 2.1. Usb3.0 Interface
- 2.2. Usb3.1 Interface
- 2.3. Type-C Interface
Mobile Mechanical Hard Drive Segmentation By Geography
-
1. North America
- 1.1. United States
- 1.2. Canada
- 1.3. Mexico
-
2. South America
- 2.1. Brazil
- 2.2. Argentina
- 2.3. Rest of South America
-
3. Europe
- 3.1. United Kingdom
- 3.2. Germany
- 3.3. France
- 3.4. Italy
- 3.5. Spain
- 3.6. Russia
- 3.7. Benelux
- 3.8. Nordics
- 3.9. Rest of Europe
-
4. Middle East & Africa
- 4.1. Turkey
- 4.2. Israel
- 4.3. GCC
- 4.4. North Africa
- 4.5. South Africa
- 4.6. Rest of Middle East & Africa
-
5. Asia Pacific
- 5.1. China
- 5.2. India
- 5.3. Japan
- 5.4. South Korea
- 5.5. ASEAN
- 5.6. Oceania
- 5.7. Rest of Asia Pacific
Mobile Mechanical Hard Drive Regional Market Share
Geographic Coverage of Mobile Mechanical Hard Drive
Mobile Mechanical Hard Drive REPORT HIGHLIGHTS
| Aspects | Details |
|---|---|
| Study Period | 2020-2034 |
| Base Year | 2025 |
| Estimated Year | 2026 |
| Forecast Period | 2026-2034 |
| Historical Period | 2020-2025 |
| Growth Rate | CAGR of XX% from 2020-2034 |
| Segmentation |
|
Table of Contents
- 1. Introduction
- 1.1. Research Scope
- 1.2. Market Segmentation
- 1.3. Research Objective
- 1.4. Definitions and Assumptions
- 2. Executive Summary
- 2.1. Market Snapshot
- 3. Market Dynamics
- 3.1. Market Drivers
- 3.2. Market Restrains
- 3.3. Market Trends
- 3.4. Market Opportunities
- 4. Market Factor Analysis
- 4.1. Porters Five Forces
- 4.1.1. Bargaining Power of Suppliers
- 4.1.2. Bargaining Power of Buyers
- 4.1.3. Threat of New Entrants
- 4.1.4. Threat of Substitutes
- 4.1.5. Competitive Rivalry
- 4.2. PESTEL analysis
- 4.3. BCG Analysis
- 4.3.1. Stars (High Growth, High Market Share)
- 4.3.2. Cash Cows (Low Growth, High Market Share)
- 4.3.3. Question Mark (High Growth, Low Market Share)
- 4.3.4. Dogs (Low Growth, Low Market Share)
- 4.4. Ansoff Matrix Analysis
- 4.5. Supply Chain Analysis
- 4.6. Regulatory Landscape
- 4.7. Current Market Potential and Opportunity Assessment (TAM–SAM–SOM Framework)
- 4.8. RAX Analyst Note
- 4.1. Porters Five Forces
- 5. Market Analysis, Insights and Forecast 2021-2033
- 5.1. Market Analysis, Insights and Forecast - by Application
- 5.1.1. Commercial Use
- 5.1.2. Private Use
- 5.2. Market Analysis, Insights and Forecast - by Types
- 5.2.1. Usb3.0 Interface
- 5.2.2. Usb3.1 Interface
- 5.2.3. Type-C Interface
- 5.3. Market Analysis, Insights and Forecast - by Region
- 5.3.1. North America
- 5.3.2. South America
- 5.3.3. Europe
- 5.3.4. Middle East & Africa
- 5.3.5. Asia Pacific
- 5.1. Market Analysis, Insights and Forecast - by Application
- 6. Global Mobile Mechanical Hard Drive Analysis, Insights and Forecast, 2021-2033
- 6.1. Market Analysis, Insights and Forecast - by Application
- 6.1.1. Commercial Use
- 6.1.2. Private Use
- 6.2. Market Analysis, Insights and Forecast - by Types
- 6.2.1. Usb3.0 Interface
- 6.2.2. Usb3.1 Interface
- 6.2.3. Type-C Interface
- 6.1. Market Analysis, Insights and Forecast - by Application
- 7. North America Mobile Mechanical Hard Drive Analysis, Insights and Forecast, 2020-2032
- 7.1. Market Analysis, Insights and Forecast - by Application
- 7.1.1. Commercial Use
- 7.1.2. Private Use
- 7.2. Market Analysis, Insights and Forecast - by Types
- 7.2.1. Usb3.0 Interface
- 7.2.2. Usb3.1 Interface
- 7.2.3. Type-C Interface
- 7.1. Market Analysis, Insights and Forecast - by Application
- 8. South America Mobile Mechanical Hard Drive Analysis, Insights and Forecast, 2020-2032
- 8.1. Market Analysis, Insights and Forecast - by Application
- 8.1.1. Commercial Use
- 8.1.2. Private Use
- 8.2. Market Analysis, Insights and Forecast - by Types
- 8.2.1. Usb3.0 Interface
- 8.2.2. Usb3.1 Interface
- 8.2.3. Type-C Interface
- 8.1. Market Analysis, Insights and Forecast - by Application
- 9. Europe Mobile Mechanical Hard Drive Analysis, Insights and Forecast, 2020-2032
- 9.1. Market Analysis, Insights and Forecast - by Application
- 9.1.1. Commercial Use
- 9.1.2. Private Use
- 9.2. Market Analysis, Insights and Forecast - by Types
- 9.2.1. Usb3.0 Interface
- 9.2.2. Usb3.1 Interface
- 9.2.3. Type-C Interface
- 9.1. Market Analysis, Insights and Forecast - by Application
- 10. Middle East & Africa Mobile Mechanical Hard Drive Analysis, Insights and Forecast, 2020-2032
- 10.1. Market Analysis, Insights and Forecast - by Application
- 10.1.1. Commercial Use
- 10.1.2. Private Use
- 10.2. Market Analysis, Insights and Forecast - by Types
- 10.2.1. Usb3.0 Interface
- 10.2.2. Usb3.1 Interface
- 10.2.3. Type-C Interface
- 10.1. Market Analysis, Insights and Forecast - by Application
- 11. Asia Pacific Mobile Mechanical Hard Drive Analysis, Insights and Forecast, 2020-2032
- 11.1. Market Analysis, Insights and Forecast - by Application
- 11.1.1. Commercial Use
- 11.1.2. Private Use
- 11.2. Market Analysis, Insights and Forecast - by Types
- 11.2.1. Usb3.0 Interface
- 11.2.2. Usb3.1 Interface
- 11.2.3. Type-C Interface
- 11.1. Market Analysis, Insights and Forecast - by Application
- 12. Competitive Analysis
- 12.1. Company Profiles
- 12.1.1 Toshiba
- 12.1.1.1. Company Overview
- 12.1.1.2. Products
- 12.1.1.3. Company Financials
- 12.1.1.4. SWOT Analysis
- 12.1.2 Western Digital Corporation
- 12.1.2.1. Company Overview
- 12.1.2.2. Products
- 12.1.2.3. Company Financials
- 12.1.2.4. SWOT Analysis
- 12.1.3 Lacie
- 12.1.3.1. Company Overview
- 12.1.3.2. Products
- 12.1.3.3. Company Financials
- 12.1.3.4. SWOT Analysis
- 12.1.4 JEYI
- 12.1.4.1. Company Overview
- 12.1.4.2. Products
- 12.1.4.3. Company Financials
- 12.1.4.4. SWOT Analysis
- 12.1.5 Huawei
- 12.1.5.1. Company Overview
- 12.1.5.2. Products
- 12.1.5.3. Company Financials
- 12.1.5.4. SWOT Analysis
- 12.1.6 Lenovo
- 12.1.6.1. Company Overview
- 12.1.6.2. Products
- 12.1.6.3. Company Financials
- 12.1.6.4. SWOT Analysis
- 12.1.7 Seagate Technology
- 12.1.7.1. Company Overview
- 12.1.7.2. Products
- 12.1.7.3. Company Financials
- 12.1.7.4. SWOT Analysis
- 12.1.8 Newsmy
- 12.1.8.1. Company Overview
- 12.1.8.2. Products
- 12.1.8.3. Company Financials
- 12.1.8.4. SWOT Analysis
- 12.1.9 Kesu
- 12.1.9.1. Company Overview
- 12.1.9.2. Products
- 12.1.9.3. Company Financials
- 12.1.9.4. SWOT Analysis
- 12.1.10 Netac Technology
- 12.1.10.1. Company Overview
- 12.1.10.2. Products
- 12.1.10.3. Company Financials
- 12.1.10.4. SWOT Analysis
- 12.1.1 Toshiba
- 12.2. Market Entropy
- 12.2.1 Company's Key Areas Served
- 12.2.2 Recent Developments
- 12.3. Company Market Share Analysis 2025
- 12.3.1 Top 5 Companies Market Share Analysis
- 12.3.2 Top 3 Companies Market Share Analysis
- 12.4. List of Potential Customers
- 13. Research Methodology
List of Figures
- Figure 1: Global Mobile Mechanical Hard Drive Revenue Breakdown (million, %) by Region 2025 & 2033
- Figure 2: Global Mobile Mechanical Hard Drive Volume Breakdown (K, %) by Region 2025 & 2033
- Figure 3: North America Mobile Mechanical Hard Drive Revenue (million), by Application 2025 & 2033
- Figure 4: North America Mobile Mechanical Hard Drive Volume (K), by Application 2025 & 2033
- Figure 5: North America Mobile Mechanical Hard Drive Revenue Share (%), by Application 2025 & 2033
- Figure 6: North America Mobile Mechanical Hard Drive Volume Share (%), by Application 2025 & 2033
- Figure 7: North America Mobile Mechanical Hard Drive Revenue (million), by Types 2025 & 2033
- Figure 8: North America Mobile Mechanical Hard Drive Volume (K), by Types 2025 & 2033
- Figure 9: North America Mobile Mechanical Hard Drive Revenue Share (%), by Types 2025 & 2033
- Figure 10: North America Mobile Mechanical Hard Drive Volume Share (%), by Types 2025 & 2033
- Figure 11: North America Mobile Mechanical Hard Drive Revenue (million), by Country 2025 & 2033
- Figure 12: North America Mobile Mechanical Hard Drive Volume (K), by Country 2025 & 2033
- Figure 13: North America Mobile Mechanical Hard Drive Revenue Share (%), by Country 2025 & 2033
- Figure 14: North America Mobile Mechanical Hard Drive Volume Share (%), by Country 2025 & 2033
- Figure 15: South America Mobile Mechanical Hard Drive Revenue (million), by Application 2025 & 2033
- Figure 16: South America Mobile Mechanical Hard Drive Volume (K), by Application 2025 & 2033
- Figure 17: South America Mobile Mechanical Hard Drive Revenue Share (%), by Application 2025 & 2033
- Figure 18: South America Mobile Mechanical Hard Drive Volume Share (%), by Application 2025 & 2033
- Figure 19: South America Mobile Mechanical Hard Drive Revenue (million), by Types 2025 & 2033
- Figure 20: South America Mobile Mechanical Hard Drive Volume (K), by Types 2025 & 2033
- Figure 21: South America Mobile Mechanical Hard Drive Revenue Share (%), by Types 2025 & 2033
- Figure 22: South America Mobile Mechanical Hard Drive Volume Share (%), by Types 2025 & 2033
- Figure 23: South America Mobile Mechanical Hard Drive Revenue (million), by Country 2025 & 2033
- Figure 24: South America Mobile Mechanical Hard Drive Volume (K), by Country 2025 & 2033
- Figure 25: South America Mobile Mechanical Hard Drive Revenue Share (%), by Country 2025 & 2033
- Figure 26: South America Mobile Mechanical Hard Drive Volume Share (%), by Country 2025 & 2033
- Figure 27: Europe Mobile Mechanical Hard Drive Revenue (million), by Application 2025 & 2033
- Figure 28: Europe Mobile Mechanical Hard Drive Volume (K), by Application 2025 & 2033
- Figure 29: Europe Mobile Mechanical Hard Drive Revenue Share (%), by Application 2025 & 2033
- Figure 30: Europe Mobile Mechanical Hard Drive Volume Share (%), by Application 2025 & 2033
- Figure 31: Europe Mobile Mechanical Hard Drive Revenue (million), by Types 2025 & 2033
- Figure 32: Europe Mobile Mechanical Hard Drive Volume (K), by Types 2025 & 2033
- Figure 33: Europe Mobile Mechanical Hard Drive Revenue Share (%), by Types 2025 & 2033
- Figure 34: Europe Mobile Mechanical Hard Drive Volume Share (%), by Types 2025 & 2033
- Figure 35: Europe Mobile Mechanical Hard Drive Revenue (million), by Country 2025 & 2033
- Figure 36: Europe Mobile Mechanical Hard Drive Volume (K), by Country 2025 & 2033
- Figure 37: Europe Mobile Mechanical Hard Drive Revenue Share (%), by Country 2025 & 2033
- Figure 38: Europe Mobile Mechanical Hard Drive Volume Share (%), by Country 2025 & 2033
- Figure 39: Middle East & Africa Mobile Mechanical Hard Drive Revenue (million), by Application 2025 & 2033
- Figure 40: Middle East & Africa Mobile Mechanical Hard Drive Volume (K), by Application 2025 & 2033
- Figure 41: Middle East & Africa Mobile Mechanical Hard Drive Revenue Share (%), by Application 2025 & 2033
- Figure 42: Middle East & Africa Mobile Mechanical Hard Drive Volume Share (%), by Application 2025 & 2033
- Figure 43: Middle East & Africa Mobile Mechanical Hard Drive Revenue (million), by Types 2025 & 2033
- Figure 44: Middle East & Africa Mobile Mechanical Hard Drive Volume (K), by Types 2025 & 2033
- Figure 45: Middle East & Africa Mobile Mechanical Hard Drive Revenue Share (%), by Types 2025 & 2033
- Figure 46: Middle East & Africa Mobile Mechanical Hard Drive Volume Share (%), by Types 2025 & 2033
- Figure 47: Middle East & Africa Mobile Mechanical Hard Drive Revenue (million), by Country 2025 & 2033
- Figure 48: Middle East & Africa Mobile Mechanical Hard Drive Volume (K), by Country 2025 & 2033
- Figure 49: Middle East & Africa Mobile Mechanical Hard Drive Revenue Share (%), by Country 2025 & 2033
- Figure 50: Middle East & Africa Mobile Mechanical Hard Drive Volume Share (%), by Country 2025 & 2033
- Figure 51: Asia Pacific Mobile Mechanical Hard Drive Revenue (million), by Application 2025 & 2033
- Figure 52: Asia Pacific Mobile Mechanical Hard Drive Volume (K), by Application 2025 & 2033
- Figure 53: Asia Pacific Mobile Mechanical Hard Drive Revenue Share (%), by Application 2025 & 2033
- Figure 54: Asia Pacific Mobile Mechanical Hard Drive Volume Share (%), by Application 2025 & 2033
- Figure 55: Asia Pacific Mobile Mechanical Hard Drive Revenue (million), by Types 2025 & 2033
- Figure 56: Asia Pacific Mobile Mechanical Hard Drive Volume (K), by Types 2025 & 2033
- Figure 57: Asia Pacific Mobile Mechanical Hard Drive Revenue Share (%), by Types 2025 & 2033
- Figure 58: Asia Pacific Mobile Mechanical Hard Drive Volume Share (%), by Types 2025 & 2033
- Figure 59: Asia Pacific Mobile Mechanical Hard Drive Revenue (million), by Country 2025 & 2033
- Figure 60: Asia Pacific Mobile Mechanical Hard Drive Volume (K), by Country 2025 & 2033
- Figure 61: Asia Pacific Mobile Mechanical Hard Drive Revenue Share (%), by Country 2025 & 2033
- Figure 62: Asia Pacific Mobile Mechanical Hard Drive Volume Share (%), by Country 2025 & 2033
List of Tables
- Table 1: Global Mobile Mechanical Hard Drive Revenue million Forecast, by Application 2020 & 2033
- Table 2: Global Mobile Mechanical Hard Drive Volume K Forecast, by Application 2020 & 2033
- Table 3: Global Mobile Mechanical Hard Drive Revenue million Forecast, by Types 2020 & 2033
- Table 4: Global Mobile Mechanical Hard Drive Volume K Forecast, by Types 2020 & 2033
- Table 5: Global Mobile Mechanical Hard Drive Revenue million Forecast, by Region 2020 & 2033
- Table 6: Global Mobile Mechanical Hard Drive Volume K Forecast, by Region 2020 & 2033
- Table 7: Global Mobile Mechanical Hard Drive Revenue million Forecast, by Application 2020 & 2033
- Table 8: Global Mobile Mechanical Hard Drive Volume K Forecast, by Application 2020 & 2033
- Table 9: Global Mobile Mechanical Hard Drive Revenue million Forecast, by Types 2020 & 2033
- Table 10: Global Mobile Mechanical Hard Drive Volume K Forecast, by Types 2020 & 2033
- Table 11: Global Mobile Mechanical Hard Drive Revenue million Forecast, by Country 2020 & 2033
- Table 12: Global Mobile Mechanical Hard Drive Volume K Forecast, by Country 2020 & 2033
- Table 13: United States Mobile Mechanical Hard Drive Revenue (million) Forecast, by Application 2020 & 2033
- Table 14: United States Mobile Mechanical Hard Drive Volume (K) Forecast, by Application 2020 & 2033
- Table 15: Canada Mobile Mechanical Hard Drive Revenue (million) Forecast, by Application 2020 & 2033
- Table 16: Canada Mobile Mechanical Hard Drive Volume (K) Forecast, by Application 2020 & 2033
- Table 17: Mexico Mobile Mechanical Hard Drive Revenue (million) Forecast, by Application 2020 & 2033
- Table 18: Mexico Mobile Mechanical Hard Drive Volume (K) Forecast, by Application 2020 & 2033
- Table 19: Global Mobile Mechanical Hard Drive Revenue million Forecast, by Application 2020 & 2033
- Table 20: Global Mobile Mechanical Hard Drive Volume K Forecast, by Application 2020 & 2033
- Table 21: Global Mobile Mechanical Hard Drive Revenue million Forecast, by Types 2020 & 2033
- Table 22: Global Mobile Mechanical Hard Drive Volume K Forecast, by Types 2020 & 2033
- Table 23: Global Mobile Mechanical Hard Drive Revenue million Forecast, by Country 2020 & 2033
- Table 24: Global Mobile Mechanical Hard Drive Volume K Forecast, by Country 2020 & 2033
- Table 25: Brazil Mobile Mechanical Hard Drive Revenue (million) Forecast, by Application 2020 & 2033
- Table 26: Brazil Mobile Mechanical Hard Drive Volume (K) Forecast, by Application 2020 & 2033
- Table 27: Argentina Mobile Mechanical Hard Drive Revenue (million) Forecast, by Application 2020 & 2033
- Table 28: Argentina Mobile Mechanical Hard Drive Volume (K) Forecast, by Application 2020 & 2033
- Table 29: Rest of South America Mobile Mechanical Hard Drive Revenue (million) Forecast, by Application 2020 & 2033
- Table 30: Rest of South America Mobile Mechanical Hard Drive Volume (K) Forecast, by Application 2020 & 2033
- Table 31: Global Mobile Mechanical Hard Drive Revenue million Forecast, by Application 2020 & 2033
- Table 32: Global Mobile Mechanical Hard Drive Volume K Forecast, by Application 2020 & 2033
- Table 33: Global Mobile Mechanical Hard Drive Revenue million Forecast, by Types 2020 & 2033
- Table 34: Global Mobile Mechanical Hard Drive Volume K Forecast, by Types 2020 & 2033
- Table 35: Global Mobile Mechanical Hard Drive Revenue million Forecast, by Country 2020 & 2033
- Table 36: Global Mobile Mechanical Hard Drive Volume K Forecast, by Country 2020 & 2033
- Table 37: United Kingdom Mobile Mechanical Hard Drive Revenue (million) Forecast, by Application 2020 & 2033
- Table 38: United Kingdom Mobile Mechanical Hard Drive Volume (K) Forecast, by Application 2020 & 2033
- Table 39: Germany Mobile Mechanical Hard Drive Revenue (million) Forecast, by Application 2020 & 2033
- Table 40: Germany Mobile Mechanical Hard Drive Volume (K) Forecast, by Application 2020 & 2033
- Table 41: France Mobile Mechanical Hard Drive Revenue (million) Forecast, by Application 2020 & 2033
- Table 42: France Mobile Mechanical Hard Drive Volume (K) Forecast, by Application 2020 & 2033
- Table 43: Italy Mobile Mechanical Hard Drive Revenue (million) Forecast, by Application 2020 & 2033
- Table 44: Italy Mobile Mechanical Hard Drive Volume (K) Forecast, by Application 2020 & 2033
- Table 45: Spain Mobile Mechanical Hard Drive Revenue (million) Forecast, by Application 2020 & 2033
- Table 46: Spain Mobile Mechanical Hard Drive Volume (K) Forecast, by Application 2020 & 2033
- Table 47: Russia Mobile Mechanical Hard Drive Revenue (million) Forecast, by Application 2020 & 2033
- Table 48: Russia Mobile Mechanical Hard Drive Volume (K) Forecast, by Application 2020 & 2033
- Table 49: Benelux Mobile Mechanical Hard Drive Revenue (million) Forecast, by Application 2020 & 2033
- Table 50: Benelux Mobile Mechanical Hard Drive Volume (K) Forecast, by Application 2020 & 2033
- Table 51: Nordics Mobile Mechanical Hard Drive Revenue (million) Forecast, by Application 2020 & 2033
- Table 52: Nordics Mobile Mechanical Hard Drive Volume (K) Forecast, by Application 2020 & 2033
- Table 53: Rest of Europe Mobile Mechanical Hard Drive Revenue (million) Forecast, by Application 2020 & 2033
- Table 54: Rest of Europe Mobile Mechanical Hard Drive Volume (K) Forecast, by Application 2020 & 2033
- Table 55: Global Mobile Mechanical Hard Drive Revenue million Forecast, by Application 2020 & 2033
- Table 56: Global Mobile Mechanical Hard Drive Volume K Forecast, by Application 2020 & 2033
- Table 57: Global Mobile Mechanical Hard Drive Revenue million Forecast, by Types 2020 & 2033
- Table 58: Global Mobile Mechanical Hard Drive Volume K Forecast, by Types 2020 & 2033
- Table 59: Global Mobile Mechanical Hard Drive Revenue million Forecast, by Country 2020 & 2033
- Table 60: Global Mobile Mechanical Hard Drive Volume K Forecast, by Country 2020 & 2033
- Table 61: Turkey Mobile Mechanical Hard Drive Revenue (million) Forecast, by Application 2020 & 2033
- Table 62: Turkey Mobile Mechanical Hard Drive Volume (K) Forecast, by Application 2020 & 2033
- Table 63: Israel Mobile Mechanical Hard Drive Revenue (million) Forecast, by Application 2020 & 2033
- Table 64: Israel Mobile Mechanical Hard Drive Volume (K) Forecast, by Application 2020 & 2033
- Table 65: GCC Mobile Mechanical Hard Drive Revenue (million) Forecast, by Application 2020 & 2033
- Table 66: GCC Mobile Mechanical Hard Drive Volume (K) Forecast, by Application 2020 & 2033
- Table 67: North Africa Mobile Mechanical Hard Drive Revenue (million) Forecast, by Application 2020 & 2033
- Table 68: North Africa Mobile Mechanical Hard Drive Volume (K) Forecast, by Application 2020 & 2033
- Table 69: South Africa Mobile Mechanical Hard Drive Revenue (million) Forecast, by Application 2020 & 2033
- Table 70: South Africa Mobile Mechanical Hard Drive Volume (K) Forecast, by Application 2020 & 2033
- Table 71: Rest of Middle East & Africa Mobile Mechanical Hard Drive Revenue (million) Forecast, by Application 2020 & 2033
- Table 72: Rest of Middle East & Africa Mobile Mechanical Hard Drive Volume (K) Forecast, by Application 2020 & 2033
- Table 73: Global Mobile Mechanical Hard Drive Revenue million Forecast, by Application 2020 & 2033
- Table 74: Global Mobile Mechanical Hard Drive Volume K Forecast, by Application 2020 & 2033
- Table 75: Global Mobile Mechanical Hard Drive Revenue million Forecast, by Types 2020 & 2033
- Table 76: Global Mobile Mechanical Hard Drive Volume K Forecast, by Types 2020 & 2033
- Table 77: Global Mobile Mechanical Hard Drive Revenue million Forecast, by Country 2020 & 2033
- Table 78: Global Mobile Mechanical Hard Drive Volume K Forecast, by Country 2020 & 2033
- Table 79: China Mobile Mechanical Hard Drive Revenue (million) Forecast, by Application 2020 & 2033
- Table 80: China Mobile Mechanical Hard Drive Volume (K) Forecast, by Application 2020 & 2033
- Table 81: India Mobile Mechanical Hard Drive Revenue (million) Forecast, by Application 2020 & 2033
- Table 82: India Mobile Mechanical Hard Drive Volume (K) Forecast, by Application 2020 & 2033
- Table 83: Japan Mobile Mechanical Hard Drive Revenue (million) Forecast, by Application 2020 & 2033
- Table 84: Japan Mobile Mechanical Hard Drive Volume (K) Forecast, by Application 2020 & 2033
- Table 85: South Korea Mobile Mechanical Hard Drive Revenue (million) Forecast, by Application 2020 & 2033
- Table 86: South Korea Mobile Mechanical Hard Drive Volume (K) Forecast, by Application 2020 & 2033
- Table 87: ASEAN Mobile Mechanical Hard Drive Revenue (million) Forecast, by Application 2020 & 2033
- Table 88: ASEAN Mobile Mechanical Hard Drive Volume (K) Forecast, by Application 2020 & 2033
- Table 89: Oceania Mobile Mechanical Hard Drive Revenue (million) Forecast, by Application 2020 & 2033
- Table 90: Oceania Mobile Mechanical Hard Drive Volume (K) Forecast, by Application 2020 & 2033
- Table 91: Rest of Asia Pacific Mobile Mechanical Hard Drive Revenue (million) Forecast, by Application 2020 & 2033
- Table 92: Rest of Asia Pacific Mobile Mechanical Hard Drive Volume (K) Forecast, by Application 2020 & 2033
Frequently Asked Questions
1. What is the projected Compound Annual Growth Rate (CAGR) of the Mobile Mechanical Hard Drive?
The projected CAGR is approximately XX%.
2. Which companies are prominent players in the Mobile Mechanical Hard Drive?
Key companies in the market include Toshiba, Western Digital Corporation, Lacie, JEYI, Huawei, Lenovo, Seagate Technology, Newsmy, Kesu, Netac Technology.
3. What are the main segments of the Mobile Mechanical Hard Drive?
The market segments include Application, Types.
4. Can you provide details about the market size?
The market size is estimated to be USD XXX million as of 2022.
5. What are some drivers contributing to market growth?
N/A
6. What are the notable trends driving market growth?
N/A
7. Are there any restraints impacting market growth?
N/A
8. Can you provide examples of recent developments in the market?
N/A
9. What pricing options are available for accessing the report?
Pricing options include single-user, multi-user, and enterprise licenses priced at USD 3350.00, USD 5025.00, and USD 6700.00 respectively.
10. Is the market size provided in terms of value or volume?
The market size is provided in terms of value, measured in million and volume, measured in K.
11. Are there any specific market keywords associated with the report?
Yes, the market keyword associated with the report is "Mobile Mechanical Hard Drive," which aids in identifying and referencing the specific market segment covered.
12. How do I determine which pricing option suits my needs best?
The pricing options vary based on user requirements and access needs. Individual users may opt for single-user licenses, while businesses requiring broader access may choose multi-user or enterprise licenses for cost-effective access to the report.
13. Are there any additional resources or data provided in the Mobile Mechanical Hard Drive report?
While the report offers comprehensive insights, it's advisable to review the specific contents or supplementary materials provided to ascertain if additional resources or data are available.
14. How can I stay updated on further developments or reports in the Mobile Mechanical Hard Drive?
To stay informed about further developments, trends, and reports in the Mobile Mechanical Hard Drive, consider subscribing to industry newsletters, following relevant companies and organizations, or regularly checking reputable industry news sources and publications.
Methodology
Step 1 - Identification of Relevant Samples Size from Population Database


Step 2 - Approaches for Defining Global Market Size (Value, Volume* & Price*)

Note*: In applicable scenarios
Step 3 - Data Sources
Primary Research
- Web Analytics
- Survey Reports
- Research Institute
- Latest Research Reports
- Opinion Leaders
Secondary Research
- Annual Reports
- White Paper
- Latest Press Release
- Industry Association
- Paid Database
- Investor Presentations

Step 4 - Data Triangulation
Involves using different sources of information in order to increase the validity of a study
These sources are likely to be stakeholders in a program - participants, other researchers, program staff, other community members, and so on.
Then we put all data in single framework & apply various statistical tools to find out the dynamic on the market.
During the analysis stage, feedback from the stakeholder groups would be compared to determine areas of agreement as well as areas of divergence