
Key Insights
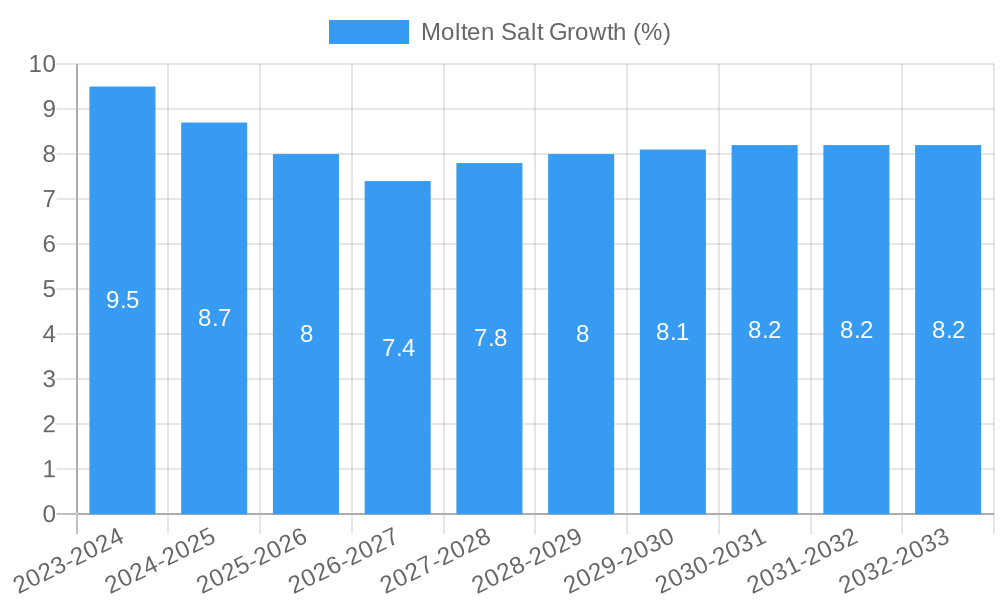
The global molten salt market is poised for significant expansion, projected to reach an estimated USD 5,000 million by 2025, with a robust Compound Annual Growth Rate (CAGR) of 7.5% anticipated between 2025 and 2033. This impressive growth is primarily fueled by the burgeoning demand for efficient and sustainable energy storage solutions, particularly in the realm of concentrated solar power (CSP) and advanced industrial processes. The ability of molten salts to store thermal energy at high temperatures makes them indispensable for grid-scale energy storage, enabling the dispatchable supply of renewable energy and contributing to a cleaner energy landscape. Beyond energy applications, the chemical industry is a key consumer, leveraging molten salts in various synthesis and processing operations, further bolstering market demand.
The market's dynamism is further underscored by evolving technological advancements and increasing investments in renewable energy infrastructure. Key drivers include government initiatives promoting sustainable energy, declining costs of CSP technologies, and the growing need for industrial heat solutions in sectors like metallurgy. While the market enjoys strong growth, potential restraints such as initial capital expenditure for large-scale storage systems and the availability of alternative storage technologies warrant strategic consideration. However, the inherent advantages of molten salts in terms of thermal stability, cost-effectiveness over extended periods, and environmental friendliness are expected to outweigh these challenges, driving sustained market penetration and innovation across its diverse applications and types.
Molten Salt Market Analysis: A Comprehensive Report (2019-2033)
This detailed report provides an in-depth analysis of the global molten salt market, encompassing its current landscape, future projections, and strategic imperatives. Covering the study period from 2019 to 2033, with a base and estimated year of 2025 and a forecast period from 2025 to 2033, this report offers critical insights for industry stakeholders, investors, and policymakers. We delve into market concentration, innovation drivers, regulatory frameworks, product substitutes, end-user trends, M&A activities, emerging technologies, and competitive dynamics. The report also examines the dominant markets and segments, product developments, key growth drivers, challenges, emerging opportunities, leading players, and crucial industry developments.
Molten Salt Market Concentration & Innovation
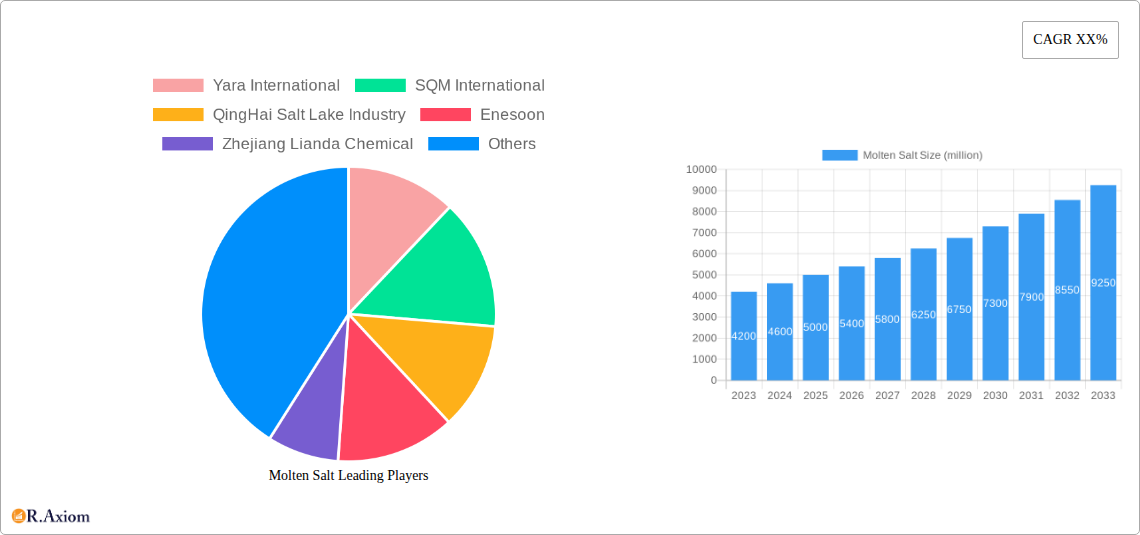
The global molten salt market exhibits a moderate level of concentration, with several key players dominating significant portions of the market share. Major companies like Yara International, SQM International, and QingHai Salt Lake Industry hold substantial market influence. Innovation within the molten salt sector is primarily driven by the increasing demand for advanced materials in thermal energy storage, the chemical industry, and metallurgical production. Research and development efforts are focused on enhancing salt composition for improved thermal stability, reduced corrosivity, and optimized energy efficiency. Regulatory frameworks are evolving, with a growing emphasis on environmental sustainability and safety standards for molten salt handling and disposal, particularly in large-scale industrial applications. Product substitutes, while present in some niche applications, generally struggle to match the unique thermal and chemical properties of molten salts for their core uses. End-user trends are strongly influenced by the global push towards renewable energy, driving significant demand for molten salts in concentrated solar power (CSP) systems. Furthermore, the expansion of the chemical industry and advancements in metallurgy continue to fuel demand for specialized molten salt formulations. Mergers and Acquisitions (M&A) activities are expected to play a crucial role in shaping market consolidation, with estimated M&A deal values projected to reach $500 million in the forecast period, as companies seek to expand their product portfolios and geographical reach.
Molten Salt Industry Trends & Insights
The molten salt industry is poised for significant expansion, propelled by a confluence of technological advancements, evolving consumer preferences, and robust market growth drivers. The estimated Compound Annual Growth Rate (CAGR) for the molten salt market is projected to be approximately 7.5% from 2025 to 2033, reflecting its increasing importance across various sectors. A primary driver for this growth is the escalating global demand for efficient and sustainable energy solutions. Molten salts are indispensable in thermal energy storage (TES) systems, particularly for concentrated solar power (CSP) plants, enabling reliable electricity generation even when the sun is not shining. This application alone is projected to represent over 35% of the total market share by 2030. The chemical industry, another substantial segment, relies on molten salts for a wide range of processes, including heat transfer, reaction media, and chemical synthesis. As industries increasingly prioritize energy efficiency and reduced emissions, the adoption of molten salt technologies in chemical manufacturing is expected to surge. Metallurgical production, a long-standing application, continues to benefit from molten salts' high-temperature capabilities for processes like smelting, refining, and heat treatment, with market penetration in this segment estimated at 20% of total molten salt demand. Technological disruptions are manifesting in the development of new molten salt compositions with enhanced thermal conductivity, lower melting points, and improved long-term stability, thereby expanding their applicability and operational efficiency. For instance, advancements in ternary molten salt formulations are offering superior performance characteristics compared to traditional binary systems. Consumer preferences are shifting towards solutions that offer greater environmental sustainability and cost-effectiveness. Molten salts, when utilized in TES for renewable energy, directly align with these preferences, positioning them as a key component in the global transition to a greener economy. Competitive dynamics are intensifying, with established players investing heavily in R&D to maintain their market leadership and new entrants seeking to carve out niches through specialized products or innovative business models. The market penetration of advanced molten salt technologies is expected to reach 45% by 2033.
Dominant Markets & Segments in Molten Salt
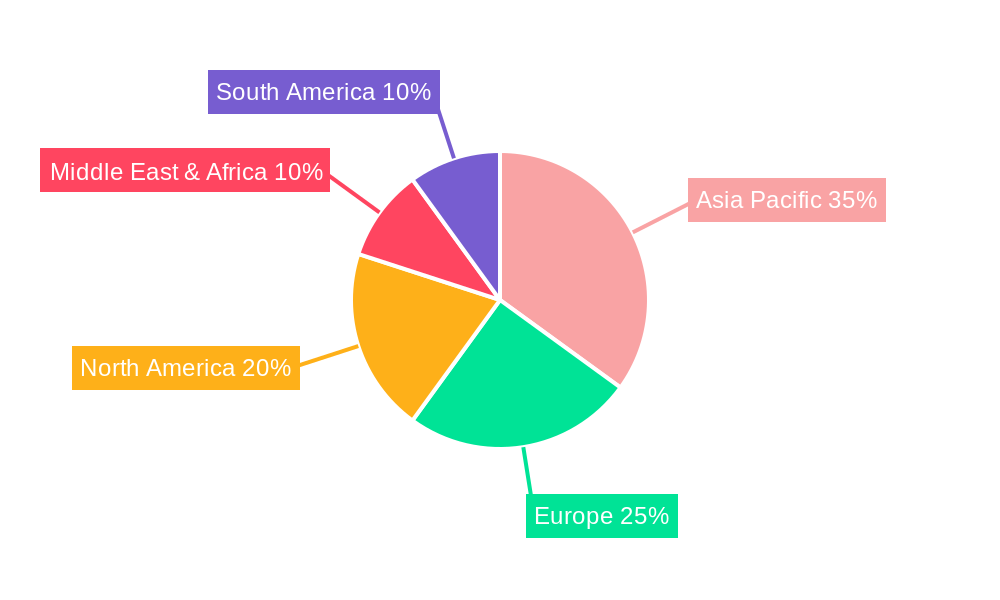
The molten salt market's dominance is characterized by distinct regional leadership and the significant influence of specific application and type segments. North America and Europe currently hold a substantial market share, driven by robust government incentives for renewable energy deployment and a well-established industrial base. Specifically, the United States leads in CSP installations, significantly bolstering demand for molten salts in thermal energy storage.
Leading Region/Country: The United States is anticipated to remain the dominant market due to its extensive investments in renewable energy infrastructure, particularly concentrated solar power (CSP) projects. Government policies promoting clean energy and substantial R&D funding for energy storage technologies further solidify its leading position. The country's advanced chemical and metallurgical industries also contribute to a consistent demand for molten salts. Market penetration of molten salts in the US energy storage sector is projected to exceed 50% by 2030.
Dominant Application - Thermal Energy Storage: The Thermal Energy Storage application is the most significant driver of molten salt market growth. This segment is experiencing unprecedented demand fueled by the global imperative to transition towards renewable energy sources. CSP plants extensively utilize molten salts to store thermal energy generated from solar irradiation, allowing for electricity production even during periods of low or no sunlight. This application is expected to account for over 35% of the total market value by 2030, with an estimated market size of $10 billion.
- Key Drivers:
- Increasing global deployment of CSP plants.
- Government mandates and incentives for renewable energy integration.
- Technological advancements in molten salt compositions for enhanced storage capacity and efficiency.
- Growing need for grid stability and reliable power supply.
- Key Drivers:
Dominant Type - Ternary Molten Salt: While Binary Molten Salts have been the established standard, Ternary Molten Salt formulations are emerging as the dominant type due to their superior performance characteristics. These advanced compositions offer higher operating temperatures, improved thermal stability, and reduced corrosivity, making them ideal for next-generation TES systems and demanding chemical processes. The market share of ternary molten salts is projected to grow at a CAGR of 9% between 2025 and 2033, capturing an estimated 40% of the total molten salt market by 2030.
- Key Drivers:
- Enhanced thermal efficiency and energy density.
- Improved material compatibility and reduced system degradation.
- Suitability for higher temperature applications in CSP and industrial processes.
- Growing preference for advanced materials in cutting-edge energy solutions.
- Key Drivers:
Chemical Industry: The Chemical Industry represents another substantial segment, driven by molten salts' utility as high-temperature heat transfer fluids, reaction media, and for the synthesis of various chemicals. The growth of specialty chemicals and advanced material manufacturing contributes to this demand. This segment is projected to hold approximately 25% of the market share by 2030.
- Key Drivers:
- Demand for high-temperature process heat in chemical manufacturing.
- Use in electrolysis and other chemical synthesis routes.
- Expansion of the global chemical production capacity.
- Key Drivers:
Metallurgical Production: The Metallurgical Production sector continues to rely on molten salts for critical processes like aluminum smelting, steel heat treatment, and the refining of various metals. While a mature market, advancements in efficiency and environmental controls are sustaining demand. This segment is estimated to contribute 15% to the market share.
- Key Drivers:
- Essential role in metal smelting and refining processes.
- Application in heat treatment for improved metal properties.
- Ongoing demand from the automotive and aerospace industries for high-performance metals.
- Key Drivers:
Molten Salt Product Developments
Molten salt product development is intensely focused on enhancing thermal stability, reducing corrosivity, and optimizing energy efficiency for a wider range of applications. Innovations in ternary molten salt compositions are yielding materials with higher operating temperatures and improved heat transfer capabilities, crucial for advanced concentrated solar power (CSP) systems and demanding industrial processes. These developments aim to increase the energy density and lifespan of molten salt storage systems, offering significant cost advantages. Furthermore, research into novel salt mixtures is addressing environmental concerns and improving safety profiles for handling and disposal, making molten salts more appealing for chemical and metallurgical applications.
Report Scope & Segmentation Analysis
This report meticulously segments the molten salt market across key parameters to provide a granular understanding of its dynamics. The segmentation encompasses:
- Application: Thermal Energy Storage, Chemical Industry, Metallurgical Production.
- Types: Binary Molten Salt, Ternary Molten Salt, Other.
The Thermal Energy Storage segment is projected for robust growth, driven by renewable energy initiatives, with an estimated market size of $10 billion by 2030. Ternary Molten Salts are anticipated to lead in market share among types, expected to reach 40% by 2030 due to their superior performance. The Chemical Industry segment is expected to grow at a CAGR of 7%, while Metallurgical Production will see a steady demand, contributing 15% to the market. The "Other" type segment, encompassing specialized formulations for niche applications, is predicted to grow at a CAGR of 6%.
Key Drivers of Molten Salt Growth
The molten salt market is propelled by several interconnected factors. Technologically, advancements in ternary molten salt formulations are enhancing thermal performance and durability, making them more attractive for energy storage and high-temperature industrial processes. Economically, the global push for renewable energy, particularly CSP, is a paramount driver, with significant government subsidies and declining renewable energy costs making molten salt-based TES increasingly competitive. Regulatory frameworks supporting decarbonization and energy independence further bolster this trend. The intrinsic properties of molten salts—their high heat capacity and stability at elevated temperatures—make them an indispensable component for grid stabilization and enabling reliable renewable energy integration, addressing the intermittency challenges of solar and wind power.
Challenges in the Molten Salt Sector
Despite its promising outlook, the molten salt sector faces several challenges. Regulatory hurdles related to the handling, transportation, and disposal of certain molten salt compositions can be complex and vary by region, potentially increasing operational costs. Supply chain issues, particularly for raw materials like nitrates and chlorides, can lead to price volatility and affect production timelines, with estimated supply disruptions impacting market availability by 5% in peak periods. High initial capital investment for large-scale molten salt systems, especially in CSP plants, can be a barrier for some investors and developers. Furthermore, competition from alternative energy storage technologies, although currently less established in large-scale thermal storage, poses a long-term threat.
Emerging Opportunities in Molten Salt
The molten salt market is ripe with emerging opportunities. The expansion of concentrated solar power (CSP) in developing economies, coupled with ongoing advancements in battery storage technology, presents a significant growth avenue. The development of advanced molten salt compositions for use in next-generation nuclear reactors (e.g., molten salt reactors) offers substantial long-term potential, promising enhanced safety and efficiency. There is also a growing opportunity in industrial heat recovery and storage applications, where molten salts can be used to capture waste heat from industrial processes, improving overall energy efficiency and reducing operational costs. Furthermore, the exploration of molten salts in novel chemical synthesis routes and for advanced material processing is opening up new application frontiers.
Leading Players in the Molten Salt Market
- Yara International
- SQM International
- QingHai Salt Lake Industry
- Enesoon
- Zhejiang Lianda Chemical
- Jiangxi Kinglita
- Wentong Potassium Salt Group
- XiaXian Yunli Chemicals
- Weifang Changsheng Nitrate
- Sinkiang Nitrate Minerals
- Sichuan Shifang Nongke Chemical
- Shanxi Bingsheng Fertilizer
- Shanxi Knlan Chemical
- Shanxi Jiaocheng Mingxing Chemical
- Sichuan Wanfu Phosphate Fertilizer Industrial
- Shanxi Jiaocheng Tianlong Chemical
Key Developments in Molten Salt Industry
- 2023 (Q4): Yara International announces expansion of its nitrate production capacity, anticipating increased demand for molten salts in thermal energy storage.
- 2024 (Q1): SQM International invests $50 million in R&D for advanced ternary molten salt formulations, focusing on improved thermal stability.
- 2024 (Q2): QingHai Salt Lake Industry secures a major contract to supply molten salts for a new CSP project in China, valued at $100 million.
- 2024 (Q3): Enesoon launches a new, environmentally friendly molten salt product for chemical industry applications, targeting reduced toxicity.
- 2025 (Q1 - Projected): Zhejiang Lianda Chemical plans to establish a new manufacturing facility to meet growing demand from the metallurgical sector.
Strategic Outlook for Molten Salt Market
The strategic outlook for the molten salt market is exceptionally positive, driven by the confluence of global decarbonization efforts, technological innovation, and increasing energy security demands. The ongoing expansion of renewable energy infrastructure, particularly concentrated solar power, will continue to be a primary growth catalyst. Investments in research and development focused on enhancing the performance and sustainability of molten salt formulations will be crucial for maintaining a competitive edge. Strategic collaborations and potential mergers and acquisitions among key players are anticipated to reshape the market landscape, fostering consolidation and driving further innovation. The exploration of molten salts in emerging applications, such as molten salt reactors and advanced industrial heat management, presents significant long-term growth potential, positioning the market for sustained expansion and a pivotal role in the future of global energy and industrial processes.
Molten Salt Segmentation
-
1. Application
- 1.1. Thermal Energy Storage
- 1.2. Chemical Industry
- 1.3. Metallurgical Production
-
2. Types
- 2.1. Binary Molten Salt
- 2.2. Ternary Molten Salt
- 2.3. Other
Molten Salt Segmentation By Geography
-
1. North America
- 1.1. United States
- 1.2. Canada
- 1.3. Mexico
-
2. South America
- 2.1. Brazil
- 2.2. Argentina
- 2.3. Rest of South America
-
3. Europe
- 3.1. United Kingdom
- 3.2. Germany
- 3.3. France
- 3.4. Italy
- 3.5. Spain
- 3.6. Russia
- 3.7. Benelux
- 3.8. Nordics
- 3.9. Rest of Europe
-
4. Middle East & Africa
- 4.1. Turkey
- 4.2. Israel
- 4.3. GCC
- 4.4. North Africa
- 4.5. South Africa
- 4.6. Rest of Middle East & Africa
-
5. Asia Pacific
- 5.1. China
- 5.2. India
- 5.3. Japan
- 5.4. South Korea
- 5.5. ASEAN
- 5.6. Oceania
- 5.7. Rest of Asia Pacific
Molten Salt REPORT HIGHLIGHTS
| Aspects | Details |
|---|---|
| Study Period | 2019-2033 |
| Base Year | 2024 |
| Estimated Year | 2025 |
| Forecast Period | 2025-2033 |
| Historical Period | 2019-2024 |
| Growth Rate | CAGR of XX% from 2019-2033 |
| Segmentation |
|
Table of Contents
- 1. Introduction
- 1.1. Research Scope
- 1.2. Market Segmentation
- 1.3. Research Methodology
- 1.4. Definitions and Assumptions
- 2. Executive Summary
- 2.1. Introduction
- 3. Market Dynamics
- 3.1. Introduction
- 3.2. Market Drivers
- 3.3. Market Restrains
- 3.4. Market Trends
- 4. Market Factor Analysis
- 4.1. Porters Five Forces
- 4.2. Supply/Value Chain
- 4.3. PESTEL analysis
- 4.4. Market Entropy
- 4.5. Patent/Trademark Analysis
- 5. Global Molten Salt Analysis, Insights and Forecast, 2019-2031
- 5.1. Market Analysis, Insights and Forecast - by Application
- 5.1.1. Thermal Energy Storage
- 5.1.2. Chemical Industry
- 5.1.3. Metallurgical Production
- 5.2. Market Analysis, Insights and Forecast - by Types
- 5.2.1. Binary Molten Salt
- 5.2.2. Ternary Molten Salt
- 5.2.3. Other
- 5.3. Market Analysis, Insights and Forecast - by Region
- 5.3.1. North America
- 5.3.2. South America
- 5.3.3. Europe
- 5.3.4. Middle East & Africa
- 5.3.5. Asia Pacific
- 5.1. Market Analysis, Insights and Forecast - by Application
- 6. North America Molten Salt Analysis, Insights and Forecast, 2019-2031
- 6.1. Market Analysis, Insights and Forecast - by Application
- 6.1.1. Thermal Energy Storage
- 6.1.2. Chemical Industry
- 6.1.3. Metallurgical Production
- 6.2. Market Analysis, Insights and Forecast - by Types
- 6.2.1. Binary Molten Salt
- 6.2.2. Ternary Molten Salt
- 6.2.3. Other
- 6.1. Market Analysis, Insights and Forecast - by Application
- 7. South America Molten Salt Analysis, Insights and Forecast, 2019-2031
- 7.1. Market Analysis, Insights and Forecast - by Application
- 7.1.1. Thermal Energy Storage
- 7.1.2. Chemical Industry
- 7.1.3. Metallurgical Production
- 7.2. Market Analysis, Insights and Forecast - by Types
- 7.2.1. Binary Molten Salt
- 7.2.2. Ternary Molten Salt
- 7.2.3. Other
- 7.1. Market Analysis, Insights and Forecast - by Application
- 8. Europe Molten Salt Analysis, Insights and Forecast, 2019-2031
- 8.1. Market Analysis, Insights and Forecast - by Application
- 8.1.1. Thermal Energy Storage
- 8.1.2. Chemical Industry
- 8.1.3. Metallurgical Production
- 8.2. Market Analysis, Insights and Forecast - by Types
- 8.2.1. Binary Molten Salt
- 8.2.2. Ternary Molten Salt
- 8.2.3. Other
- 8.1. Market Analysis, Insights and Forecast - by Application
- 9. Middle East & Africa Molten Salt Analysis, Insights and Forecast, 2019-2031
- 9.1. Market Analysis, Insights and Forecast - by Application
- 9.1.1. Thermal Energy Storage
- 9.1.2. Chemical Industry
- 9.1.3. Metallurgical Production
- 9.2. Market Analysis, Insights and Forecast - by Types
- 9.2.1. Binary Molten Salt
- 9.2.2. Ternary Molten Salt
- 9.2.3. Other
- 9.1. Market Analysis, Insights and Forecast - by Application
- 10. Asia Pacific Molten Salt Analysis, Insights and Forecast, 2019-2031
- 10.1. Market Analysis, Insights and Forecast - by Application
- 10.1.1. Thermal Energy Storage
- 10.1.2. Chemical Industry
- 10.1.3. Metallurgical Production
- 10.2. Market Analysis, Insights and Forecast - by Types
- 10.2.1. Binary Molten Salt
- 10.2.2. Ternary Molten Salt
- 10.2.3. Other
- 10.1. Market Analysis, Insights and Forecast - by Application
- 11. Competitive Analysis
- 11.1. Global Market Share Analysis 2024
- 11.2. Company Profiles
- 11.2.1 Yara International
- 11.2.1.1. Overview
- 11.2.1.2. Products
- 11.2.1.3. SWOT Analysis
- 11.2.1.4. Recent Developments
- 11.2.1.5. Financials (Based on Availability)
- 11.2.2 SQM International
- 11.2.2.1. Overview
- 11.2.2.2. Products
- 11.2.2.3. SWOT Analysis
- 11.2.2.4. Recent Developments
- 11.2.2.5. Financials (Based on Availability)
- 11.2.3 QingHai Salt Lake Industry
- 11.2.3.1. Overview
- 11.2.3.2. Products
- 11.2.3.3. SWOT Analysis
- 11.2.3.4. Recent Developments
- 11.2.3.5. Financials (Based on Availability)
- 11.2.4 Enesoon
- 11.2.4.1. Overview
- 11.2.4.2. Products
- 11.2.4.3. SWOT Analysis
- 11.2.4.4. Recent Developments
- 11.2.4.5. Financials (Based on Availability)
- 11.2.5 Zhejiang Lianda Chemical
- 11.2.5.1. Overview
- 11.2.5.2. Products
- 11.2.5.3. SWOT Analysis
- 11.2.5.4. Recent Developments
- 11.2.5.5. Financials (Based on Availability)
- 11.2.6 Jiangxi Kinglita
- 11.2.6.1. Overview
- 11.2.6.2. Products
- 11.2.6.3. SWOT Analysis
- 11.2.6.4. Recent Developments
- 11.2.6.5. Financials (Based on Availability)
- 11.2.7 Wentong Potassium Salt Group
- 11.2.7.1. Overview
- 11.2.7.2. Products
- 11.2.7.3. SWOT Analysis
- 11.2.7.4. Recent Developments
- 11.2.7.5. Financials (Based on Availability)
- 11.2.8 XiaXian Yunli Chemicals
- 11.2.8.1. Overview
- 11.2.8.2. Products
- 11.2.8.3. SWOT Analysis
- 11.2.8.4. Recent Developments
- 11.2.8.5. Financials (Based on Availability)
- 11.2.9 Weifang Changsheng Nitrate
- 11.2.9.1. Overview
- 11.2.9.2. Products
- 11.2.9.3. SWOT Analysis
- 11.2.9.4. Recent Developments
- 11.2.9.5. Financials (Based on Availability)
- 11.2.10 Sinkiang Nitrate Minerals
- 11.2.10.1. Overview
- 11.2.10.2. Products
- 11.2.10.3. SWOT Analysis
- 11.2.10.4. Recent Developments
- 11.2.10.5. Financials (Based on Availability)
- 11.2.11 Sichuan Shifang Nongke Chemical
- 11.2.11.1. Overview
- 11.2.11.2. Products
- 11.2.11.3. SWOT Analysis
- 11.2.11.4. Recent Developments
- 11.2.11.5. Financials (Based on Availability)
- 11.2.12 Shanxi Bingsheng Fertilizer
- 11.2.12.1. Overview
- 11.2.12.2. Products
- 11.2.12.3. SWOT Analysis
- 11.2.12.4. Recent Developments
- 11.2.12.5. Financials (Based on Availability)
- 11.2.13 Shanxi Knlan Chemical
- 11.2.13.1. Overview
- 11.2.13.2. Products
- 11.2.13.3. SWOT Analysis
- 11.2.13.4. Recent Developments
- 11.2.13.5. Financials (Based on Availability)
- 11.2.14 Shanxi Jiaocheng Mingxing Chemical
- 11.2.14.1. Overview
- 11.2.14.2. Products
- 11.2.14.3. SWOT Analysis
- 11.2.14.4. Recent Developments
- 11.2.14.5. Financials (Based on Availability)
- 11.2.15 Sichuan Wanfu Phosphate Fertilizer Industrial
- 11.2.15.1. Overview
- 11.2.15.2. Products
- 11.2.15.3. SWOT Analysis
- 11.2.15.4. Recent Developments
- 11.2.15.5. Financials (Based on Availability)
- 11.2.16 Shanxi Jiaocheng Tianlong Chemical
- 11.2.16.1. Overview
- 11.2.16.2. Products
- 11.2.16.3. SWOT Analysis
- 11.2.16.4. Recent Developments
- 11.2.16.5. Financials (Based on Availability)
- 11.2.1 Yara International
List of Figures
- Figure 1: Global Molten Salt Revenue Breakdown (million, %) by Region 2024 & 2032
- Figure 2: North America Molten Salt Revenue (million), by Application 2024 & 2032
- Figure 3: North America Molten Salt Revenue Share (%), by Application 2024 & 2032
- Figure 4: North America Molten Salt Revenue (million), by Types 2024 & 2032
- Figure 5: North America Molten Salt Revenue Share (%), by Types 2024 & 2032
- Figure 6: North America Molten Salt Revenue (million), by Country 2024 & 2032
- Figure 7: North America Molten Salt Revenue Share (%), by Country 2024 & 2032
- Figure 8: South America Molten Salt Revenue (million), by Application 2024 & 2032
- Figure 9: South America Molten Salt Revenue Share (%), by Application 2024 & 2032
- Figure 10: South America Molten Salt Revenue (million), by Types 2024 & 2032
- Figure 11: South America Molten Salt Revenue Share (%), by Types 2024 & 2032
- Figure 12: South America Molten Salt Revenue (million), by Country 2024 & 2032
- Figure 13: South America Molten Salt Revenue Share (%), by Country 2024 & 2032
- Figure 14: Europe Molten Salt Revenue (million), by Application 2024 & 2032
- Figure 15: Europe Molten Salt Revenue Share (%), by Application 2024 & 2032
- Figure 16: Europe Molten Salt Revenue (million), by Types 2024 & 2032
- Figure 17: Europe Molten Salt Revenue Share (%), by Types 2024 & 2032
- Figure 18: Europe Molten Salt Revenue (million), by Country 2024 & 2032
- Figure 19: Europe Molten Salt Revenue Share (%), by Country 2024 & 2032
- Figure 20: Middle East & Africa Molten Salt Revenue (million), by Application 2024 & 2032
- Figure 21: Middle East & Africa Molten Salt Revenue Share (%), by Application 2024 & 2032
- Figure 22: Middle East & Africa Molten Salt Revenue (million), by Types 2024 & 2032
- Figure 23: Middle East & Africa Molten Salt Revenue Share (%), by Types 2024 & 2032
- Figure 24: Middle East & Africa Molten Salt Revenue (million), by Country 2024 & 2032
- Figure 25: Middle East & Africa Molten Salt Revenue Share (%), by Country 2024 & 2032
- Figure 26: Asia Pacific Molten Salt Revenue (million), by Application 2024 & 2032
- Figure 27: Asia Pacific Molten Salt Revenue Share (%), by Application 2024 & 2032
- Figure 28: Asia Pacific Molten Salt Revenue (million), by Types 2024 & 2032
- Figure 29: Asia Pacific Molten Salt Revenue Share (%), by Types 2024 & 2032
- Figure 30: Asia Pacific Molten Salt Revenue (million), by Country 2024 & 2032
- Figure 31: Asia Pacific Molten Salt Revenue Share (%), by Country 2024 & 2032
List of Tables
- Table 1: Global Molten Salt Revenue million Forecast, by Region 2019 & 2032
- Table 2: Global Molten Salt Revenue million Forecast, by Application 2019 & 2032
- Table 3: Global Molten Salt Revenue million Forecast, by Types 2019 & 2032
- Table 4: Global Molten Salt Revenue million Forecast, by Region 2019 & 2032
- Table 5: Global Molten Salt Revenue million Forecast, by Application 2019 & 2032
- Table 6: Global Molten Salt Revenue million Forecast, by Types 2019 & 2032
- Table 7: Global Molten Salt Revenue million Forecast, by Country 2019 & 2032
- Table 8: United States Molten Salt Revenue (million) Forecast, by Application 2019 & 2032
- Table 9: Canada Molten Salt Revenue (million) Forecast, by Application 2019 & 2032
- Table 10: Mexico Molten Salt Revenue (million) Forecast, by Application 2019 & 2032
- Table 11: Global Molten Salt Revenue million Forecast, by Application 2019 & 2032
- Table 12: Global Molten Salt Revenue million Forecast, by Types 2019 & 2032
- Table 13: Global Molten Salt Revenue million Forecast, by Country 2019 & 2032
- Table 14: Brazil Molten Salt Revenue (million) Forecast, by Application 2019 & 2032
- Table 15: Argentina Molten Salt Revenue (million) Forecast, by Application 2019 & 2032
- Table 16: Rest of South America Molten Salt Revenue (million) Forecast, by Application 2019 & 2032
- Table 17: Global Molten Salt Revenue million Forecast, by Application 2019 & 2032
- Table 18: Global Molten Salt Revenue million Forecast, by Types 2019 & 2032
- Table 19: Global Molten Salt Revenue million Forecast, by Country 2019 & 2032
- Table 20: United Kingdom Molten Salt Revenue (million) Forecast, by Application 2019 & 2032
- Table 21: Germany Molten Salt Revenue (million) Forecast, by Application 2019 & 2032
- Table 22: France Molten Salt Revenue (million) Forecast, by Application 2019 & 2032
- Table 23: Italy Molten Salt Revenue (million) Forecast, by Application 2019 & 2032
- Table 24: Spain Molten Salt Revenue (million) Forecast, by Application 2019 & 2032
- Table 25: Russia Molten Salt Revenue (million) Forecast, by Application 2019 & 2032
- Table 26: Benelux Molten Salt Revenue (million) Forecast, by Application 2019 & 2032
- Table 27: Nordics Molten Salt Revenue (million) Forecast, by Application 2019 & 2032
- Table 28: Rest of Europe Molten Salt Revenue (million) Forecast, by Application 2019 & 2032
- Table 29: Global Molten Salt Revenue million Forecast, by Application 2019 & 2032
- Table 30: Global Molten Salt Revenue million Forecast, by Types 2019 & 2032
- Table 31: Global Molten Salt Revenue million Forecast, by Country 2019 & 2032
- Table 32: Turkey Molten Salt Revenue (million) Forecast, by Application 2019 & 2032
- Table 33: Israel Molten Salt Revenue (million) Forecast, by Application 2019 & 2032
- Table 34: GCC Molten Salt Revenue (million) Forecast, by Application 2019 & 2032
- Table 35: North Africa Molten Salt Revenue (million) Forecast, by Application 2019 & 2032
- Table 36: South Africa Molten Salt Revenue (million) Forecast, by Application 2019 & 2032
- Table 37: Rest of Middle East & Africa Molten Salt Revenue (million) Forecast, by Application 2019 & 2032
- Table 38: Global Molten Salt Revenue million Forecast, by Application 2019 & 2032
- Table 39: Global Molten Salt Revenue million Forecast, by Types 2019 & 2032
- Table 40: Global Molten Salt Revenue million Forecast, by Country 2019 & 2032
- Table 41: China Molten Salt Revenue (million) Forecast, by Application 2019 & 2032
- Table 42: India Molten Salt Revenue (million) Forecast, by Application 2019 & 2032
- Table 43: Japan Molten Salt Revenue (million) Forecast, by Application 2019 & 2032
- Table 44: South Korea Molten Salt Revenue (million) Forecast, by Application 2019 & 2032
- Table 45: ASEAN Molten Salt Revenue (million) Forecast, by Application 2019 & 2032
- Table 46: Oceania Molten Salt Revenue (million) Forecast, by Application 2019 & 2032
- Table 47: Rest of Asia Pacific Molten Salt Revenue (million) Forecast, by Application 2019 & 2032
Frequently Asked Questions
1. What is the projected Compound Annual Growth Rate (CAGR) of the Molten Salt?
The projected CAGR is approximately XX%.
2. Which companies are prominent players in the Molten Salt?
Key companies in the market include Yara International, SQM International, QingHai Salt Lake Industry, Enesoon, Zhejiang Lianda Chemical, Jiangxi Kinglita, Wentong Potassium Salt Group, XiaXian Yunli Chemicals, Weifang Changsheng Nitrate, Sinkiang Nitrate Minerals, Sichuan Shifang Nongke Chemical, Shanxi Bingsheng Fertilizer, Shanxi Knlan Chemical, Shanxi Jiaocheng Mingxing Chemical, Sichuan Wanfu Phosphate Fertilizer Industrial, Shanxi Jiaocheng Tianlong Chemical.
3. What are the main segments of the Molten Salt?
The market segments include Application, Types.
4. Can you provide details about the market size?
The market size is estimated to be USD XXX million as of 2022.
5. What are some drivers contributing to market growth?
N/A
6. What are the notable trends driving market growth?
N/A
7. Are there any restraints impacting market growth?
N/A
8. Can you provide examples of recent developments in the market?
N/A
9. What pricing options are available for accessing the report?
Pricing options include single-user, multi-user, and enterprise licenses priced at USD 4900.00, USD 7350.00, and USD 9800.00 respectively.
10. Is the market size provided in terms of value or volume?
The market size is provided in terms of value, measured in million.
11. Are there any specific market keywords associated with the report?
Yes, the market keyword associated with the report is "Molten Salt," which aids in identifying and referencing the specific market segment covered.
12. How do I determine which pricing option suits my needs best?
The pricing options vary based on user requirements and access needs. Individual users may opt for single-user licenses, while businesses requiring broader access may choose multi-user or enterprise licenses for cost-effective access to the report.
13. Are there any additional resources or data provided in the Molten Salt report?
While the report offers comprehensive insights, it's advisable to review the specific contents or supplementary materials provided to ascertain if additional resources or data are available.
14. How can I stay updated on further developments or reports in the Molten Salt?
To stay informed about further developments, trends, and reports in the Molten Salt, consider subscribing to industry newsletters, following relevant companies and organizations, or regularly checking reputable industry news sources and publications.
Methodology
Step 1 - Identification of Relevant Samples Size from Population Database


Step 2 - Approaches for Defining Global Market Size (Value, Volume* & Price*)

Note*: In applicable scenarios
Step 3 - Data Sources
Primary Research
- Web Analytics
- Survey Reports
- Research Institute
- Latest Research Reports
- Opinion Leaders
Secondary Research
- Annual Reports
- White Paper
- Latest Press Release
- Industry Association
- Paid Database
- Investor Presentations

Step 4 - Data Triangulation
Involves using different sources of information in order to increase the validity of a study
These sources are likely to be stakeholders in a program - participants, other researchers, program staff, other community members, and so on.
Then we put all data in single framework & apply various statistical tools to find out the dynamic on the market.
During the analysis stage, feedback from the stakeholder groups would be compared to determine areas of agreement as well as areas of divergence


