

Key Insights
The global n-Hexane market is poised for robust growth, projected to reach a substantial market size of approximately USD 2.24 billion in 2025, with a compelling Compound Annual Growth Rate (CAGR) of 4.57% expected to propel it through the forecast period ending in 2033. This growth trajectory is underpinned by a confluence of dynamic market drivers, most notably the escalating demand for industrial solvents across a myriad of sectors. The automotive industry, for instance, relies heavily on n-Hexane for effective cleaning and degreasing processes during manufacturing and maintenance, while its critical role in the production of plastics and synthetic rubber further fuels its consumption. Furthermore, the expanding food processing industry, particularly in emerging economies, is a significant contributor, with n-Hexane serving as an indispensable edible oil extractant. The increasing global population and rising disposable incomes contribute to a greater demand for processed foods, thereby amplifying the need for n-Hexane in its extraction applications.
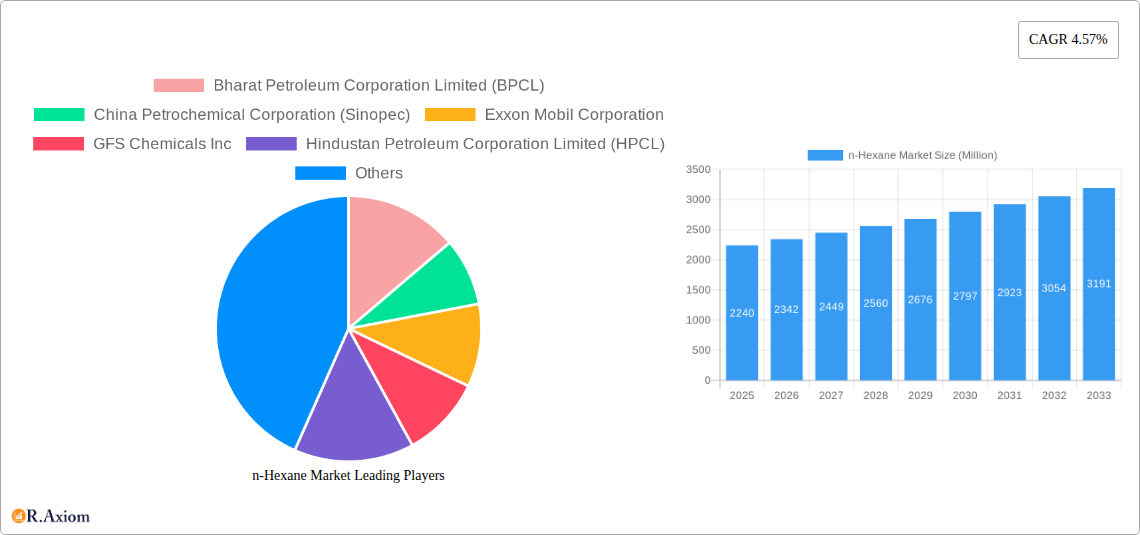
n-Hexane Market Market Size (In Billion)
The market's dynamism is further shaped by prevailing trends, including a growing emphasis on product purity and the development of specialized n-Hexane grades tailored for specific applications, such as polymer-grade and food-grade n-Hexane, which command premium pricing and cater to stringent industry standards. Innovations in production technologies aimed at improving efficiency and reducing environmental impact are also shaping the competitive landscape. However, the market is not without its challenges. Stringent environmental regulations concerning the handling and disposal of volatile organic compounds (VOCs) like n-Hexane represent a significant restraint, necessitating investments in advanced emission control technologies. Fluctuations in the prices of crude oil, the primary feedstock for n-Hexane production, can also impact profitability and market stability. Despite these restraints, the inherent utility and widespread applicability of n-Hexane across diverse industrial and consumer segments ensure its continued market relevance and expansion. The market is segmented by type into n-Hexane, Isohexane, and Neohexane, with n-Hexane holding the dominant share. By grade, Polymer Grade and Food Grade are key segments, alongside Other Grades. Applications are broadly categorized into Industrial Solvents, Edible Oil Extractant, Cleansing and Degreasing, and Other Applications.
n-Hexane Market Company Market Share
This report provides an in-depth analysis of the global n-Hexane market, offering critical insights into market dynamics, key trends, segmentation, and future outlook. The study covers a comprehensive historical period from 2019 to 2024, with a base year of 2025 and a detailed forecast extending to 2033. We analyze market concentration, innovation, regulatory frameworks, competitive landscapes, and emerging opportunities to empower industry stakeholders with actionable intelligence for strategic decision-making.
n-Hexane Market Market Concentration & Innovation
The n-Hexane market exhibits a moderate to high level of market concentration, with a few dominant players controlling a significant share of the global supply. Major companies like China Petrochemical Corporation (Sinopec), Exxon Mobil Corporation, Shell plc, and Indian Oil Corporation Ltd are key contributors to market volume and innovation. Innovation in the n-Hexane sector is primarily driven by the demand for higher purity grades, especially for polymer production and specialized solvent applications. Advances in refining processes and purification technologies are crucial for meeting stringent quality requirements. Regulatory frameworks, particularly concerning environmental impact and safety standards, play a pivotal role in shaping product development and market entry strategies. The search for more sustainable production methods and the potential for bio-based n-Hexane are also emerging innovation drivers. While direct product substitutes for n-Hexane in its core applications are limited, alternative extraction methods in the edible oil industry and the development of novel solvent blends for industrial cleaning present indirect competitive pressures. End-user trends are leaning towards increased demand for n-Hexane in emerging economies due to industrial expansion and growing food processing sectors. Mergers and acquisitions (M&A) activities, such as the March 2022 merger between Phillips 66 and Phillips 66 Partners, exemplify strategic consolidations aimed at expanding market reach and optimizing operational efficiencies. The total M&A deal value in the sector is estimated to be in the tens of millions of dollars annually, reflecting strategic investments in capacity expansion and market consolidation.
n-Hexane Market Industry Trends & Insights
The global n-Hexane market is poised for robust growth, driven by a confluence of factors that underscore its indispensable role across various industries. The estimated Compound Annual Growth Rate (CAGR) for the forecast period (2025-2033) is projected to be in the range of 4.5% to 5.5%. This sustained growth is largely attributed to the escalating demand from the edible oil extraction sector, where n-Hexane remains the preferred solvent due to its efficiency and cost-effectiveness. The increasing global population and rising disposable incomes in developing nations are fueling the demand for processed foods and cooking oils, thereby boosting the consumption of n-Hexane. Furthermore, the polymer industry, particularly the production of polyethylene and polypropylene, represents another significant growth driver. As the demand for plastics in packaging, automotive, and construction sectors continues to expand, so does the need for high-purity n-Hexane as a catalyst carrier and solvent. Technological advancements in n-Hexane production, including improved distillation techniques and enhanced purification processes, are enabling manufacturers to meet the increasingly stringent quality specifications demanded by these end-use industries. These advancements not only improve product quality but also contribute to more sustainable and energy-efficient production. Consumer preferences are indirectly influencing the market through regulatory pressures and a growing awareness of sustainable practices. This is leading to an increased focus on optimizing solvent recovery processes and exploring greener alternatives where feasible. Competitive dynamics are characterized by a blend of large, integrated petrochemical companies and smaller, specialized producers. Price volatility of crude oil, the primary feedstock for n-Hexane, can significantly impact market profitability. The market penetration of n-Hexane is already high in its established applications, with growth primarily stemming from increased volume demand in existing uses and expansion into new geographical markets. The ongoing industrialization in regions like Asia-Pacific and Latin America is creating significant opportunities for market expansion and increased consumption of n-Hexane.
Dominant Markets & Segments in n-Hexane Market
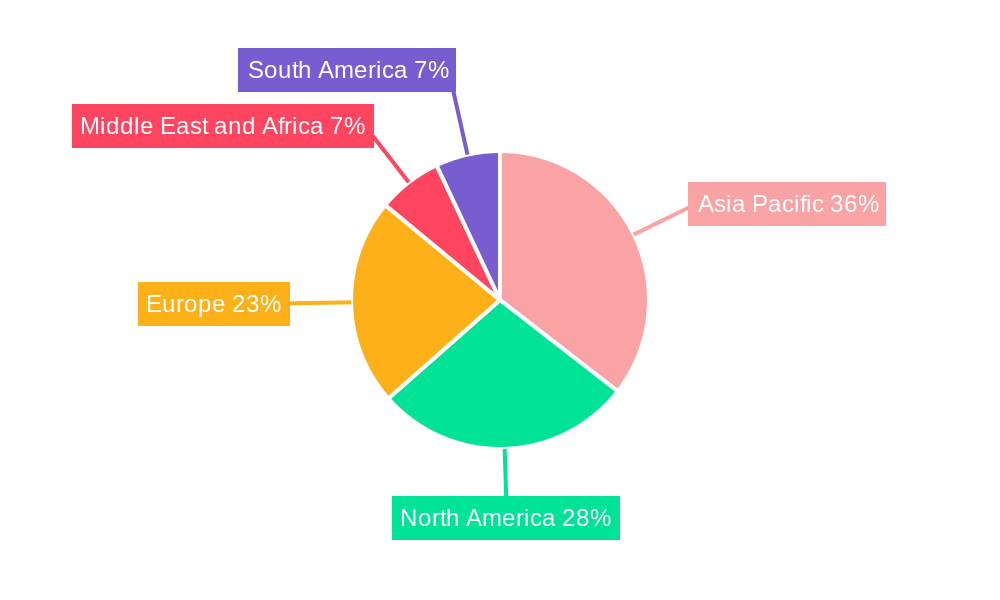
The global n-Hexane market is characterized by significant regional dominance and strong performance within specific product types, grades, and applications. Asia-Pacific stands out as the dominant region, driven by rapid industrialization, a burgeoning manufacturing sector, and a substantial presence of edible oil production facilities. Countries like China and India are at the forefront of this dominance, fueled by massive domestic demand and their roles as key global suppliers of processed food products. Economic policies supporting manufacturing growth, coupled with continuous infrastructure development, create a fertile ground for n-Hexane consumption.
Within the Type segmentation, n-Hexane itself commands the largest market share, accounting for an estimated 70% of the total market volume. Its widespread use as an industrial solvent and in edible oil extraction makes it the primary driver of market demand. Isohexane and Neohexane, while niche, are gaining traction due to their specialized applications in certain chemical syntheses and as octane enhancers in fuels, respectively.
The Grade segmentation reveals Polymer Grade n-Hexane as a leading segment. This is directly linked to the robust growth of the polyethylene and polypropylene industries, which require high-purity n-Hexane for polymerization processes. The demand for food-grade n-Hexane also remains significant, though subject to stricter regulatory oversight and an increasing preference for alternative extraction methods in some regions.
In terms of Application, Edible Oil Extractant and Industrial Solvents are the two most dominant segments. The edible oil industry's consistent demand, driven by global food consumption patterns, makes this a cornerstone application. Industrial solvents find widespread use in the manufacturing of adhesives, coatings, pharmaceuticals, and in cleaning and degreasing processes across various manufacturing sectors. The "Other Applications" segment, though smaller, encompasses niche uses in laboratories, chemical synthesis, and specialized cleaning formulations, contributing to the overall market diversity. Key drivers for this dominance include the cost-effectiveness of n-Hexane in these applications, established infrastructure for its use, and the lack of readily available, equally efficient alternatives on a large scale.
n-Hexane Market Product Developments
Product developments in the n-Hexane market are focused on enhancing purity, improving sustainability, and expanding application capabilities. Manufacturers are investing in advanced purification technologies to produce ultra-high purity n-Hexane grades, critical for sensitive applications like advanced polymer synthesis and pharmaceutical production. Innovations also target more environmentally friendly production processes, aiming to reduce energy consumption and minimize waste generation. The development of specialized n-Hexane blends for specific industrial cleaning and degreasing needs is another area of focus, offering tailored solutions to end-users. These advancements contribute to a stronger competitive advantage by meeting evolving industry standards and customer requirements for performance and sustainability.
Report Scope & Segmentation Analysis
This report encompasses a detailed analysis of the global n-Hexane market, segmented by Type, Grade, and Application. The Type segmentation includes n-Hexane, Isohexane, and Neohexane. The Grade segmentation covers Polymer Grade, Food Grade, and Other Grades. The Application segmentation includes Industrial Solvents, Edible Oil Extractant, Cleansing and Degreasing, and Other Applications. Each segment is analyzed for its market size, growth projections, and competitive dynamics. The n-Hexane segment is expected to dominate in terms of volume and value due to its widespread use. Polymer Grade n-Hexane is projected for significant growth, mirroring the expansion of the plastics industry. The Edible Oil Extractant application is anticipated to maintain a steady growth trajectory, supported by global food demand.
Key Drivers of n-Hexane Market Growth
The growth of the n-Hexane market is primarily propelled by the escalating demand from the edible oil extraction industry, driven by a growing global population and increasing consumption of processed foods. The expansion of the polymer industry, particularly for polyethylene and polypropylene, is another significant growth catalyst, as n-Hexane is a crucial component in their production. Industrialization and economic development in emerging economies, especially in Asia-Pacific and Latin America, are boosting the demand for n-Hexane as an industrial solvent in manufacturing and construction sectors. Technological advancements in refining and purification processes are enabling higher purity n-Hexane, catering to specialized and stringent application requirements. Furthermore, government initiatives supporting agricultural and food processing sectors in various regions indirectly contribute to market growth.
Challenges in the n-Hexane Market Sector
Despite robust growth prospects, the n-Hexane market faces several challenges. Price volatility of crude oil, the primary feedstock, significantly impacts production costs and market pricing, creating uncertainty for manufacturers and end-users. Stringent environmental regulations and growing concerns about the health and safety impacts of n-Hexane necessitate continuous investment in compliance and the exploration of greener alternatives. Supply chain disruptions, often exacerbated by geopolitical factors or logistical challenges, can affect the availability and price of n-Hexane. Intense competition among market players, including large petrochemical corporations and specialized producers, can lead to price pressures and margin erosion. The development of alternative extraction technologies in the edible oil sector, though currently niche, poses a potential long-term threat to traditional n-Hexane usage.
Emerging Opportunities in n-Hexane Market
Emerging opportunities in the n-Hexane market lie in the development of bio-based n-Hexane as a sustainable alternative, catering to increasing environmental consciousness and regulatory demands. The growing demand for high-purity n-Hexane in advanced chemical synthesis, pharmaceuticals, and electronics manufacturing presents a lucrative avenue for growth. Expansion into untapped or underserved geographical markets, particularly in developing regions with burgeoning industrial sectors, offers significant potential. Innovation in solvent recovery and recycling technologies can enhance the economic viability and environmental profile of n-Hexane usage. Furthermore, the exploration of new niche applications in specialty chemicals and advanced materials could unlock further market expansion.
Leading Players in the n-Hexane Market Market
- Bharat Petroleum Corporation Limited (BPCL)
- China Petrochemical Corporation (Sinopec)
- Exxon Mobil Corporation
- GFS Chemicals Inc
- Hindustan Petroleum Corporation Limited (HPCL)
- Indian Oil Corporation Ltd
- Jun Yuan Petroleum Group
- Liaoning Yufeng Chemical Co Ltd
- Phillips 66 Company
- Rompetrol
- Shell plc
- Shenyang Huifeng Petrochemical Co Ltd
- Sumitomo Chemical Co Ltd
- THAI OIL GROUP
Key Developments in n-Hexane Market Industry
- March 2022: Phillips 66 announced its merger with Phillips 66 Partners. The merger resulted in Phillips 66 acquiring all limited partnership interests in PSXP not already owned by Phillips 66 and its affiliates.
Strategic Outlook for n-Hexane Market Market
The strategic outlook for the n-Hexane market remains positive, driven by sustained demand from core applications and emerging opportunities. Companies are expected to focus on enhancing production efficiency, investing in advanced purification technologies to meet evolving quality standards, and exploring sustainable manufacturing practices. Strategic partnerships and M&A activities are likely to continue as players seek to consolidate market share and expand their geographical reach. The growing emphasis on green chemistry and bio-based alternatives will necessitate innovation in product development and production processes. Overall, the market is poised for continued growth, with a strong emphasis on technological advancement, regulatory compliance, and strategic market positioning to capitalize on evolving industry dynamics.
n-Hexane Market Segmentation
-
1. Type
- 1.1. n-Hexane
- 1.2. Isohexane
- 1.3. Neohexane
-
2. Grade
- 2.1. Polymer Grade
- 2.2. Food Grade
- 2.3. Other Grades
-
3. Application
- 3.1. Industrial Solvents
- 3.2. Edible Oil Extractant
- 3.3. Cleansing and Degreasing
- 3.4. Other Ap
n-Hexane Market Segmentation By Geography
-
1. Asia Pacific
- 1.1. China
- 1.2. India
- 1.3. Japan
- 1.4. South Korea
- 1.5. Malaysia
- 1.6. Thailand
- 1.7. Indonesia
- 1.8. Vietnam
- 1.9. Rest of Asia Pacific
-
2. North America
- 2.1. United States
- 2.2. Canada
- 2.3. Mexico
-
3. Europe
- 3.1. Germany
- 3.2. United Kingdom
- 3.3. Italy
- 3.4. France
- 3.5. Spain
- 3.6. NORDIC
- 3.7. Turkey
- 3.8. Russia
- 3.9. Rest of Europe
-
4. South America
- 4.1. Brazil
- 4.2. Argentina
- 4.3. Colombia
- 4.4. Rest of South America
-
5. Middle East and Africa
- 5.1. Saudi Arabia
- 5.2. South Africa
- 5.3. Nigeria
- 5.4. Qatar
- 5.5. Egypt
- 5.6. United Arab Emirates
- 5.7. Rest of Middle East and Africa
n-Hexane Market Regional Market Share
Geographic Coverage of n-Hexane Market
n-Hexane Market REPORT HIGHLIGHTS
| Aspects | Details |
|---|---|
| Study Period | 2020-2034 |
| Base Year | 2025 |
| Estimated Year | 2026 |
| Forecast Period | 2026-2034 |
| Historical Period | 2020-2025 |
| Growth Rate | CAGR of 4.57% from 2020-2034 |
| Segmentation |
|
Table of Contents
- 1. Introduction
- 1.1. Research Scope
- 1.2. Market Segmentation
- 1.3. Research Objective
- 1.4. Definitions and Assumptions
- 2. Executive Summary
- 2.1. Market Snapshot
- 3. Market Dynamics
- 3.1. Market Drivers
- 3.2. Market Restrains
- 3.3. Market Trends
- 3.4. Market Opportunities
- 4. Market Factor Analysis
- 4.1. Porters Five Forces
- 4.1.1. Bargaining Power of Suppliers
- 4.1.2. Bargaining Power of Buyers
- 4.1.3. Threat of New Entrants
- 4.1.4. Threat of Substitutes
- 4.1.5. Competitive Rivalry
- 4.2. PESTEL analysis
- 4.3. BCG Analysis
- 4.3.1. Stars (High Growth, High Market Share)
- 4.3.2. Cash Cows (Low Growth, High Market Share)
- 4.3.3. Question Mark (High Growth, Low Market Share)
- 4.3.4. Dogs (Low Growth, Low Market Share)
- 4.4. Ansoff Matrix Analysis
- 4.5. Supply Chain Analysis
- 4.6. Regulatory Landscape
- 4.7. Current Market Potential and Opportunity Assessment (TAM–SAM–SOM Framework)
- 4.8. RAX Analyst Note
- 4.1. Porters Five Forces
- 5. Market Analysis, Insights and Forecast 2021-2033
- 5.1. Market Analysis, Insights and Forecast - by Type
- 5.1.1. n-Hexane
- 5.1.2. Isohexane
- 5.1.3. Neohexane
- 5.2. Market Analysis, Insights and Forecast - by Grade
- 5.2.1. Polymer Grade
- 5.2.2. Food Grade
- 5.2.3. Other Grades
- 5.3. Market Analysis, Insights and Forecast - by Application
- 5.3.1. Industrial Solvents
- 5.3.2. Edible Oil Extractant
- 5.3.3. Cleansing and Degreasing
- 5.3.4. Other Ap
- 5.4. Market Analysis, Insights and Forecast - by Region
- 5.4.1. Asia Pacific
- 5.4.2. North America
- 5.4.3. Europe
- 5.4.4. South America
- 5.4.5. Middle East and Africa
- 5.1. Market Analysis, Insights and Forecast - by Type
- 6. Global n-Hexane Market Analysis, Insights and Forecast, 2021-2033
- 6.1. Market Analysis, Insights and Forecast - by Type
- 6.1.1. n-Hexane
- 6.1.2. Isohexane
- 6.1.3. Neohexane
- 6.2. Market Analysis, Insights and Forecast - by Grade
- 6.2.1. Polymer Grade
- 6.2.2. Food Grade
- 6.2.3. Other Grades
- 6.3. Market Analysis, Insights and Forecast - by Application
- 6.3.1. Industrial Solvents
- 6.3.2. Edible Oil Extractant
- 6.3.3. Cleansing and Degreasing
- 6.3.4. Other Ap
- 6.1. Market Analysis, Insights and Forecast - by Type
- 7. Asia Pacific n-Hexane Market Analysis, Insights and Forecast, 2020-2032
- 7.1. Market Analysis, Insights and Forecast - by Type
- 7.1.1. n-Hexane
- 7.1.2. Isohexane
- 7.1.3. Neohexane
- 7.2. Market Analysis, Insights and Forecast - by Grade
- 7.2.1. Polymer Grade
- 7.2.2. Food Grade
- 7.2.3. Other Grades
- 7.3. Market Analysis, Insights and Forecast - by Application
- 7.3.1. Industrial Solvents
- 7.3.2. Edible Oil Extractant
- 7.3.3. Cleansing and Degreasing
- 7.3.4. Other Ap
- 7.1. Market Analysis, Insights and Forecast - by Type
- 8. North America n-Hexane Market Analysis, Insights and Forecast, 2020-2032
- 8.1. Market Analysis, Insights and Forecast - by Type
- 8.1.1. n-Hexane
- 8.1.2. Isohexane
- 8.1.3. Neohexane
- 8.2. Market Analysis, Insights and Forecast - by Grade
- 8.2.1. Polymer Grade
- 8.2.2. Food Grade
- 8.2.3. Other Grades
- 8.3. Market Analysis, Insights and Forecast - by Application
- 8.3.1. Industrial Solvents
- 8.3.2. Edible Oil Extractant
- 8.3.3. Cleansing and Degreasing
- 8.3.4. Other Ap
- 8.1. Market Analysis, Insights and Forecast - by Type
- 9. Europe n-Hexane Market Analysis, Insights and Forecast, 2020-2032
- 9.1. Market Analysis, Insights and Forecast - by Type
- 9.1.1. n-Hexane
- 9.1.2. Isohexane
- 9.1.3. Neohexane
- 9.2. Market Analysis, Insights and Forecast - by Grade
- 9.2.1. Polymer Grade
- 9.2.2. Food Grade
- 9.2.3. Other Grades
- 9.3. Market Analysis, Insights and Forecast - by Application
- 9.3.1. Industrial Solvents
- 9.3.2. Edible Oil Extractant
- 9.3.3. Cleansing and Degreasing
- 9.3.4. Other Ap
- 9.1. Market Analysis, Insights and Forecast - by Type
- 10. South America n-Hexane Market Analysis, Insights and Forecast, 2020-2032
- 10.1. Market Analysis, Insights and Forecast - by Type
- 10.1.1. n-Hexane
- 10.1.2. Isohexane
- 10.1.3. Neohexane
- 10.2. Market Analysis, Insights and Forecast - by Grade
- 10.2.1. Polymer Grade
- 10.2.2. Food Grade
- 10.2.3. Other Grades
- 10.3. Market Analysis, Insights and Forecast - by Application
- 10.3.1. Industrial Solvents
- 10.3.2. Edible Oil Extractant
- 10.3.3. Cleansing and Degreasing
- 10.3.4. Other Ap
- 10.1. Market Analysis, Insights and Forecast - by Type
- 11. Middle East and Africa n-Hexane Market Analysis, Insights and Forecast, 2020-2032
- 11.1. Market Analysis, Insights and Forecast - by Type
- 11.1.1. n-Hexane
- 11.1.2. Isohexane
- 11.1.3. Neohexane
- 11.2. Market Analysis, Insights and Forecast - by Grade
- 11.2.1. Polymer Grade
- 11.2.2. Food Grade
- 11.2.3. Other Grades
- 11.3. Market Analysis, Insights and Forecast - by Application
- 11.3.1. Industrial Solvents
- 11.3.2. Edible Oil Extractant
- 11.3.3. Cleansing and Degreasing
- 11.3.4. Other Ap
- 11.1. Market Analysis, Insights and Forecast - by Type
- 12. Competitive Analysis
- 12.1. Company Profiles
- 12.1.1 Bharat Petroleum Corporation Limited (BPCL)
- 12.1.1.1. Company Overview
- 12.1.1.2. Products
- 12.1.1.3. Company Financials
- 12.1.1.4. SWOT Analysis
- 12.1.2 China Petrochemical Corporation (Sinopec)
- 12.1.2.1. Company Overview
- 12.1.2.2. Products
- 12.1.2.3. Company Financials
- 12.1.2.4. SWOT Analysis
- 12.1.3 Exxon Mobil Corporation
- 12.1.3.1. Company Overview
- 12.1.3.2. Products
- 12.1.3.3. Company Financials
- 12.1.3.4. SWOT Analysis
- 12.1.4 GFS Chemicals Inc
- 12.1.4.1. Company Overview
- 12.1.4.2. Products
- 12.1.4.3. Company Financials
- 12.1.4.4. SWOT Analysis
- 12.1.5 Hindustan Petroleum Corporation Limited (HPCL)
- 12.1.5.1. Company Overview
- 12.1.5.2. Products
- 12.1.5.3. Company Financials
- 12.1.5.4. SWOT Analysis
- 12.1.6 Indian Oil Corporation Ltd
- 12.1.6.1. Company Overview
- 12.1.6.2. Products
- 12.1.6.3. Company Financials
- 12.1.6.4. SWOT Analysis
- 12.1.7 Jun Yuan Petroleum Group
- 12.1.7.1. Company Overview
- 12.1.7.2. Products
- 12.1.7.3. Company Financials
- 12.1.7.4. SWOT Analysis
- 12.1.8 Liaoning Yufeng Chemical Co Ltd
- 12.1.8.1. Company Overview
- 12.1.8.2. Products
- 12.1.8.3. Company Financials
- 12.1.8.4. SWOT Analysis
- 12.1.9 Phillips 66 Company
- 12.1.9.1. Company Overview
- 12.1.9.2. Products
- 12.1.9.3. Company Financials
- 12.1.9.4. SWOT Analysis
- 12.1.10 Rompetrol
- 12.1.10.1. Company Overview
- 12.1.10.2. Products
- 12.1.10.3. Company Financials
- 12.1.10.4. SWOT Analysis
- 12.1.11 Shell plc
- 12.1.11.1. Company Overview
- 12.1.11.2. Products
- 12.1.11.3. Company Financials
- 12.1.11.4. SWOT Analysis
- 12.1.12 Shenyang Huifeng Petrochemical Co Ltd
- 12.1.12.1. Company Overview
- 12.1.12.2. Products
- 12.1.12.3. Company Financials
- 12.1.12.4. SWOT Analysis
- 12.1.13 Sumitomo Chemical Co Ltd
- 12.1.13.1. Company Overview
- 12.1.13.2. Products
- 12.1.13.3. Company Financials
- 12.1.13.4. SWOT Analysis
- 12.1.14 THAI OIL GROUP*List Not Exhaustive
- 12.1.14.1. Company Overview
- 12.1.14.2. Products
- 12.1.14.3. Company Financials
- 12.1.14.4. SWOT Analysis
- 12.1.1 Bharat Petroleum Corporation Limited (BPCL)
- 12.2. Market Entropy
- 12.2.1 Company's Key Areas Served
- 12.2.2 Recent Developments
- 12.3. Company Market Share Analysis 2025
- 12.3.1 Top 5 Companies Market Share Analysis
- 12.3.2 Top 3 Companies Market Share Analysis
- 12.4. List of Potential Customers
- 13. Research Methodology
List of Figures
- Figure 1: Global n-Hexane Market Revenue Breakdown (Million, %) by Region 2025 & 2033
- Figure 2: Global n-Hexane Market Volume Breakdown (Billion, %) by Region 2025 & 2033
- Figure 3: Asia Pacific n-Hexane Market Revenue (Million), by Type 2025 & 2033
- Figure 4: Asia Pacific n-Hexane Market Volume (Billion), by Type 2025 & 2033
- Figure 5: Asia Pacific n-Hexane Market Revenue Share (%), by Type 2025 & 2033
- Figure 6: Asia Pacific n-Hexane Market Volume Share (%), by Type 2025 & 2033
- Figure 7: Asia Pacific n-Hexane Market Revenue (Million), by Grade 2025 & 2033
- Figure 8: Asia Pacific n-Hexane Market Volume (Billion), by Grade 2025 & 2033
- Figure 9: Asia Pacific n-Hexane Market Revenue Share (%), by Grade 2025 & 2033
- Figure 10: Asia Pacific n-Hexane Market Volume Share (%), by Grade 2025 & 2033
- Figure 11: Asia Pacific n-Hexane Market Revenue (Million), by Application 2025 & 2033
- Figure 12: Asia Pacific n-Hexane Market Volume (Billion), by Application 2025 & 2033
- Figure 13: Asia Pacific n-Hexane Market Revenue Share (%), by Application 2025 & 2033
- Figure 14: Asia Pacific n-Hexane Market Volume Share (%), by Application 2025 & 2033
- Figure 15: Asia Pacific n-Hexane Market Revenue (Million), by Country 2025 & 2033
- Figure 16: Asia Pacific n-Hexane Market Volume (Billion), by Country 2025 & 2033
- Figure 17: Asia Pacific n-Hexane Market Revenue Share (%), by Country 2025 & 2033
- Figure 18: Asia Pacific n-Hexane Market Volume Share (%), by Country 2025 & 2033
- Figure 19: North America n-Hexane Market Revenue (Million), by Type 2025 & 2033
- Figure 20: North America n-Hexane Market Volume (Billion), by Type 2025 & 2033
- Figure 21: North America n-Hexane Market Revenue Share (%), by Type 2025 & 2033
- Figure 22: North America n-Hexane Market Volume Share (%), by Type 2025 & 2033
- Figure 23: North America n-Hexane Market Revenue (Million), by Grade 2025 & 2033
- Figure 24: North America n-Hexane Market Volume (Billion), by Grade 2025 & 2033
- Figure 25: North America n-Hexane Market Revenue Share (%), by Grade 2025 & 2033
- Figure 26: North America n-Hexane Market Volume Share (%), by Grade 2025 & 2033
- Figure 27: North America n-Hexane Market Revenue (Million), by Application 2025 & 2033
- Figure 28: North America n-Hexane Market Volume (Billion), by Application 2025 & 2033
- Figure 29: North America n-Hexane Market Revenue Share (%), by Application 2025 & 2033
- Figure 30: North America n-Hexane Market Volume Share (%), by Application 2025 & 2033
- Figure 31: North America n-Hexane Market Revenue (Million), by Country 2025 & 2033
- Figure 32: North America n-Hexane Market Volume (Billion), by Country 2025 & 2033
- Figure 33: North America n-Hexane Market Revenue Share (%), by Country 2025 & 2033
- Figure 34: North America n-Hexane Market Volume Share (%), by Country 2025 & 2033
- Figure 35: Europe n-Hexane Market Revenue (Million), by Type 2025 & 2033
- Figure 36: Europe n-Hexane Market Volume (Billion), by Type 2025 & 2033
- Figure 37: Europe n-Hexane Market Revenue Share (%), by Type 2025 & 2033
- Figure 38: Europe n-Hexane Market Volume Share (%), by Type 2025 & 2033
- Figure 39: Europe n-Hexane Market Revenue (Million), by Grade 2025 & 2033
- Figure 40: Europe n-Hexane Market Volume (Billion), by Grade 2025 & 2033
- Figure 41: Europe n-Hexane Market Revenue Share (%), by Grade 2025 & 2033
- Figure 42: Europe n-Hexane Market Volume Share (%), by Grade 2025 & 2033
- Figure 43: Europe n-Hexane Market Revenue (Million), by Application 2025 & 2033
- Figure 44: Europe n-Hexane Market Volume (Billion), by Application 2025 & 2033
- Figure 45: Europe n-Hexane Market Revenue Share (%), by Application 2025 & 2033
- Figure 46: Europe n-Hexane Market Volume Share (%), by Application 2025 & 2033
- Figure 47: Europe n-Hexane Market Revenue (Million), by Country 2025 & 2033
- Figure 48: Europe n-Hexane Market Volume (Billion), by Country 2025 & 2033
- Figure 49: Europe n-Hexane Market Revenue Share (%), by Country 2025 & 2033
- Figure 50: Europe n-Hexane Market Volume Share (%), by Country 2025 & 2033
- Figure 51: South America n-Hexane Market Revenue (Million), by Type 2025 & 2033
- Figure 52: South America n-Hexane Market Volume (Billion), by Type 2025 & 2033
- Figure 53: South America n-Hexane Market Revenue Share (%), by Type 2025 & 2033
- Figure 54: South America n-Hexane Market Volume Share (%), by Type 2025 & 2033
- Figure 55: South America n-Hexane Market Revenue (Million), by Grade 2025 & 2033
- Figure 56: South America n-Hexane Market Volume (Billion), by Grade 2025 & 2033
- Figure 57: South America n-Hexane Market Revenue Share (%), by Grade 2025 & 2033
- Figure 58: South America n-Hexane Market Volume Share (%), by Grade 2025 & 2033
- Figure 59: South America n-Hexane Market Revenue (Million), by Application 2025 & 2033
- Figure 60: South America n-Hexane Market Volume (Billion), by Application 2025 & 2033
- Figure 61: South America n-Hexane Market Revenue Share (%), by Application 2025 & 2033
- Figure 62: South America n-Hexane Market Volume Share (%), by Application 2025 & 2033
- Figure 63: South America n-Hexane Market Revenue (Million), by Country 2025 & 2033
- Figure 64: South America n-Hexane Market Volume (Billion), by Country 2025 & 2033
- Figure 65: South America n-Hexane Market Revenue Share (%), by Country 2025 & 2033
- Figure 66: South America n-Hexane Market Volume Share (%), by Country 2025 & 2033
- Figure 67: Middle East and Africa n-Hexane Market Revenue (Million), by Type 2025 & 2033
- Figure 68: Middle East and Africa n-Hexane Market Volume (Billion), by Type 2025 & 2033
- Figure 69: Middle East and Africa n-Hexane Market Revenue Share (%), by Type 2025 & 2033
- Figure 70: Middle East and Africa n-Hexane Market Volume Share (%), by Type 2025 & 2033
- Figure 71: Middle East and Africa n-Hexane Market Revenue (Million), by Grade 2025 & 2033
- Figure 72: Middle East and Africa n-Hexane Market Volume (Billion), by Grade 2025 & 2033
- Figure 73: Middle East and Africa n-Hexane Market Revenue Share (%), by Grade 2025 & 2033
- Figure 74: Middle East and Africa n-Hexane Market Volume Share (%), by Grade 2025 & 2033
- Figure 75: Middle East and Africa n-Hexane Market Revenue (Million), by Application 2025 & 2033
- Figure 76: Middle East and Africa n-Hexane Market Volume (Billion), by Application 2025 & 2033
- Figure 77: Middle East and Africa n-Hexane Market Revenue Share (%), by Application 2025 & 2033
- Figure 78: Middle East and Africa n-Hexane Market Volume Share (%), by Application 2025 & 2033
- Figure 79: Middle East and Africa n-Hexane Market Revenue (Million), by Country 2025 & 2033
- Figure 80: Middle East and Africa n-Hexane Market Volume (Billion), by Country 2025 & 2033
- Figure 81: Middle East and Africa n-Hexane Market Revenue Share (%), by Country 2025 & 2033
- Figure 82: Middle East and Africa n-Hexane Market Volume Share (%), by Country 2025 & 2033
List of Tables
- Table 1: Global n-Hexane Market Revenue Million Forecast, by Type 2020 & 2033
- Table 2: Global n-Hexane Market Volume Billion Forecast, by Type 2020 & 2033
- Table 3: Global n-Hexane Market Revenue Million Forecast, by Grade 2020 & 2033
- Table 4: Global n-Hexane Market Volume Billion Forecast, by Grade 2020 & 2033
- Table 5: Global n-Hexane Market Revenue Million Forecast, by Application 2020 & 2033
- Table 6: Global n-Hexane Market Volume Billion Forecast, by Application 2020 & 2033
- Table 7: Global n-Hexane Market Revenue Million Forecast, by Region 2020 & 2033
- Table 8: Global n-Hexane Market Volume Billion Forecast, by Region 2020 & 2033
- Table 9: Global n-Hexane Market Revenue Million Forecast, by Type 2020 & 2033
- Table 10: Global n-Hexane Market Volume Billion Forecast, by Type 2020 & 2033
- Table 11: Global n-Hexane Market Revenue Million Forecast, by Grade 2020 & 2033
- Table 12: Global n-Hexane Market Volume Billion Forecast, by Grade 2020 & 2033
- Table 13: Global n-Hexane Market Revenue Million Forecast, by Application 2020 & 2033
- Table 14: Global n-Hexane Market Volume Billion Forecast, by Application 2020 & 2033
- Table 15: Global n-Hexane Market Revenue Million Forecast, by Country 2020 & 2033
- Table 16: Global n-Hexane Market Volume Billion Forecast, by Country 2020 & 2033
- Table 17: China n-Hexane Market Revenue (Million) Forecast, by Application 2020 & 2033
- Table 18: China n-Hexane Market Volume (Billion) Forecast, by Application 2020 & 2033
- Table 19: India n-Hexane Market Revenue (Million) Forecast, by Application 2020 & 2033
- Table 20: India n-Hexane Market Volume (Billion) Forecast, by Application 2020 & 2033
- Table 21: Japan n-Hexane Market Revenue (Million) Forecast, by Application 2020 & 2033
- Table 22: Japan n-Hexane Market Volume (Billion) Forecast, by Application 2020 & 2033
- Table 23: South Korea n-Hexane Market Revenue (Million) Forecast, by Application 2020 & 2033
- Table 24: South Korea n-Hexane Market Volume (Billion) Forecast, by Application 2020 & 2033
- Table 25: Malaysia n-Hexane Market Revenue (Million) Forecast, by Application 2020 & 2033
- Table 26: Malaysia n-Hexane Market Volume (Billion) Forecast, by Application 2020 & 2033
- Table 27: Thailand n-Hexane Market Revenue (Million) Forecast, by Application 2020 & 2033
- Table 28: Thailand n-Hexane Market Volume (Billion) Forecast, by Application 2020 & 2033
- Table 29: Indonesia n-Hexane Market Revenue (Million) Forecast, by Application 2020 & 2033
- Table 30: Indonesia n-Hexane Market Volume (Billion) Forecast, by Application 2020 & 2033
- Table 31: Vietnam n-Hexane Market Revenue (Million) Forecast, by Application 2020 & 2033
- Table 32: Vietnam n-Hexane Market Volume (Billion) Forecast, by Application 2020 & 2033
- Table 33: Rest of Asia Pacific n-Hexane Market Revenue (Million) Forecast, by Application 2020 & 2033
- Table 34: Rest of Asia Pacific n-Hexane Market Volume (Billion) Forecast, by Application 2020 & 2033
- Table 35: Global n-Hexane Market Revenue Million Forecast, by Type 2020 & 2033
- Table 36: Global n-Hexane Market Volume Billion Forecast, by Type 2020 & 2033
- Table 37: Global n-Hexane Market Revenue Million Forecast, by Grade 2020 & 2033
- Table 38: Global n-Hexane Market Volume Billion Forecast, by Grade 2020 & 2033
- Table 39: Global n-Hexane Market Revenue Million Forecast, by Application 2020 & 2033
- Table 40: Global n-Hexane Market Volume Billion Forecast, by Application 2020 & 2033
- Table 41: Global n-Hexane Market Revenue Million Forecast, by Country 2020 & 2033
- Table 42: Global n-Hexane Market Volume Billion Forecast, by Country 2020 & 2033
- Table 43: United States n-Hexane Market Revenue (Million) Forecast, by Application 2020 & 2033
- Table 44: United States n-Hexane Market Volume (Billion) Forecast, by Application 2020 & 2033
- Table 45: Canada n-Hexane Market Revenue (Million) Forecast, by Application 2020 & 2033
- Table 46: Canada n-Hexane Market Volume (Billion) Forecast, by Application 2020 & 2033
- Table 47: Mexico n-Hexane Market Revenue (Million) Forecast, by Application 2020 & 2033
- Table 48: Mexico n-Hexane Market Volume (Billion) Forecast, by Application 2020 & 2033
- Table 49: Global n-Hexane Market Revenue Million Forecast, by Type 2020 & 2033
- Table 50: Global n-Hexane Market Volume Billion Forecast, by Type 2020 & 2033
- Table 51: Global n-Hexane Market Revenue Million Forecast, by Grade 2020 & 2033
- Table 52: Global n-Hexane Market Volume Billion Forecast, by Grade 2020 & 2033
- Table 53: Global n-Hexane Market Revenue Million Forecast, by Application 2020 & 2033
- Table 54: Global n-Hexane Market Volume Billion Forecast, by Application 2020 & 2033
- Table 55: Global n-Hexane Market Revenue Million Forecast, by Country 2020 & 2033
- Table 56: Global n-Hexane Market Volume Billion Forecast, by Country 2020 & 2033
- Table 57: Germany n-Hexane Market Revenue (Million) Forecast, by Application 2020 & 2033
- Table 58: Germany n-Hexane Market Volume (Billion) Forecast, by Application 2020 & 2033
- Table 59: United Kingdom n-Hexane Market Revenue (Million) Forecast, by Application 2020 & 2033
- Table 60: United Kingdom n-Hexane Market Volume (Billion) Forecast, by Application 2020 & 2033
- Table 61: Italy n-Hexane Market Revenue (Million) Forecast, by Application 2020 & 2033
- Table 62: Italy n-Hexane Market Volume (Billion) Forecast, by Application 2020 & 2033
- Table 63: France n-Hexane Market Revenue (Million) Forecast, by Application 2020 & 2033
- Table 64: France n-Hexane Market Volume (Billion) Forecast, by Application 2020 & 2033
- Table 65: Spain n-Hexane Market Revenue (Million) Forecast, by Application 2020 & 2033
- Table 66: Spain n-Hexane Market Volume (Billion) Forecast, by Application 2020 & 2033
- Table 67: NORDIC n-Hexane Market Revenue (Million) Forecast, by Application 2020 & 2033
- Table 68: NORDIC n-Hexane Market Volume (Billion) Forecast, by Application 2020 & 2033
- Table 69: Turkey n-Hexane Market Revenue (Million) Forecast, by Application 2020 & 2033
- Table 70: Turkey n-Hexane Market Volume (Billion) Forecast, by Application 2020 & 2033
- Table 71: Russia n-Hexane Market Revenue (Million) Forecast, by Application 2020 & 2033
- Table 72: Russia n-Hexane Market Volume (Billion) Forecast, by Application 2020 & 2033
- Table 73: Rest of Europe n-Hexane Market Revenue (Million) Forecast, by Application 2020 & 2033
- Table 74: Rest of Europe n-Hexane Market Volume (Billion) Forecast, by Application 2020 & 2033
- Table 75: Global n-Hexane Market Revenue Million Forecast, by Type 2020 & 2033
- Table 76: Global n-Hexane Market Volume Billion Forecast, by Type 2020 & 2033
- Table 77: Global n-Hexane Market Revenue Million Forecast, by Grade 2020 & 2033
- Table 78: Global n-Hexane Market Volume Billion Forecast, by Grade 2020 & 2033
- Table 79: Global n-Hexane Market Revenue Million Forecast, by Application 2020 & 2033
- Table 80: Global n-Hexane Market Volume Billion Forecast, by Application 2020 & 2033
- Table 81: Global n-Hexane Market Revenue Million Forecast, by Country 2020 & 2033
- Table 82: Global n-Hexane Market Volume Billion Forecast, by Country 2020 & 2033
- Table 83: Brazil n-Hexane Market Revenue (Million) Forecast, by Application 2020 & 2033
- Table 84: Brazil n-Hexane Market Volume (Billion) Forecast, by Application 2020 & 2033
- Table 85: Argentina n-Hexane Market Revenue (Million) Forecast, by Application 2020 & 2033
- Table 86: Argentina n-Hexane Market Volume (Billion) Forecast, by Application 2020 & 2033
- Table 87: Colombia n-Hexane Market Revenue (Million) Forecast, by Application 2020 & 2033
- Table 88: Colombia n-Hexane Market Volume (Billion) Forecast, by Application 2020 & 2033
- Table 89: Rest of South America n-Hexane Market Revenue (Million) Forecast, by Application 2020 & 2033
- Table 90: Rest of South America n-Hexane Market Volume (Billion) Forecast, by Application 2020 & 2033
- Table 91: Global n-Hexane Market Revenue Million Forecast, by Type 2020 & 2033
- Table 92: Global n-Hexane Market Volume Billion Forecast, by Type 2020 & 2033
- Table 93: Global n-Hexane Market Revenue Million Forecast, by Grade 2020 & 2033
- Table 94: Global n-Hexane Market Volume Billion Forecast, by Grade 2020 & 2033
- Table 95: Global n-Hexane Market Revenue Million Forecast, by Application 2020 & 2033
- Table 96: Global n-Hexane Market Volume Billion Forecast, by Application 2020 & 2033
- Table 97: Global n-Hexane Market Revenue Million Forecast, by Country 2020 & 2033
- Table 98: Global n-Hexane Market Volume Billion Forecast, by Country 2020 & 2033
- Table 99: Saudi Arabia n-Hexane Market Revenue (Million) Forecast, by Application 2020 & 2033
- Table 100: Saudi Arabia n-Hexane Market Volume (Billion) Forecast, by Application 2020 & 2033
- Table 101: South Africa n-Hexane Market Revenue (Million) Forecast, by Application 2020 & 2033
- Table 102: South Africa n-Hexane Market Volume (Billion) Forecast, by Application 2020 & 2033
- Table 103: Nigeria n-Hexane Market Revenue (Million) Forecast, by Application 2020 & 2033
- Table 104: Nigeria n-Hexane Market Volume (Billion) Forecast, by Application 2020 & 2033
- Table 105: Qatar n-Hexane Market Revenue (Million) Forecast, by Application 2020 & 2033
- Table 106: Qatar n-Hexane Market Volume (Billion) Forecast, by Application 2020 & 2033
- Table 107: Egypt n-Hexane Market Revenue (Million) Forecast, by Application 2020 & 2033
- Table 108: Egypt n-Hexane Market Volume (Billion) Forecast, by Application 2020 & 2033
- Table 109: United Arab Emirates n-Hexane Market Revenue (Million) Forecast, by Application 2020 & 2033
- Table 110: United Arab Emirates n-Hexane Market Volume (Billion) Forecast, by Application 2020 & 2033
- Table 111: Rest of Middle East and Africa n-Hexane Market Revenue (Million) Forecast, by Application 2020 & 2033
- Table 112: Rest of Middle East and Africa n-Hexane Market Volume (Billion) Forecast, by Application 2020 & 2033
Frequently Asked Questions
1. What is the projected Compound Annual Growth Rate (CAGR) of the n-Hexane Market?
The projected CAGR is approximately 4.57%.
2. Which companies are prominent players in the n-Hexane Market?
Key companies in the market include Bharat Petroleum Corporation Limited (BPCL), China Petrochemical Corporation (Sinopec), Exxon Mobil Corporation, GFS Chemicals Inc, Hindustan Petroleum Corporation Limited (HPCL), Indian Oil Corporation Ltd, Jun Yuan Petroleum Group, Liaoning Yufeng Chemical Co Ltd, Phillips 66 Company, Rompetrol, Shell plc, Shenyang Huifeng Petrochemical Co Ltd, Sumitomo Chemical Co Ltd, THAI OIL GROUP*List Not Exhaustive.
3. What are the main segments of the n-Hexane Market?
The market segments include Type, Grade, Application.
4. Can you provide details about the market size?
The market size is estimated to be USD 2.24 Million as of 2022.
5. What are some drivers contributing to market growth?
Growing Demand from Petrochemical Industries; Increasing Demand for Edible Oil Extraction; Other Drivers.
6. What are the notable trends driving market growth?
Edible Oil Extraction to Dominate the Market.
7. Are there any restraints impacting market growth?
Growing Demand from Petrochemical Industries; Increasing Demand for Edible Oil Extraction; Other Drivers.
8. Can you provide examples of recent developments in the market?
March 2022: Phillips 66 announced its merger with Phillips 66 Partners. The merger resulted in Phillips 66 acquiring all limited partnership interests in PSXP not already owned by Phillips 66 and its affiliates.
9. What pricing options are available for accessing the report?
Pricing options include single-user, multi-user, and enterprise licenses priced at USD 4750, USD 5250, and USD 8750 respectively.
10. Is the market size provided in terms of value or volume?
The market size is provided in terms of value, measured in Million and volume, measured in Billion.
11. Are there any specific market keywords associated with the report?
Yes, the market keyword associated with the report is "n-Hexane Market," which aids in identifying and referencing the specific market segment covered.
12. How do I determine which pricing option suits my needs best?
The pricing options vary based on user requirements and access needs. Individual users may opt for single-user licenses, while businesses requiring broader access may choose multi-user or enterprise licenses for cost-effective access to the report.
13. Are there any additional resources or data provided in the n-Hexane Market report?
While the report offers comprehensive insights, it's advisable to review the specific contents or supplementary materials provided to ascertain if additional resources or data are available.
14. How can I stay updated on further developments or reports in the n-Hexane Market?
To stay informed about further developments, trends, and reports in the n-Hexane Market, consider subscribing to industry newsletters, following relevant companies and organizations, or regularly checking reputable industry news sources and publications.
Methodology
Step 1 - Identification of Relevant Samples Size from Population Database


Step 2 - Approaches for Defining Global Market Size (Value, Volume* & Price*)

Note*: In applicable scenarios
Step 3 - Data Sources
Primary Research
- Web Analytics
- Survey Reports
- Research Institute
- Latest Research Reports
- Opinion Leaders
Secondary Research
- Annual Reports
- White Paper
- Latest Press Release
- Industry Association
- Paid Database
- Investor Presentations

Step 4 - Data Triangulation
Involves using different sources of information in order to increase the validity of a study
These sources are likely to be stakeholders in a program - participants, other researchers, program staff, other community members, and so on.
Then we put all data in single framework & apply various statistical tools to find out the dynamic on the market.
During the analysis stage, feedback from the stakeholder groups would be compared to determine areas of agreement as well as areas of divergence