Key Insights
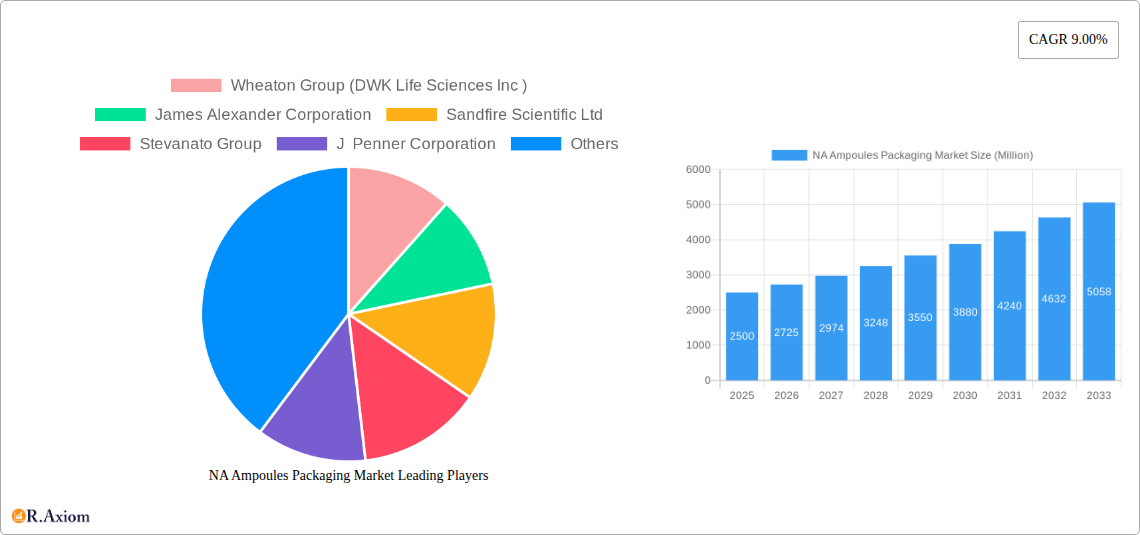
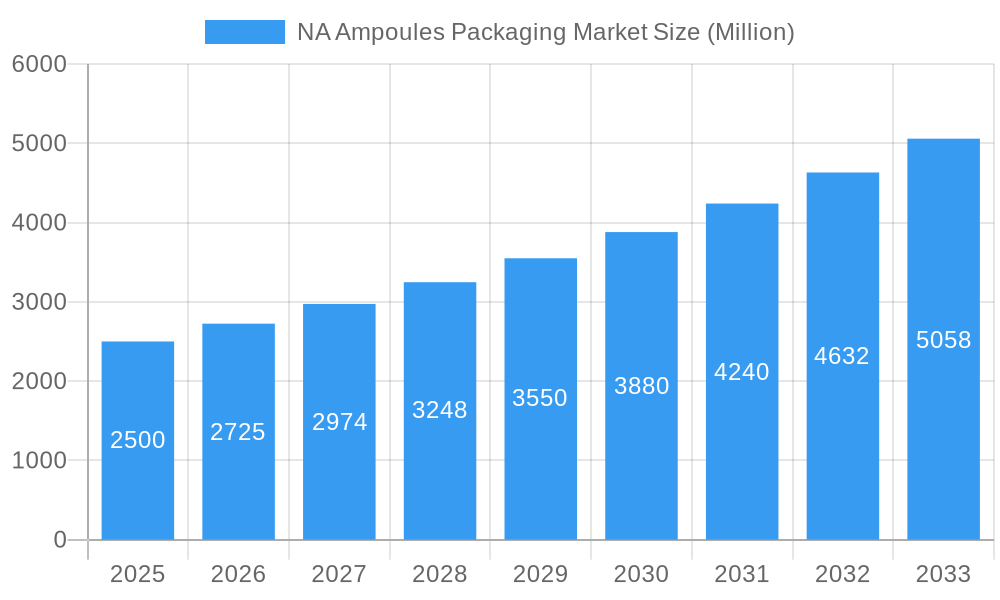
The North American (NA) ampoules packaging market, encompassing glass and plastic materials, is experiencing robust growth, driven by the increasing demand for injectable pharmaceuticals and the rising prevalence of chronic diseases requiring injectable therapies. The market's Compound Annual Growth Rate (CAGR) of 9% from 2019-2033 reflects a steady expansion, fueled by advancements in packaging technology offering enhanced sterility and protection, and the growing adoption of single-dose ampoules for improved patient safety and medication efficacy. The United States, as the larger market within North America, benefits significantly from a strong pharmaceutical industry and advanced healthcare infrastructure. Canada, while smaller in size, exhibits similar growth trends, driven by factors such as aging population and increased healthcare spending. Key market players, including Wheaton Group, James Alexander Corporation, and Stevanato Group, are strategically investing in innovation and expansion to capitalize on market opportunities, focusing on sustainable and cost-effective solutions. Competition is moderate but intensifying as new entrants emerge, and established players innovate to maintain their market share. While regulatory hurdles and material price fluctuations pose some challenges, the overall outlook for the NA ampoules packaging market remains positive, projecting continued expansion throughout the forecast period (2025-2033). The market segmentation by material (glass and plastic) reflects consumer preferences and application requirements, with glass maintaining a significant share due to its inherent barrier properties, while plastic gains traction in areas where cost-effectiveness and lightweight packaging are prioritized.
NA Ampoules Packaging Market Market Size (In Billion)
The market’s expansion is further supported by the increasing focus on personalized medicine and the development of advanced drug delivery systems. The rise in outsourcing of packaging services by pharmaceutical companies also contributes to market growth, creating opportunities for contract manufacturers. Future growth will likely be influenced by technological advancements, such as the integration of smart packaging technologies and improved traceability systems, enhancing supply chain efficiency and patient safety. Regulations concerning pharmaceutical packaging will continue to shape market dynamics, impacting material choices and manufacturing processes. The ongoing shift towards sustainable practices within the pharmaceutical industry will drive the demand for eco-friendly packaging materials and manufacturing techniques. Overall, the NA ampoules packaging market is poised for sustained and considerable growth, driven by a confluence of factors including technological innovation, demographic trends, and regulatory landscapes.
NA Ampoules Packaging Market Company Market Share
North America Ampoules Packaging Market: A Comprehensive Report (2019-2033)
This comprehensive report provides a detailed analysis of the North America Ampoules Packaging market, offering invaluable insights for stakeholders across the pharmaceutical and packaging industries. The report covers the period from 2019 to 2033, with a focus on the base year 2025 and a forecast period of 2025-2033. Key segments analyzed include material type (Glass, Plastic) and geographic location (United States, Canada). Leading companies like Wheaton Group (DWK Life Sciences Inc), James Alexander Corporation, Sandfire Scientific Ltd, Stevanato Group, J Penner Corporation, Syntegon Technology GmbH, Amposan S, and SCHOTT AG are profiled, providing a competitive landscape assessment.
NA Ampoules Packaging Market Market Concentration & Innovation
The North American ampoules packaging market exhibits a moderately concentrated structure, with a few major players holding significant market share. The exact market share distribution varies by segment (glass vs. plastic) and geographic location (US vs. Canada). However, the dominance of established players suggests a high barrier to entry for new entrants. Innovation in this sector is driven primarily by the pharmaceutical industry's demand for enhanced sterility, improved drug stability, and more sustainable packaging solutions. Regulatory frameworks, particularly those related to drug safety and environmental compliance, play a significant role in shaping innovation trends. Product substitution, particularly towards more environmentally friendly materials like certain types of plastics, is gaining momentum. End-user trends, such as the increasing demand for single-dose ampoules, are influencing packaging designs and material choices. M&A activity in the recent past has been relatively modest, with deal values averaging approximately xx Million annually (2019-2024). These deals primarily focused on consolidating market share and expanding geographical reach.
- Market concentration (Herfindahl-Hirschman Index): xx
- Average M&A deal value (2019-2024): xx Million
- Number of M&A deals (2019-2024): xx
NA Ampoules Packaging Market Industry Trends & Insights
The North American ampoules packaging market is experiencing steady growth, driven by several key factors. The rising prevalence of injectable pharmaceuticals, coupled with increasing demand for single-dose packaging to minimize contamination risks and improve patient convenience, fuels market expansion. Technological disruptions are evident in the adoption of advanced materials, such as borosilicate glass and specialized plastics offering enhanced barrier properties. Consumer preference for safer, more convenient drug delivery systems directly impacts the demand for innovative ampoule packaging. The competitive dynamics are characterized by established players focusing on optimizing production efficiency and expanding their product portfolio. This results in a steady CAGR of approximately xx% between 2025 and 2033, with market penetration of xx% in the US and xx% in Canada by 2033.
Dominant Markets & Segments in NA Ampoules Packaging Market
The United States constitutes the larger market share in North America for ampoule packaging, driven by its substantial pharmaceutical industry and high demand for injectable drugs. Key drivers include a robust healthcare infrastructure, favorable government regulations, and considerable research and development investment in pharmaceuticals. The Glass segment holds a larger share than the Plastic segment within both countries. This is primarily due to the high barrier properties of glass and its long-established use in pharmaceutical packaging.
- United States:
- Strong pharmaceutical industry
- Advanced healthcare infrastructure
- High R&D investment
- Favorable regulatory environment
- Canada:
- Growing pharmaceutical sector
- Increasing demand for injectable drugs
- Well-established healthcare system
- Glass Segment:
- Superior barrier properties
- Established industry standard
- High level of consumer trust
- Plastic Segment:
- Growing demand for lighter weight options
- Increasing focus on sustainability
NA Ampoules Packaging Market Product Developments
Recent product developments have focused on enhancing sterility and extending shelf life. Innovations include the use of advanced barrier coatings on glass and plastic ampoules, improving their resistance to moisture and oxygen. There is a growing trend toward pre-filled ampoules, optimizing efficiency in pharmaceutical manufacturing. The key competitive advantages lie in offering superior barrier properties, improved sterility assurance, and cost-effective solutions.
Report Scope & Segmentation Analysis
This report segments the North American ampoules packaging market by material (Glass, Plastic) and country (United States, Canada). The Glass segment is projected to experience a steady growth rate, driven by its superior barrier properties and established use in pharmaceutical applications. The Plastic segment is expected to grow at a faster pace due to the increasing focus on sustainability and cost reduction. Market size and competitive dynamics vary across segments and countries, providing a detailed breakdown of the market's nuanced structure. The US market is substantially larger than the Canadian market.
Key Drivers of NA Ampoules Packaging Market Growth
Several factors fuel the growth of the NA ampoules packaging market: the increasing prevalence of injectable drugs; advancements in packaging materials providing better barrier properties and sterility; stringent government regulations demanding improved safety and efficacy; and a growing preference for single-dose packaging for enhanced convenience and hygiene. The continuous development of new injectable drugs further solidifies this market's growth potential.
Challenges in the NA Ampoules Packaging Market Sector
Challenges include stringent regulatory compliance requirements, which increase production costs; fluctuations in raw material prices, impacting profitability; and intense competition among established players, forcing companies to constantly innovate and optimize their offerings. Supply chain disruptions can also have a significant impact on production and delivery, resulting in potential revenue loss.
Emerging Opportunities in NA Ampoules Packaging Market
Emerging opportunities include the growing demand for eco-friendly packaging solutions, driving innovation in sustainable materials and processes. The expansion of the biopharmaceutical sector creates a greater need for specialized ampoules, which present a significant growth opportunity. Advancements in packaging technologies, particularly automation and high-speed filling, offer potential for increased efficiency and reduced costs.
Leading Players in the NA Ampoules Packaging Market Market
- Wheaton Group (DWK Life Sciences Inc)
- James Alexander Corporation
- Sandfire Scientific Ltd
- Stevanato Group
- J Penner Corporation
- Syntegon Technology GmbH
- Amposan S
- SCHOTT AG
Key Developments in NA Ampoules Packaging Market Industry
- Jan 2023: Stevanato Group launched a new line of sustainable glass ampoules.
- May 2022: Schott AG announced a significant investment in expanding its glass ampoule manufacturing capacity.
- Oct 2021: Wheaton Group acquired a smaller packaging company, expanding its market reach.
- Further details will be included in the full report.
Strategic Outlook for NA Ampoules Packaging Market Market
The future of the North American ampoules packaging market appears promising, driven by persistent growth in the pharmaceutical industry and continuous innovation in packaging materials and technologies. Opportunities for sustainable solutions and advanced automation will shape the market landscape. The focus on single-dose and pre-filled ampoules will likely continue to drive expansion. Companies need to adapt to evolving regulatory requirements, optimize their supply chains, and embrace sustainable practices to succeed in this competitive market.
NA Ampoules Packaging Market Segmentation
-
1. Material
- 1.1. Glass
- 1.2. Plastic
NA Ampoules Packaging Market Segmentation By Geography
-
1. North America
- 1.1. United States
- 1.2. Canada
- 1.3. Mexico
-
2. South America
- 2.1. Brazil
- 2.2. Argentina
- 2.3. Rest of South America
-
3. Europe
- 3.1. United Kingdom
- 3.2. Germany
- 3.3. France
- 3.4. Italy
- 3.5. Spain
- 3.6. Russia
- 3.7. Benelux
- 3.8. Nordics
- 3.9. Rest of Europe
-
4. Middle East & Africa
- 4.1. Turkey
- 4.2. Israel
- 4.3. GCC
- 4.4. North Africa
- 4.5. South Africa
- 4.6. Rest of Middle East & Africa
-
5. Asia Pacific
- 5.1. China
- 5.2. India
- 5.3. Japan
- 5.4. South Korea
- 5.5. ASEAN
- 5.6. Oceania
- 5.7. Rest of Asia Pacific
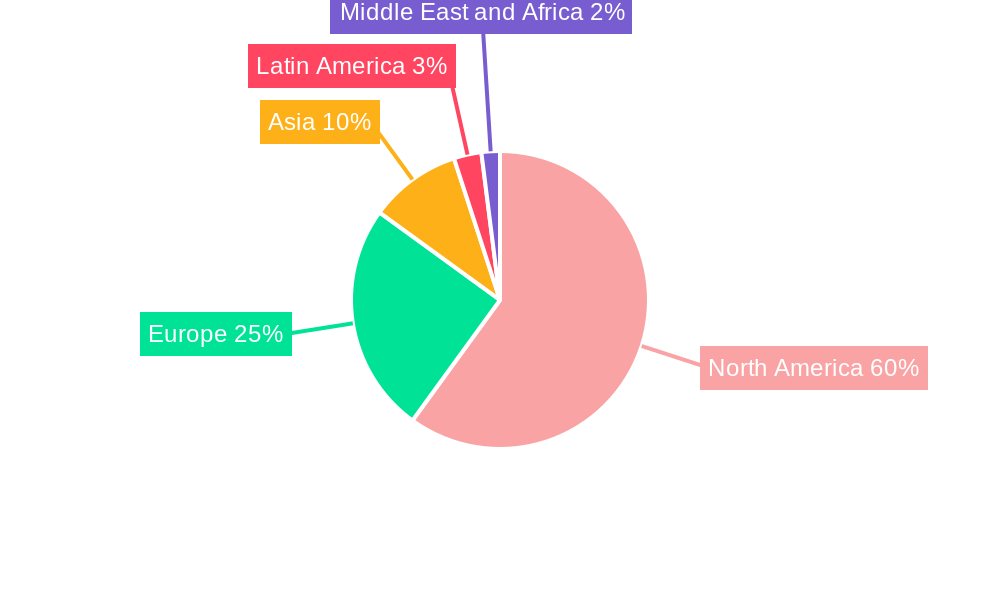
NA Ampoules Packaging Market Regional Market Share
Geographic Coverage of NA Ampoules Packaging Market
NA Ampoules Packaging Market REPORT HIGHLIGHTS
| Aspects | Details |
|---|---|
| Study Period | 2020-2034 |
| Base Year | 2025 |
| Estimated Year | 2026 |
| Forecast Period | 2026-2034 |
| Historical Period | 2020-2025 |
| Growth Rate | CAGR of 9.00% from 2020-2034 |
| Segmentation |
|
Table of Contents
- 1. Introduction
- 1.1. Research Scope
- 1.2. Market Segmentation
- 1.3. Research Objective
- 1.4. Definitions and Assumptions
- 2. Executive Summary
- 2.1. Market Snapshot
- 3. Market Dynamics
- 3.1. Market Drivers
- 3.2. Market Restrains
- 3.3. Market Trends
- 3.4. Market Opportunities
- 4. Market Factor Analysis
- 4.1. Porters Five Forces
- 4.1.1. Bargaining Power of Suppliers
- 4.1.2. Bargaining Power of Buyers
- 4.1.3. Threat of New Entrants
- 4.1.4. Threat of Substitutes
- 4.1.5. Competitive Rivalry
- 4.2. PESTEL analysis
- 4.3. BCG Analysis
- 4.3.1. Stars (High Growth, High Market Share)
- 4.3.2. Cash Cows (Low Growth, High Market Share)
- 4.3.3. Question Mark (High Growth, Low Market Share)
- 4.3.4. Dogs (Low Growth, Low Market Share)
- 4.4. Ansoff Matrix Analysis
- 4.5. Supply Chain Analysis
- 4.6. Regulatory Landscape
- 4.7. Current Market Potential and Opportunity Assessment (TAM–SAM–SOM Framework)
- 4.8. RAX Analyst Note
- 4.1. Porters Five Forces
- 5. Market Analysis, Insights and Forecast 2021-2033
- 5.1. Market Analysis, Insights and Forecast - by Material
- 5.1.1. Glass
- 5.1.2. Plastic
- 5.2. Market Analysis, Insights and Forecast - by Region
- 5.2.1. North America
- 5.2.2. South America
- 5.2.3. Europe
- 5.2.4. Middle East & Africa
- 5.2.5. Asia Pacific
- 5.1. Market Analysis, Insights and Forecast - by Material
- 6. Global NA Ampoules Packaging Market Analysis, Insights and Forecast, 2021-2033
- 6.1. Market Analysis, Insights and Forecast - by Material
- 6.1.1. Glass
- 6.1.2. Plastic
- 6.1. Market Analysis, Insights and Forecast - by Material
- 7. North America NA Ampoules Packaging Market Analysis, Insights and Forecast, 2020-2032
- 7.1. Market Analysis, Insights and Forecast - by Material
- 7.1.1. Glass
- 7.1.2. Plastic
- 7.1. Market Analysis, Insights and Forecast - by Material
- 8. South America NA Ampoules Packaging Market Analysis, Insights and Forecast, 2020-2032
- 8.1. Market Analysis, Insights and Forecast - by Material
- 8.1.1. Glass
- 8.1.2. Plastic
- 8.1. Market Analysis, Insights and Forecast - by Material
- 9. Europe NA Ampoules Packaging Market Analysis, Insights and Forecast, 2020-2032
- 9.1. Market Analysis, Insights and Forecast - by Material
- 9.1.1. Glass
- 9.1.2. Plastic
- 9.1. Market Analysis, Insights and Forecast - by Material
- 10. Middle East & Africa NA Ampoules Packaging Market Analysis, Insights and Forecast, 2020-2032
- 10.1. Market Analysis, Insights and Forecast - by Material
- 10.1.1. Glass
- 10.1.2. Plastic
- 10.1. Market Analysis, Insights and Forecast - by Material
- 11. Asia Pacific NA Ampoules Packaging Market Analysis, Insights and Forecast, 2020-2032
- 11.1. Market Analysis, Insights and Forecast - by Material
- 11.1.1. Glass
- 11.1.2. Plastic
- 11.1. Market Analysis, Insights and Forecast - by Material
- 12. Competitive Analysis
- 12.1. Company Profiles
- 12.1.1 Wheaton Group (DWK Life Sciences Inc )
- 12.1.1.1. Company Overview
- 12.1.1.2. Products
- 12.1.1.3. Company Financials
- 12.1.1.4. SWOT Analysis
- 12.1.2 James Alexander Corporation
- 12.1.2.1. Company Overview
- 12.1.2.2. Products
- 12.1.2.3. Company Financials
- 12.1.2.4. SWOT Analysis
- 12.1.3 Sandfire Scientific Ltd
- 12.1.3.1. Company Overview
- 12.1.3.2. Products
- 12.1.3.3. Company Financials
- 12.1.3.4. SWOT Analysis
- 12.1.4 Stevanato Group
- 12.1.4.1. Company Overview
- 12.1.4.2. Products
- 12.1.4.3. Company Financials
- 12.1.4.4. SWOT Analysis
- 12.1.5 J Penner Corporation
- 12.1.5.1. Company Overview
- 12.1.5.2. Products
- 12.1.5.3. Company Financials
- 12.1.5.4. SWOT Analysis
- 12.1.6 Syntegon Technology GmbH
- 12.1.6.1. Company Overview
- 12.1.6.2. Products
- 12.1.6.3. Company Financials
- 12.1.6.4. SWOT Analysis
- 12.1.7 Amposan S
- 12.1.7.1. Company Overview
- 12.1.7.2. Products
- 12.1.7.3. Company Financials
- 12.1.7.4. SWOT Analysis
- 12.1.8 SCHOTT AG
- 12.1.8.1. Company Overview
- 12.1.8.2. Products
- 12.1.8.3. Company Financials
- 12.1.8.4. SWOT Analysis
- 12.1.1 Wheaton Group (DWK Life Sciences Inc )
- 12.2. Market Entropy
- 12.2.1 Company's Key Areas Served
- 12.2.2 Recent Developments
- 12.3. Company Market Share Analysis 2025
- 12.3.1 Top 5 Companies Market Share Analysis
- 12.3.2 Top 3 Companies Market Share Analysis
- 12.4. List of Potential Customers
- 13. Research Methodology
List of Figures
- Figure 1: Global NA Ampoules Packaging Market Revenue Breakdown (Million, %) by Region 2025 & 2033
- Figure 2: North America NA Ampoules Packaging Market Revenue (Million), by Material 2025 & 2033
- Figure 3: North America NA Ampoules Packaging Market Revenue Share (%), by Material 2025 & 2033
- Figure 4: North America NA Ampoules Packaging Market Revenue (Million), by Country 2025 & 2033
- Figure 5: North America NA Ampoules Packaging Market Revenue Share (%), by Country 2025 & 2033
- Figure 6: South America NA Ampoules Packaging Market Revenue (Million), by Material 2025 & 2033
- Figure 7: South America NA Ampoules Packaging Market Revenue Share (%), by Material 2025 & 2033
- Figure 8: South America NA Ampoules Packaging Market Revenue (Million), by Country 2025 & 2033
- Figure 9: South America NA Ampoules Packaging Market Revenue Share (%), by Country 2025 & 2033
- Figure 10: Europe NA Ampoules Packaging Market Revenue (Million), by Material 2025 & 2033
- Figure 11: Europe NA Ampoules Packaging Market Revenue Share (%), by Material 2025 & 2033
- Figure 12: Europe NA Ampoules Packaging Market Revenue (Million), by Country 2025 & 2033
- Figure 13: Europe NA Ampoules Packaging Market Revenue Share (%), by Country 2025 & 2033
- Figure 14: Middle East & Africa NA Ampoules Packaging Market Revenue (Million), by Material 2025 & 2033
- Figure 15: Middle East & Africa NA Ampoules Packaging Market Revenue Share (%), by Material 2025 & 2033
- Figure 16: Middle East & Africa NA Ampoules Packaging Market Revenue (Million), by Country 2025 & 2033
- Figure 17: Middle East & Africa NA Ampoules Packaging Market Revenue Share (%), by Country 2025 & 2033
- Figure 18: Asia Pacific NA Ampoules Packaging Market Revenue (Million), by Material 2025 & 2033
- Figure 19: Asia Pacific NA Ampoules Packaging Market Revenue Share (%), by Material 2025 & 2033
- Figure 20: Asia Pacific NA Ampoules Packaging Market Revenue (Million), by Country 2025 & 2033
- Figure 21: Asia Pacific NA Ampoules Packaging Market Revenue Share (%), by Country 2025 & 2033
List of Tables
- Table 1: Global NA Ampoules Packaging Market Revenue Million Forecast, by Material 2020 & 2033
- Table 2: Global NA Ampoules Packaging Market Revenue Million Forecast, by Region 2020 & 2033
- Table 3: Global NA Ampoules Packaging Market Revenue Million Forecast, by Material 2020 & 2033
- Table 4: Global NA Ampoules Packaging Market Revenue Million Forecast, by Country 2020 & 2033
- Table 5: United States NA Ampoules Packaging Market Revenue (Million) Forecast, by Application 2020 & 2033
- Table 6: Canada NA Ampoules Packaging Market Revenue (Million) Forecast, by Application 2020 & 2033
- Table 7: Mexico NA Ampoules Packaging Market Revenue (Million) Forecast, by Application 2020 & 2033
- Table 8: Global NA Ampoules Packaging Market Revenue Million Forecast, by Material 2020 & 2033
- Table 9: Global NA Ampoules Packaging Market Revenue Million Forecast, by Country 2020 & 2033
- Table 10: Brazil NA Ampoules Packaging Market Revenue (Million) Forecast, by Application 2020 & 2033
- Table 11: Argentina NA Ampoules Packaging Market Revenue (Million) Forecast, by Application 2020 & 2033
- Table 12: Rest of South America NA Ampoules Packaging Market Revenue (Million) Forecast, by Application 2020 & 2033
- Table 13: Global NA Ampoules Packaging Market Revenue Million Forecast, by Material 2020 & 2033
- Table 14: Global NA Ampoules Packaging Market Revenue Million Forecast, by Country 2020 & 2033
- Table 15: United Kingdom NA Ampoules Packaging Market Revenue (Million) Forecast, by Application 2020 & 2033
- Table 16: Germany NA Ampoules Packaging Market Revenue (Million) Forecast, by Application 2020 & 2033
- Table 17: France NA Ampoules Packaging Market Revenue (Million) Forecast, by Application 2020 & 2033
- Table 18: Italy NA Ampoules Packaging Market Revenue (Million) Forecast, by Application 2020 & 2033
- Table 19: Spain NA Ampoules Packaging Market Revenue (Million) Forecast, by Application 2020 & 2033
- Table 20: Russia NA Ampoules Packaging Market Revenue (Million) Forecast, by Application 2020 & 2033
- Table 21: Benelux NA Ampoules Packaging Market Revenue (Million) Forecast, by Application 2020 & 2033
- Table 22: Nordics NA Ampoules Packaging Market Revenue (Million) Forecast, by Application 2020 & 2033
- Table 23: Rest of Europe NA Ampoules Packaging Market Revenue (Million) Forecast, by Application 2020 & 2033
- Table 24: Global NA Ampoules Packaging Market Revenue Million Forecast, by Material 2020 & 2033
- Table 25: Global NA Ampoules Packaging Market Revenue Million Forecast, by Country 2020 & 2033
- Table 26: Turkey NA Ampoules Packaging Market Revenue (Million) Forecast, by Application 2020 & 2033
- Table 27: Israel NA Ampoules Packaging Market Revenue (Million) Forecast, by Application 2020 & 2033
- Table 28: GCC NA Ampoules Packaging Market Revenue (Million) Forecast, by Application 2020 & 2033
- Table 29: North Africa NA Ampoules Packaging Market Revenue (Million) Forecast, by Application 2020 & 2033
- Table 30: South Africa NA Ampoules Packaging Market Revenue (Million) Forecast, by Application 2020 & 2033
- Table 31: Rest of Middle East & Africa NA Ampoules Packaging Market Revenue (Million) Forecast, by Application 2020 & 2033
- Table 32: Global NA Ampoules Packaging Market Revenue Million Forecast, by Material 2020 & 2033
- Table 33: Global NA Ampoules Packaging Market Revenue Million Forecast, by Country 2020 & 2033
- Table 34: China NA Ampoules Packaging Market Revenue (Million) Forecast, by Application 2020 & 2033
- Table 35: India NA Ampoules Packaging Market Revenue (Million) Forecast, by Application 2020 & 2033
- Table 36: Japan NA Ampoules Packaging Market Revenue (Million) Forecast, by Application 2020 & 2033
- Table 37: South Korea NA Ampoules Packaging Market Revenue (Million) Forecast, by Application 2020 & 2033
- Table 38: ASEAN NA Ampoules Packaging Market Revenue (Million) Forecast, by Application 2020 & 2033
- Table 39: Oceania NA Ampoules Packaging Market Revenue (Million) Forecast, by Application 2020 & 2033
- Table 40: Rest of Asia Pacific NA Ampoules Packaging Market Revenue (Million) Forecast, by Application 2020 & 2033
Frequently Asked Questions
1. What is the projected Compound Annual Growth Rate (CAGR) of the NA Ampoules Packaging Market?
The projected CAGR is approximately 9.00%.
2. Which companies are prominent players in the NA Ampoules Packaging Market?
Key companies in the market include Wheaton Group (DWK Life Sciences Inc ), James Alexander Corporation, Sandfire Scientific Ltd, Stevanato Group, J Penner Corporation, Syntegon Technology GmbH, Amposan S, SCHOTT AG.
3. What are the main segments of the NA Ampoules Packaging Market?
The market segments include Material.
4. Can you provide details about the market size?
The market size is estimated to be USD XX Million as of 2022.
5. What are some drivers contributing to market growth?
; Increasing Demand for Sterile and Tamper-Proof Packaging Solutions for the Pharmaceutical Industry; Stringent Government Regulations and Standards.
6. What are the notable trends driving market growth?
Pharmaceutical Industry Expected to Exhibit the Maximum Number of Adoption.
7. Are there any restraints impacting market growth?
; Concerns Regarding Dumping of Used Ampoules.
8. Can you provide examples of recent developments in the market?
N/A
9. What pricing options are available for accessing the report?
Pricing options include single-user, multi-user, and enterprise licenses priced at USD 4750, USD 4950, and USD 6800 respectively.
10. Is the market size provided in terms of value or volume?
The market size is provided in terms of value, measured in Million.
11. Are there any specific market keywords associated with the report?
Yes, the market keyword associated with the report is "NA Ampoules Packaging Market," which aids in identifying and referencing the specific market segment covered.
12. How do I determine which pricing option suits my needs best?
The pricing options vary based on user requirements and access needs. Individual users may opt for single-user licenses, while businesses requiring broader access may choose multi-user or enterprise licenses for cost-effective access to the report.
13. Are there any additional resources or data provided in the NA Ampoules Packaging Market report?
While the report offers comprehensive insights, it's advisable to review the specific contents or supplementary materials provided to ascertain if additional resources or data are available.
14. How can I stay updated on further developments or reports in the NA Ampoules Packaging Market?
To stay informed about further developments, trends, and reports in the NA Ampoules Packaging Market, consider subscribing to industry newsletters, following relevant companies and organizations, or regularly checking reputable industry news sources and publications.
Methodology
Step 1 - Identification of Relevant Samples Size from Population Database


Step 2 - Approaches for Defining Global Market Size (Value, Volume* & Price*)

Note*: In applicable scenarios
Step 3 - Data Sources
Primary Research
- Web Analytics
- Survey Reports
- Research Institute
- Latest Research Reports
- Opinion Leaders
Secondary Research
- Annual Reports
- White Paper
- Latest Press Release
- Industry Association
- Paid Database
- Investor Presentations

Step 4 - Data Triangulation
Involves using different sources of information in order to increase the validity of a study
These sources are likely to be stakeholders in a program - participants, other researchers, program staff, other community members, and so on.
Then we put all data in single framework & apply various statistical tools to find out the dynamic on the market.
During the analysis stage, feedback from the stakeholder groups would be compared to determine areas of agreement as well as areas of divergence

