
Key Insights
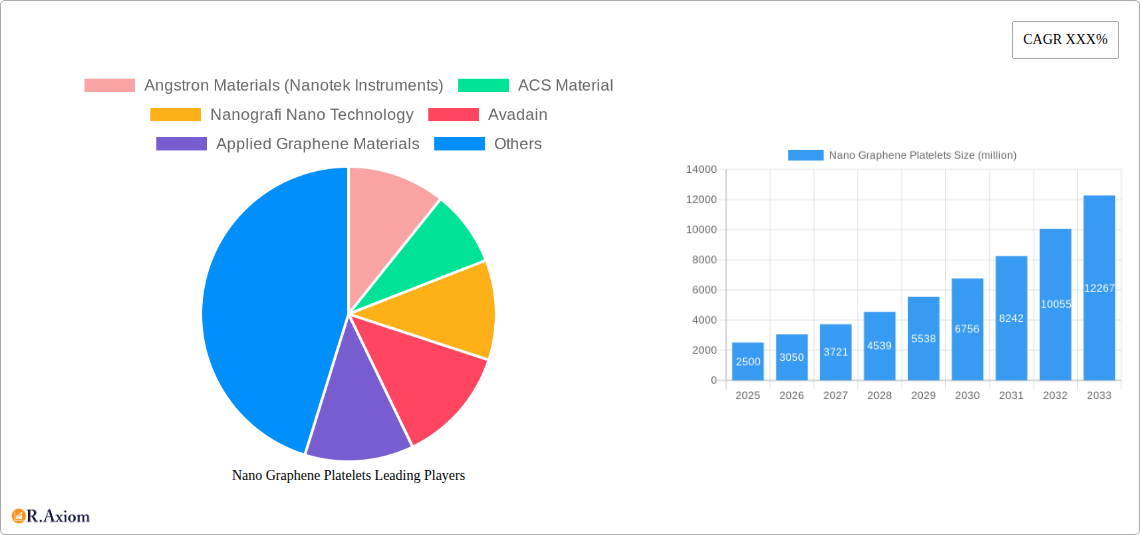
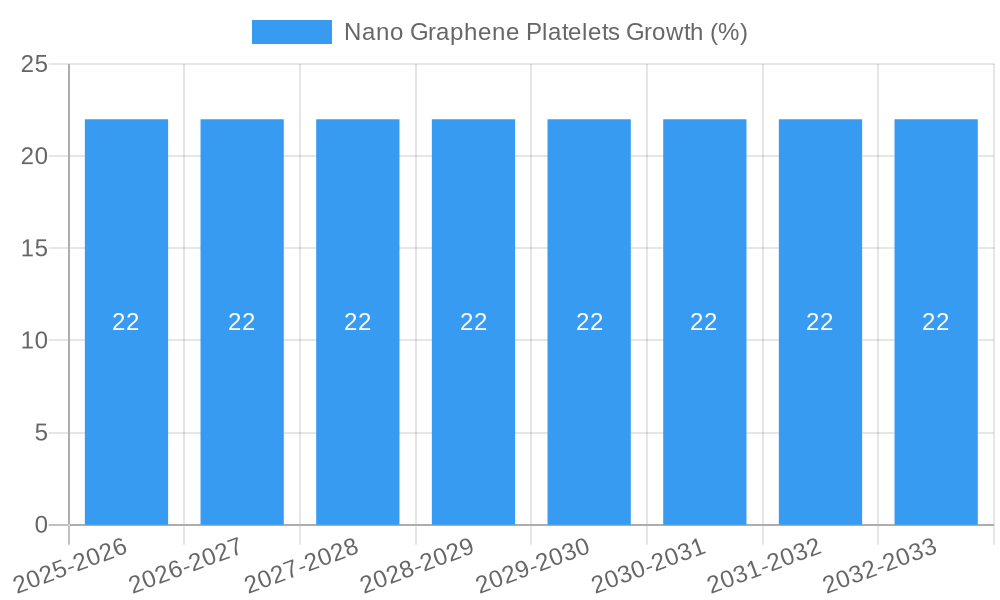
The global Nano Graphene Platelets market is poised for robust expansion, driven by escalating demand across key industries like electronics, energy, and chemical materials. Valued at an estimated \$2,500 million in 2025, the market is projected to witness a Compound Annual Growth Rate (CAGR) of approximately 22% during the forecast period of 2025-2033. This significant growth trajectory is underpinned by the unique properties of nano graphene platelets, including exceptional electrical conductivity, thermal conductivity, and mechanical strength, which make them ideal for advanced material applications. The electronics sector, in particular, is a major growth engine, fueled by the increasing use of graphene in high-performance batteries, supercapacitors, and conductive inks for flexible displays and printed electronics. Furthermore, the energy sector is leveraging nano graphene platelets for more efficient energy storage solutions and advanced composite materials for renewable energy infrastructure.
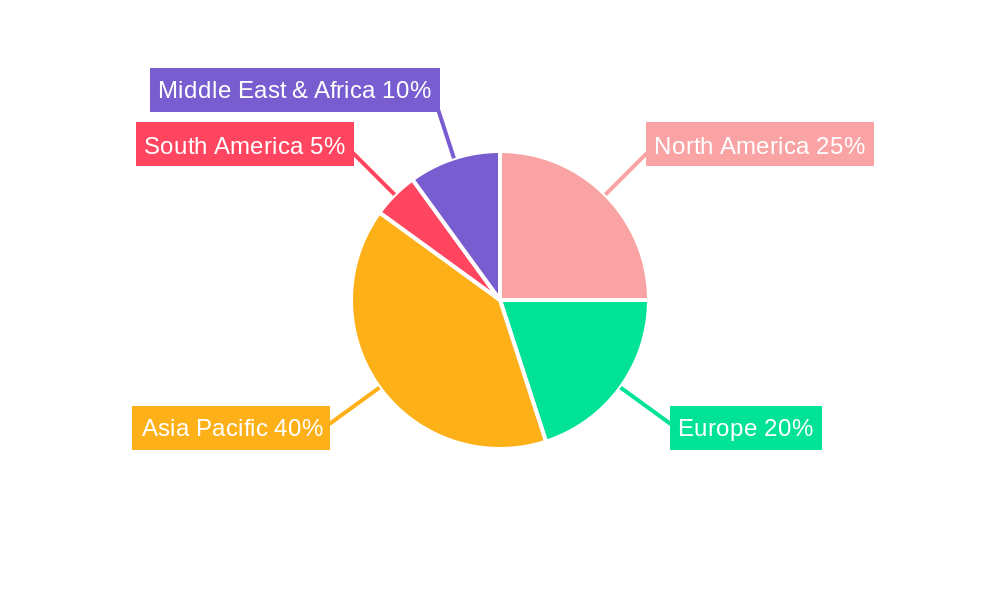
The market's expansion is further propelled by ongoing research and development initiatives aimed at improving production scalability and cost-effectiveness, alongside the continuous discovery of novel applications. The increasing adoption of single-layer graphene nanosheets, offering superior performance characteristics, is a significant trend shaping the market landscape. However, the high cost of production and the need for specialized handling and processing techniques present ongoing challenges. The market is characterized by a competitive environment with several key players, including Angstron Materials, ACS Material, Nanografi Nano Technology, and Graphenea, actively investing in innovation and expanding their production capacities. Geographically, Asia Pacific, led by China and South Korea, is anticipated to dominate the market due to its strong manufacturing base and significant investments in advanced materials research, followed by North America and Europe.
Nano Graphene Platelets Market Concentration & Innovation
The global nano graphene platelets market is characterized by a moderate level of concentration, with a significant presence of both established players and emerging innovators. Key industry leaders such as Angstron Materials (Nanotek Instruments), ACS Material, Nanografi Nano Technology, Avadain, Applied Graphene Materials, 2DM, Ceal Tech International, Thomas Swan, Nanochemazone, Graphenea, XG Sciences, Versarien, CVD Equipment, Graphene Laboratories, G-FLAKE (Lukasiewicz), Avanzare, Graphene 3D Lab, Raymor Industries, Tirupati Graphite PLC, Fuxi Technology, Chengdu Organic Chemicals, Xiamen Knano Graphene Technology, and more are actively shaping the competitive landscape. Innovation drivers are multifaceted, stemming from continuous advancements in synthesis techniques that yield higher purity and tailored properties, alongside the relentless pursuit of novel applications across diverse sectors. Regulatory frameworks are evolving, with increasing emphasis on safety, environmental impact, and standardization, which, while posing initial compliance hurdles, ultimately foster greater market maturity and consumer confidence. Product substitutes, such as carbon nanotubes and other advanced nanomaterials, present ongoing competition, but the unique electrical, thermal, and mechanical properties of graphene platelets continue to offer distinct advantages. End-user trends are increasingly favoring materials that enhance performance, reduce weight, and improve energy efficiency, directly benefiting graphene platelet adoption. Mergers and acquisitions (M&A) activities, though not as prevalent as in some other advanced materials sectors, are expected to increase as companies seek to consolidate market share, acquire complementary technologies, and expand their geographic reach. Estimated M&A deal values are projected to reach xx million USD by the end of the forecast period, reflecting strategic consolidation efforts.
Nano Graphene Platelets Industry Trends & Insights
The nano graphene platelets industry is poised for substantial growth, driven by a confluence of technological advancements, burgeoning application areas, and increasing investor interest. The market is expected to witness a Compound Annual Growth Rate (CAGR) of approximately 15% over the forecast period of 2025–2033. This robust expansion is fueled by significant market penetration across key segments, with initial estimates indicating current market penetration at around 10% of its total addressable market. Technological disruptions are central to this growth, with breakthroughs in cost-effective, scalable production methods for high-quality graphene platelets playing a pivotal role. Innovations in functionalization techniques are enabling tailored properties for specific end-uses, thereby broadening the application spectrum. Consumer preferences, particularly in high-performance electronics and advanced energy storage, are increasingly demanding materials with superior conductivity, thermal management, and mechanical strength, directly aligning with the inherent advantages of graphene platelets. Competitive dynamics are intensifying, with established players investing heavily in R&D and new market entrants bringing disruptive innovations. The increasing adoption of graphene platelets in advanced composites for automotive and aerospace industries, due to their lightweight and high-strength characteristics, is a major growth driver. Furthermore, the demand for enhanced battery performance in electric vehicles and portable electronics is propelling the use of graphene platelets as conductive additives and electrode materials, contributing significantly to market expansion. The chemical materials sector is also witnessing a surge in interest, with graphene platelets being explored for catalysts, coatings, and advanced filtration systems. The continued research into novel applications in biomedical fields and advanced sensors further solidifies the positive outlook for this market.
Dominant Markets & Segments in Nano Graphene Platelets
The dominance within the nano graphene platelets market is increasingly shifting towards regions and applications that exhibit high technological adoption rates and substantial R&D investment.
- Leading Region: Asia-Pacific is emerging as the dominant region, driven by its robust manufacturing base, significant government support for nanotechnology research, and a rapidly growing demand for advanced materials in countries like China, South Korea, and Japan. Economic policies promoting innovation and substantial infrastructure development in these nations are creating a fertile ground for graphene platelet adoption.
- Dominant Countries: Within Asia-Pacific, China stands out as a leading country due to its massive industrial output and a strategic focus on high-tech sectors. The substantial investment in electric vehicle manufacturing and consumer electronics production in China directly translates to a high demand for graphene-enhanced materials.
- Dominant Application Segment:
- Electronics: This segment is currently the largest and fastest-growing application for nano graphene platelets.
- Key Drivers: The relentless demand for faster, smaller, and more energy-efficient electronic devices, including smartphones, wearables, and advanced computing components, is a primary catalyst. The need for enhanced thermal management in high-performance processors and displays further fuels adoption. Graphene platelets' superior electrical conductivity makes them ideal for conductive inks, transparent electrodes, and advanced semiconductor applications. Market penetration in this segment is estimated to be around 15%.
- Energy: The energy sector, particularly energy storage, represents another significant growth area.
- Key Drivers: The global push towards renewable energy and electric mobility has created an immense demand for improved battery technologies. Graphene platelets are being incorporated into lithium-ion batteries to enhance charge/discharge rates, cycle life, and overall energy density. Their use in supercapacitors and fuel cells is also gaining traction, driven by the need for faster charging and higher power output solutions.
- Electronics: This segment is currently the largest and fastest-growing application for nano graphene platelets.
- Dominant Type Segment:
- Single-Layer Graphene Nanosheets: This type currently holds a significant market share due to its superior properties and ongoing research into scalable production.
- Key Drivers: Its exceptional electrical and thermal conductivity makes it highly sought after for advanced electronics and high-performance composites. The continuous refinement of chemical vapor deposition (CVD) and exfoliation methods is improving the availability and quality of single-layer variants, further cementing its dominance.
- Single-Layer Graphene Nanosheets: This type currently holds a significant market share due to its superior properties and ongoing research into scalable production.
Nano Graphene Platelets Product Developments
Product developments in the nano graphene platelets market are characterized by a strong focus on enhancing purity, controlling flake size and thickness, and improving dispersion capabilities. Innovations are leading to the creation of graphene platelets with tailored surface chemistries for better integration into various matrices, such as polymers and resins. This allows for the development of advanced composites with superior mechanical strength, electrical conductivity, and thermal management properties. The ongoing advancements are enabling novel applications in sectors like advanced coatings for anti-corrosion and wear resistance, lightweight and durable materials for aerospace and automotive industries, and conductive inks for flexible electronics. The competitive advantage lies in companies that can consistently deliver high-performance, cost-effective graphene platelets with predictable properties, meeting the stringent requirements of diverse end-use industries.
Report Scope & Segmentation Analysis
This report provides an in-depth analysis of the global nano graphene platelets market, segmented by Application and Type. The Application segments include Electronics, Energy, Chemical Materials, and Others. The Type segments include Single-Layer Graphene Nanosheets and Bilayer Graphene Nanosheets.
- Electronics: This segment is projected to reach an estimated market size of xx million USD by 2033, with a CAGR of 18% during the forecast period. Competitive dynamics are driven by the need for miniaturization and enhanced performance in consumer electronics and advanced computing.
- Energy: The energy segment, encompassing battery technologies and renewable energy applications, is expected to reach xx million USD by 2033, exhibiting a CAGR of 16%. Growth is fueled by the electric vehicle revolution and the demand for efficient energy storage solutions.
- Chemical Materials: This segment, including applications in coatings, catalysts, and composites, is forecast to reach xx million USD by 2033, with a CAGR of 14%. Advancements in material science and industrial manufacturing are key drivers.
- Others: This segment, encompassing diverse niche applications, is projected to reach xx million USD by 2033, with a CAGR of 12%.
- Single-Layer Graphene Nanosheets: This segment is anticipated to hold a significant market share, reaching xx million USD by 2033, driven by its superior properties and expanding applications in high-end electronics and advanced composites.
- Bilayer Graphene Nanosheets: This segment is expected to witness steady growth, reaching xx million USD by 2033, as production technologies mature and new applications emerge.
Key Drivers of Nano Graphene Platelets Growth
The growth of the nano graphene platelets market is propelled by several key drivers. Technologically, advancements in synthesis methods are leading to more cost-effective and scalable production, improving material quality and consistency. This includes breakthroughs in liquid-phase exfoliation and chemical vapor deposition (CVD). Economically, the increasing demand for lightweight, high-strength, and conductive materials across industries like automotive, aerospace, and electronics is a major catalyst. The rising adoption of electric vehicles and the need for enhanced battery performance are also significant contributors. Regulatory factors, such as increasing government support for nanotechnology research and development, and the establishment of industry standards, are fostering market expansion. For instance, government initiatives to boost domestic manufacturing of advanced materials are indirectly benefiting graphene platelet production and adoption.
Challenges in the Nano Graphene Platelets Sector
Despite the promising growth trajectory, the nano graphene platelets sector faces several challenges. Regulatory hurdles, particularly concerning the long-term health and environmental impacts of nanomaterials, can slow down market adoption and necessitate extensive safety testing. Supply chain issues, including the inconsistent availability of high-quality raw materials and the scalability of production processes, can impact pricing and lead times. Competitive pressures from established alternative materials like carbon black and carbon nanotubes, which are often more cost-effective, also present a restraint. Furthermore, the high initial cost of producing high-purity graphene platelets remains a significant barrier for widespread adoption in cost-sensitive applications. The estimated impact of these challenges on market growth is a potential reduction of 5% in projected CAGR if not adequately addressed.
Emerging Opportunities in Nano Graphene Platelets
Emerging opportunities in the nano graphene platelets market are diverse and significant. The development of novel applications in the biomedical field, such as drug delivery systems, biosensors, and advanced imaging agents, presents a vast untapped potential. The growing demand for smart textiles and wearable electronics, where graphene platelets can provide integrated sensing and conductive functionalities, is another exciting area. Furthermore, the exploration of graphene platelets in advanced filtration membranes for water purification and air filtration offers significant environmental and health benefits. The increasing interest in sustainable and eco-friendly materials also opens doors for graphene-based solutions in areas like biodegradable composites and advanced energy harvesting devices. The potential market size for these emerging opportunities is estimated to be in the range of hundreds of millions of USD.
Leading Players in the Nano Graphene Platelets Market
- Angstron Materials (Nanotek Instruments)
- ACS Material
- Nanografi Nano Technology
- Avadain
- Applied Graphene Materials
- 2DM
- Ceal Tech International
- Thomas Swan
- Nanochemazone
- Graphenea
- XG Sciences
- Versarien
- CVD Equipment
- Graphene Laboratories
- G-FLAKE(Lukasiewicz)
- Avanzare
- Graphene 3D Lab
- Raymor Industries
- Tirupati Graphite PLC
- Fuxi Technology
- Chengdu Organic Chemicals
- Xiamen Knano Graphene Technology
Key Developments in Nano Graphene Platelets Industry
- 2023: Angstron Materials (Nanotek Instruments) launched new high-purity graphene nanoplatelet formulations for advanced conductive inks.
- 2022: ACS Material announced significant advancements in the scalability of their CVD graphene production, targeting industrial applications.
- 2021: Nanografi Nano Technology expanded its product portfolio with functionalized graphene platelets for composite applications, enhancing material compatibility.
- 2020: Avadain secured significant funding to scale up its graphene production technology, focusing on cost reduction.
- 2019: Applied Graphene Materials partnered with a major automotive manufacturer to develop graphene-enhanced lightweight components.
Strategic Outlook for Nano Graphene Platelets Market
The strategic outlook for the nano graphene platelets market is overwhelmingly positive, driven by continuous technological innovation and expanding application frontiers. Key growth catalysts include the increasing demand for materials that offer enhanced performance in electronics and energy storage, coupled with the growing adoption of lightweight composites in transportation. Companies that focus on cost-effective, scalable production and develop tailored graphene platelet solutions for specific end-user needs will be best positioned for success. Furthermore, strategic collaborations between material manufacturers, end-users, and research institutions will be crucial for accelerating product development and market penetration. The future potential lies in unlocking new applications in sectors like healthcare and advanced manufacturing, solidifying graphene platelets as a transformative material in the 21st century.
Nano Graphene Platelets Segmentation
-
1. Application
- 1.1. Electronics
- 1.2. Energy
- 1.3. Chemical Materials
- 1.4. Others
-
2. Type
- 2.1. Single-Layer Graphene Nanosheets
- 2.2. Bilayer Graphene Nanosheets
Nano Graphene Platelets Segmentation By Geography
-
1. North America
- 1.1. United States
- 1.2. Canada
- 1.3. Mexico
-
2. South America
- 2.1. Brazil
- 2.2. Argentina
- 2.3. Rest of South America
-
3. Europe
- 3.1. United Kingdom
- 3.2. Germany
- 3.3. France
- 3.4. Italy
- 3.5. Spain
- 3.6. Russia
- 3.7. Benelux
- 3.8. Nordics
- 3.9. Rest of Europe
-
4. Middle East & Africa
- 4.1. Turkey
- 4.2. Israel
- 4.3. GCC
- 4.4. North Africa
- 4.5. South Africa
- 4.6. Rest of Middle East & Africa
-
5. Asia Pacific
- 5.1. China
- 5.2. India
- 5.3. Japan
- 5.4. South Korea
- 5.5. ASEAN
- 5.6. Oceania
- 5.7. Rest of Asia Pacific
Nano Graphene Platelets REPORT HIGHLIGHTS
| Aspects | Details |
|---|---|
| Study Period | 2019-2033 |
| Base Year | 2024 |
| Estimated Year | 2025 |
| Forecast Period | 2025-2033 |
| Historical Period | 2019-2024 |
| Growth Rate | CAGR of XXX% from 2019-2033 |
| Segmentation |
|
Table of Contents
- 1. Introduction
- 1.1. Research Scope
- 1.2. Market Segmentation
- 1.3. Research Methodology
- 1.4. Definitions and Assumptions
- 2. Executive Summary
- 2.1. Introduction
- 3. Market Dynamics
- 3.1. Introduction
- 3.2. Market Drivers
- 3.3. Market Restrains
- 3.4. Market Trends
- 4. Market Factor Analysis
- 4.1. Porters Five Forces
- 4.2. Supply/Value Chain
- 4.3. PESTEL analysis
- 4.4. Market Entropy
- 4.5. Patent/Trademark Analysis
- 5. Global Nano Graphene Platelets Analysis, Insights and Forecast, 2019-2031
- 5.1. Market Analysis, Insights and Forecast - by Application
- 5.1.1. Electronics
- 5.1.2. Energy
- 5.1.3. Chemical Materials
- 5.1.4. Others
- 5.2. Market Analysis, Insights and Forecast - by Type
- 5.2.1. Single-Layer Graphene Nanosheets
- 5.2.2. Bilayer Graphene Nanosheets
- 5.3. Market Analysis, Insights and Forecast - by Region
- 5.3.1. North America
- 5.3.2. South America
- 5.3.3. Europe
- 5.3.4. Middle East & Africa
- 5.3.5. Asia Pacific
- 5.1. Market Analysis, Insights and Forecast - by Application
- 6. North America Nano Graphene Platelets Analysis, Insights and Forecast, 2019-2031
- 6.1. Market Analysis, Insights and Forecast - by Application
- 6.1.1. Electronics
- 6.1.2. Energy
- 6.1.3. Chemical Materials
- 6.1.4. Others
- 6.2. Market Analysis, Insights and Forecast - by Type
- 6.2.1. Single-Layer Graphene Nanosheets
- 6.2.2. Bilayer Graphene Nanosheets
- 6.1. Market Analysis, Insights and Forecast - by Application
- 7. South America Nano Graphene Platelets Analysis, Insights and Forecast, 2019-2031
- 7.1. Market Analysis, Insights and Forecast - by Application
- 7.1.1. Electronics
- 7.1.2. Energy
- 7.1.3. Chemical Materials
- 7.1.4. Others
- 7.2. Market Analysis, Insights and Forecast - by Type
- 7.2.1. Single-Layer Graphene Nanosheets
- 7.2.2. Bilayer Graphene Nanosheets
- 7.1. Market Analysis, Insights and Forecast - by Application
- 8. Europe Nano Graphene Platelets Analysis, Insights and Forecast, 2019-2031
- 8.1. Market Analysis, Insights and Forecast - by Application
- 8.1.1. Electronics
- 8.1.2. Energy
- 8.1.3. Chemical Materials
- 8.1.4. Others
- 8.2. Market Analysis, Insights and Forecast - by Type
- 8.2.1. Single-Layer Graphene Nanosheets
- 8.2.2. Bilayer Graphene Nanosheets
- 8.1. Market Analysis, Insights and Forecast - by Application
- 9. Middle East & Africa Nano Graphene Platelets Analysis, Insights and Forecast, 2019-2031
- 9.1. Market Analysis, Insights and Forecast - by Application
- 9.1.1. Electronics
- 9.1.2. Energy
- 9.1.3. Chemical Materials
- 9.1.4. Others
- 9.2. Market Analysis, Insights and Forecast - by Type
- 9.2.1. Single-Layer Graphene Nanosheets
- 9.2.2. Bilayer Graphene Nanosheets
- 9.1. Market Analysis, Insights and Forecast - by Application
- 10. Asia Pacific Nano Graphene Platelets Analysis, Insights and Forecast, 2019-2031
- 10.1. Market Analysis, Insights and Forecast - by Application
- 10.1.1. Electronics
- 10.1.2. Energy
- 10.1.3. Chemical Materials
- 10.1.4. Others
- 10.2. Market Analysis, Insights and Forecast - by Type
- 10.2.1. Single-Layer Graphene Nanosheets
- 10.2.2. Bilayer Graphene Nanosheets
- 10.1. Market Analysis, Insights and Forecast - by Application
- 11. Competitive Analysis
- 11.1. Global Market Share Analysis 2024
- 11.2. Company Profiles
- 11.2.1 Angstron Materials (Nanotek Instruments)
- 11.2.1.1. Overview
- 11.2.1.2. Products
- 11.2.1.3. SWOT Analysis
- 11.2.1.4. Recent Developments
- 11.2.1.5. Financials (Based on Availability)
- 11.2.2 ACS Material
- 11.2.2.1. Overview
- 11.2.2.2. Products
- 11.2.2.3. SWOT Analysis
- 11.2.2.4. Recent Developments
- 11.2.2.5. Financials (Based on Availability)
- 11.2.3 Nanografi Nano Technology
- 11.2.3.1. Overview
- 11.2.3.2. Products
- 11.2.3.3. SWOT Analysis
- 11.2.3.4. Recent Developments
- 11.2.3.5. Financials (Based on Availability)
- 11.2.4 Avadain
- 11.2.4.1. Overview
- 11.2.4.2. Products
- 11.2.4.3. SWOT Analysis
- 11.2.4.4. Recent Developments
- 11.2.4.5. Financials (Based on Availability)
- 11.2.5 Applied Graphene Materials
- 11.2.5.1. Overview
- 11.2.5.2. Products
- 11.2.5.3. SWOT Analysis
- 11.2.5.4. Recent Developments
- 11.2.5.5. Financials (Based on Availability)
- 11.2.6 2DM
- 11.2.6.1. Overview
- 11.2.6.2. Products
- 11.2.6.3. SWOT Analysis
- 11.2.6.4. Recent Developments
- 11.2.6.5. Financials (Based on Availability)
- 11.2.7 Ceal Tech International
- 11.2.7.1. Overview
- 11.2.7.2. Products
- 11.2.7.3. SWOT Analysis
- 11.2.7.4. Recent Developments
- 11.2.7.5. Financials (Based on Availability)
- 11.2.8 Thomas Swan
- 11.2.8.1. Overview
- 11.2.8.2. Products
- 11.2.8.3. SWOT Analysis
- 11.2.8.4. Recent Developments
- 11.2.8.5. Financials (Based on Availability)
- 11.2.9 Nanochemazone
- 11.2.9.1. Overview
- 11.2.9.2. Products
- 11.2.9.3. SWOT Analysis
- 11.2.9.4. Recent Developments
- 11.2.9.5. Financials (Based on Availability)
- 11.2.10 Graphenea
- 11.2.10.1. Overview
- 11.2.10.2. Products
- 11.2.10.3. SWOT Analysis
- 11.2.10.4. Recent Developments
- 11.2.10.5. Financials (Based on Availability)
- 11.2.11 XG Sciences
- 11.2.11.1. Overview
- 11.2.11.2. Products
- 11.2.11.3. SWOT Analysis
- 11.2.11.4. Recent Developments
- 11.2.11.5. Financials (Based on Availability)
- 11.2.12 Versarien
- 11.2.12.1. Overview
- 11.2.12.2. Products
- 11.2.12.3. SWOT Analysis
- 11.2.12.4. Recent Developments
- 11.2.12.5. Financials (Based on Availability)
- 11.2.13 CVD Equipment
- 11.2.13.1. Overview
- 11.2.13.2. Products
- 11.2.13.3. SWOT Analysis
- 11.2.13.4. Recent Developments
- 11.2.13.5. Financials (Based on Availability)
- 11.2.14 Graphene Laboratories
- 11.2.14.1. Overview
- 11.2.14.2. Products
- 11.2.14.3. SWOT Analysis
- 11.2.14.4. Recent Developments
- 11.2.14.5. Financials (Based on Availability)
- 11.2.15 G-FLAKE(Lukasiewicz)
- 11.2.15.1. Overview
- 11.2.15.2. Products
- 11.2.15.3. SWOT Analysis
- 11.2.15.4. Recent Developments
- 11.2.15.5. Financials (Based on Availability)
- 11.2.16 Avanzare
- 11.2.16.1. Overview
- 11.2.16.2. Products
- 11.2.16.3. SWOT Analysis
- 11.2.16.4. Recent Developments
- 11.2.16.5. Financials (Based on Availability)
- 11.2.17 Graphene 3D Lab
- 11.2.17.1. Overview
- 11.2.17.2. Products
- 11.2.17.3. SWOT Analysis
- 11.2.17.4. Recent Developments
- 11.2.17.5. Financials (Based on Availability)
- 11.2.18 Raymor Industries
- 11.2.18.1. Overview
- 11.2.18.2. Products
- 11.2.18.3. SWOT Analysis
- 11.2.18.4. Recent Developments
- 11.2.18.5. Financials (Based on Availability)
- 11.2.19 Tirupati Graphite PLC
- 11.2.19.1. Overview
- 11.2.19.2. Products
- 11.2.19.3. SWOT Analysis
- 11.2.19.4. Recent Developments
- 11.2.19.5. Financials (Based on Availability)
- 11.2.20 Fuxi Technology
- 11.2.20.1. Overview
- 11.2.20.2. Products
- 11.2.20.3. SWOT Analysis
- 11.2.20.4. Recent Developments
- 11.2.20.5. Financials (Based on Availability)
- 11.2.21 Chengdu Organic Chemicals
- 11.2.21.1. Overview
- 11.2.21.2. Products
- 11.2.21.3. SWOT Analysis
- 11.2.21.4. Recent Developments
- 11.2.21.5. Financials (Based on Availability)
- 11.2.22 Xiamen Knano Graphene Technology
- 11.2.22.1. Overview
- 11.2.22.2. Products
- 11.2.22.3. SWOT Analysis
- 11.2.22.4. Recent Developments
- 11.2.22.5. Financials (Based on Availability)
- 11.2.1 Angstron Materials (Nanotek Instruments)
List of Figures
- Figure 1: Global Nano Graphene Platelets Revenue Breakdown (million, %) by Region 2024 & 2032
- Figure 2: North America Nano Graphene Platelets Revenue (million), by Application 2024 & 2032
- Figure 3: North America Nano Graphene Platelets Revenue Share (%), by Application 2024 & 2032
- Figure 4: North America Nano Graphene Platelets Revenue (million), by Type 2024 & 2032
- Figure 5: North America Nano Graphene Platelets Revenue Share (%), by Type 2024 & 2032
- Figure 6: North America Nano Graphene Platelets Revenue (million), by Country 2024 & 2032
- Figure 7: North America Nano Graphene Platelets Revenue Share (%), by Country 2024 & 2032
- Figure 8: South America Nano Graphene Platelets Revenue (million), by Application 2024 & 2032
- Figure 9: South America Nano Graphene Platelets Revenue Share (%), by Application 2024 & 2032
- Figure 10: South America Nano Graphene Platelets Revenue (million), by Type 2024 & 2032
- Figure 11: South America Nano Graphene Platelets Revenue Share (%), by Type 2024 & 2032
- Figure 12: South America Nano Graphene Platelets Revenue (million), by Country 2024 & 2032
- Figure 13: South America Nano Graphene Platelets Revenue Share (%), by Country 2024 & 2032
- Figure 14: Europe Nano Graphene Platelets Revenue (million), by Application 2024 & 2032
- Figure 15: Europe Nano Graphene Platelets Revenue Share (%), by Application 2024 & 2032
- Figure 16: Europe Nano Graphene Platelets Revenue (million), by Type 2024 & 2032
- Figure 17: Europe Nano Graphene Platelets Revenue Share (%), by Type 2024 & 2032
- Figure 18: Europe Nano Graphene Platelets Revenue (million), by Country 2024 & 2032
- Figure 19: Europe Nano Graphene Platelets Revenue Share (%), by Country 2024 & 2032
- Figure 20: Middle East & Africa Nano Graphene Platelets Revenue (million), by Application 2024 & 2032
- Figure 21: Middle East & Africa Nano Graphene Platelets Revenue Share (%), by Application 2024 & 2032
- Figure 22: Middle East & Africa Nano Graphene Platelets Revenue (million), by Type 2024 & 2032
- Figure 23: Middle East & Africa Nano Graphene Platelets Revenue Share (%), by Type 2024 & 2032
- Figure 24: Middle East & Africa Nano Graphene Platelets Revenue (million), by Country 2024 & 2032
- Figure 25: Middle East & Africa Nano Graphene Platelets Revenue Share (%), by Country 2024 & 2032
- Figure 26: Asia Pacific Nano Graphene Platelets Revenue (million), by Application 2024 & 2032
- Figure 27: Asia Pacific Nano Graphene Platelets Revenue Share (%), by Application 2024 & 2032
- Figure 28: Asia Pacific Nano Graphene Platelets Revenue (million), by Type 2024 & 2032
- Figure 29: Asia Pacific Nano Graphene Platelets Revenue Share (%), by Type 2024 & 2032
- Figure 30: Asia Pacific Nano Graphene Platelets Revenue (million), by Country 2024 & 2032
- Figure 31: Asia Pacific Nano Graphene Platelets Revenue Share (%), by Country 2024 & 2032
List of Tables
- Table 1: Global Nano Graphene Platelets Revenue million Forecast, by Region 2019 & 2032
- Table 2: Global Nano Graphene Platelets Revenue million Forecast, by Application 2019 & 2032
- Table 3: Global Nano Graphene Platelets Revenue million Forecast, by Type 2019 & 2032
- Table 4: Global Nano Graphene Platelets Revenue million Forecast, by Region 2019 & 2032
- Table 5: Global Nano Graphene Platelets Revenue million Forecast, by Application 2019 & 2032
- Table 6: Global Nano Graphene Platelets Revenue million Forecast, by Type 2019 & 2032
- Table 7: Global Nano Graphene Platelets Revenue million Forecast, by Country 2019 & 2032
- Table 8: United States Nano Graphene Platelets Revenue (million) Forecast, by Application 2019 & 2032
- Table 9: Canada Nano Graphene Platelets Revenue (million) Forecast, by Application 2019 & 2032
- Table 10: Mexico Nano Graphene Platelets Revenue (million) Forecast, by Application 2019 & 2032
- Table 11: Global Nano Graphene Platelets Revenue million Forecast, by Application 2019 & 2032
- Table 12: Global Nano Graphene Platelets Revenue million Forecast, by Type 2019 & 2032
- Table 13: Global Nano Graphene Platelets Revenue million Forecast, by Country 2019 & 2032
- Table 14: Brazil Nano Graphene Platelets Revenue (million) Forecast, by Application 2019 & 2032
- Table 15: Argentina Nano Graphene Platelets Revenue (million) Forecast, by Application 2019 & 2032
- Table 16: Rest of South America Nano Graphene Platelets Revenue (million) Forecast, by Application 2019 & 2032
- Table 17: Global Nano Graphene Platelets Revenue million Forecast, by Application 2019 & 2032
- Table 18: Global Nano Graphene Platelets Revenue million Forecast, by Type 2019 & 2032
- Table 19: Global Nano Graphene Platelets Revenue million Forecast, by Country 2019 & 2032
- Table 20: United Kingdom Nano Graphene Platelets Revenue (million) Forecast, by Application 2019 & 2032
- Table 21: Germany Nano Graphene Platelets Revenue (million) Forecast, by Application 2019 & 2032
- Table 22: France Nano Graphene Platelets Revenue (million) Forecast, by Application 2019 & 2032
- Table 23: Italy Nano Graphene Platelets Revenue (million) Forecast, by Application 2019 & 2032
- Table 24: Spain Nano Graphene Platelets Revenue (million) Forecast, by Application 2019 & 2032
- Table 25: Russia Nano Graphene Platelets Revenue (million) Forecast, by Application 2019 & 2032
- Table 26: Benelux Nano Graphene Platelets Revenue (million) Forecast, by Application 2019 & 2032
- Table 27: Nordics Nano Graphene Platelets Revenue (million) Forecast, by Application 2019 & 2032
- Table 28: Rest of Europe Nano Graphene Platelets Revenue (million) Forecast, by Application 2019 & 2032
- Table 29: Global Nano Graphene Platelets Revenue million Forecast, by Application 2019 & 2032
- Table 30: Global Nano Graphene Platelets Revenue million Forecast, by Type 2019 & 2032
- Table 31: Global Nano Graphene Platelets Revenue million Forecast, by Country 2019 & 2032
- Table 32: Turkey Nano Graphene Platelets Revenue (million) Forecast, by Application 2019 & 2032
- Table 33: Israel Nano Graphene Platelets Revenue (million) Forecast, by Application 2019 & 2032
- Table 34: GCC Nano Graphene Platelets Revenue (million) Forecast, by Application 2019 & 2032
- Table 35: North Africa Nano Graphene Platelets Revenue (million) Forecast, by Application 2019 & 2032
- Table 36: South Africa Nano Graphene Platelets Revenue (million) Forecast, by Application 2019 & 2032
- Table 37: Rest of Middle East & Africa Nano Graphene Platelets Revenue (million) Forecast, by Application 2019 & 2032
- Table 38: Global Nano Graphene Platelets Revenue million Forecast, by Application 2019 & 2032
- Table 39: Global Nano Graphene Platelets Revenue million Forecast, by Type 2019 & 2032
- Table 40: Global Nano Graphene Platelets Revenue million Forecast, by Country 2019 & 2032
- Table 41: China Nano Graphene Platelets Revenue (million) Forecast, by Application 2019 & 2032
- Table 42: India Nano Graphene Platelets Revenue (million) Forecast, by Application 2019 & 2032
- Table 43: Japan Nano Graphene Platelets Revenue (million) Forecast, by Application 2019 & 2032
- Table 44: South Korea Nano Graphene Platelets Revenue (million) Forecast, by Application 2019 & 2032
- Table 45: ASEAN Nano Graphene Platelets Revenue (million) Forecast, by Application 2019 & 2032
- Table 46: Oceania Nano Graphene Platelets Revenue (million) Forecast, by Application 2019 & 2032
- Table 47: Rest of Asia Pacific Nano Graphene Platelets Revenue (million) Forecast, by Application 2019 & 2032
Frequently Asked Questions
1. What is the projected Compound Annual Growth Rate (CAGR) of the Nano Graphene Platelets?
The projected CAGR is approximately XXX%.
2. Which companies are prominent players in the Nano Graphene Platelets?
Key companies in the market include Angstron Materials (Nanotek Instruments), ACS Material, Nanografi Nano Technology, Avadain, Applied Graphene Materials, 2DM, Ceal Tech International, Thomas Swan, Nanochemazone, Graphenea, XG Sciences, Versarien, CVD Equipment, Graphene Laboratories, G-FLAKE(Lukasiewicz), Avanzare, Graphene 3D Lab, Raymor Industries, Tirupati Graphite PLC, Fuxi Technology, Chengdu Organic Chemicals, Xiamen Knano Graphene Technology.
3. What are the main segments of the Nano Graphene Platelets?
The market segments include Application, Type.
4. Can you provide details about the market size?
The market size is estimated to be USD XXX million as of 2022.
5. What are some drivers contributing to market growth?
N/A
6. What are the notable trends driving market growth?
N/A
7. Are there any restraints impacting market growth?
N/A
8. Can you provide examples of recent developments in the market?
N/A
9. What pricing options are available for accessing the report?
Pricing options include single-user, multi-user, and enterprise licenses priced at USD 4250.00, USD 6375.00, and USD 8500.00 respectively.
10. Is the market size provided in terms of value or volume?
The market size is provided in terms of value, measured in million.
11. Are there any specific market keywords associated with the report?
Yes, the market keyword associated with the report is "Nano Graphene Platelets," which aids in identifying and referencing the specific market segment covered.
12. How do I determine which pricing option suits my needs best?
The pricing options vary based on user requirements and access needs. Individual users may opt for single-user licenses, while businesses requiring broader access may choose multi-user or enterprise licenses for cost-effective access to the report.
13. Are there any additional resources or data provided in the Nano Graphene Platelets report?
While the report offers comprehensive insights, it's advisable to review the specific contents or supplementary materials provided to ascertain if additional resources or data are available.
14. How can I stay updated on further developments or reports in the Nano Graphene Platelets?
To stay informed about further developments, trends, and reports in the Nano Graphene Platelets, consider subscribing to industry newsletters, following relevant companies and organizations, or regularly checking reputable industry news sources and publications.
Methodology
Step 1 - Identification of Relevant Samples Size from Population Database


Step 2 - Approaches for Defining Global Market Size (Value, Volume* & Price*)

Note*: In applicable scenarios
Step 3 - Data Sources
Primary Research
- Web Analytics
- Survey Reports
- Research Institute
- Latest Research Reports
- Opinion Leaders
Secondary Research
- Annual Reports
- White Paper
- Latest Press Release
- Industry Association
- Paid Database
- Investor Presentations

Step 4 - Data Triangulation
Involves using different sources of information in order to increase the validity of a study
These sources are likely to be stakeholders in a program - participants, other researchers, program staff, other community members, and so on.
Then we put all data in single framework & apply various statistical tools to find out the dynamic on the market.
During the analysis stage, feedback from the stakeholder groups would be compared to determine areas of agreement as well as areas of divergence


