Key Insights
The global nanoparticles market is poised for substantial expansion, driven by escalating adoption across key sectors, most notably healthcare and electronics. This growth is fueled by advancements in targeted drug delivery, sophisticated diagnostics, and biosensors within the healthcare domain, alongside the enhancement of material properties for displays and circuitry in electronics. Continuous innovation in synthesis and functionalization techniques, supported by robust R&D investments and increasing industry-wide awareness of nanotechnology's benefits, underpins this positive trajectory.
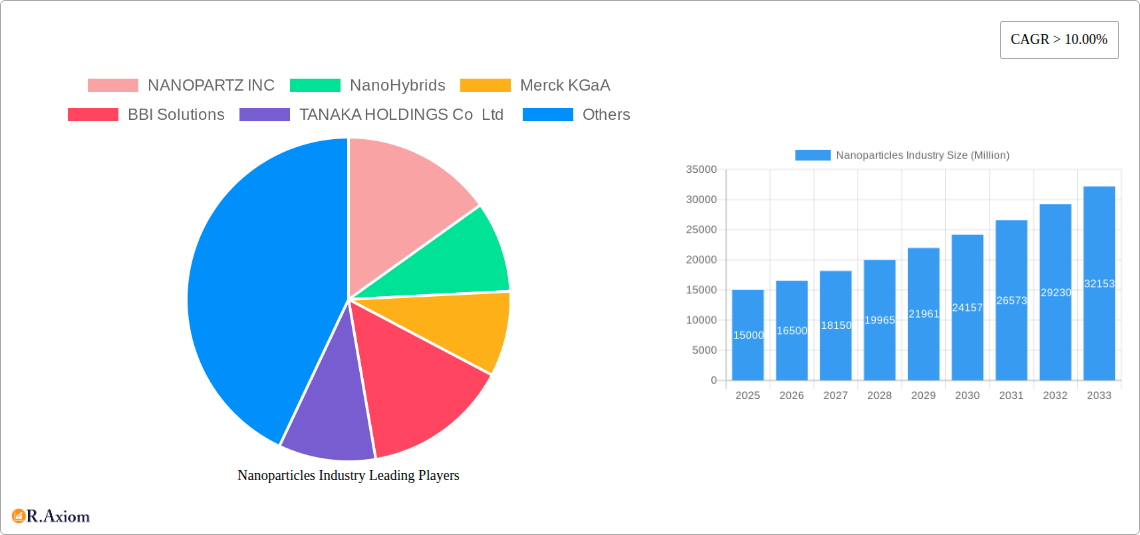
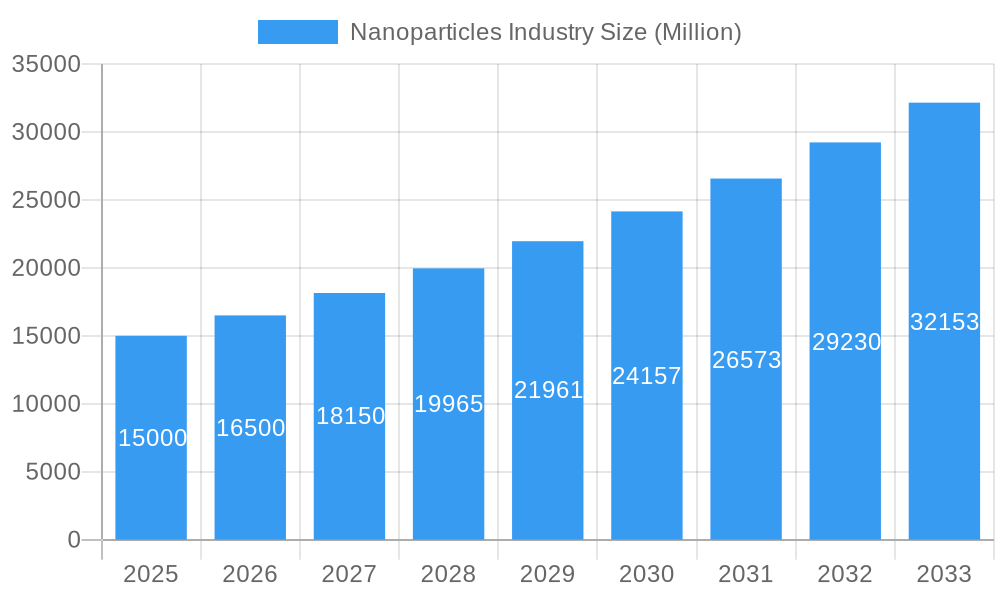
Nanoparticles Industry Market Size (In Billion)
However, the market confronts challenges including regulatory complexities related to safety and environmental impact, alongside the high production costs associated with specialized equipment. Despite these restraints, efforts toward cost reduction in manufacturing and increasing regulatory clarity are expected to alleviate these limitations. Key application segments like targeted drug delivery and imaging show significant promise, driven by the rising incidence of chronic diseases and the demand for precise healthcare solutions. While North America and Europe currently dominate, the Asia-Pacific region is projected to experience the most rapid growth, propelled by industrialization and significant nanotechnology investments in China, India, and South Korea.
Nanoparticles Industry Company Market Share
Nanoparticles Market Analysis: Size, Trends, and Forecast (2019-2033)
This comprehensive report offers critical insights into the global nanoparticles market, covering the period from 2019 to 2033. With a base year of 2025 and a forecast to 2033, the analysis details market segmentation and emerging opportunities. The estimated global market size for nanoparticles in 2025 is $1.37 billion, with a projected Compound Annual Growth Rate (CAGR) of 8.07% during the forecast period.
Nanoparticles Industry Market Concentration & Innovation
The nanoparticles industry exhibits a moderately concentrated market structure, with a few major players holding significant market share. However, the landscape is dynamic, characterized by continuous innovation and strategic mergers and acquisitions (M&A) activities. In 2025, the top five companies—Merck KGaA, Tanaka Holdings Co. Ltd, NanoHybrids, NANOPARTZ INC, and nanoComposix—are estimated to collectively hold approximately XX% of the global market share. M&A activity has been substantial, with deal values exceeding $XX Million in the past five years, driving consolidation and expansion into new application areas.
- Market Concentration: Highly concentrated in specific segments; fragmented in others.
- Innovation Drivers: Advancements in nanomaterials synthesis, characterization techniques, and application-specific functionalities.
- Regulatory Frameworks: Varying regulatory landscapes across different regions, influencing market access and product development.
- Product Substitutes: Limited direct substitutes; however, alternative technologies compete for similar applications.
- End-User Trends: Growing demand driven by electronics, healthcare, and chemical industries.
- M&A Activities: Significant M&A activity driving consolidation and expansion into new markets. Examples include (but are not limited to) deals valued at approximately $XX Million in 2024 involving key players like [Insert Example if available or state "data unavailable"].
Nanoparticles Industry Industry Trends & Insights
The global nanoparticles market is experiencing robust growth, driven by technological advancements, increasing demand across diverse end-user industries, and favorable government regulations. The market is projected to register a Compound Annual Growth Rate (CAGR) of XX% during the forecast period (2025-2033). This growth is fueled by the rising adoption of nanoparticles in electronics for enhanced performance and miniaturization, increased demand for targeted drug delivery systems in the healthcare sector, and the expanding use of nanoparticles in various chemical processes for improved efficiency and sustainability. Market penetration in key segments like targeted drug delivery and electronics continues to increase, projected to reach XX% by 2033. However, the market faces challenges from the high cost of production and potential toxicity concerns associated with certain nanoparticles. Competitive dynamics are intense, with companies constantly striving to differentiate their products through superior performance, cost-effectiveness, and regulatory compliance.
Dominant Markets & Segments in Nanoparticles Industry
The healthcare sector is the dominant end-user industry for nanoparticles, accounting for approximately XX% of the global market in 2025. Within applications, targeted drug delivery and in vitro diagnostics are the leading segments.
- Leading Region: North America holds the largest market share due to robust R&D investment, stringent regulatory approvals and a high concentration of major players.
- Dominant Application Segments:
- Targeted Drug Delivery: Driven by the rising prevalence of chronic diseases and the need for effective drug delivery systems.
- In Vitro Diagnostics: Fueled by the growing demand for rapid and accurate diagnostic tools.
- Key Drivers for Healthcare Dominance:
- Strong regulatory support for innovative therapies.
- Extensive research and development in nanomedicine.
- High prevalence of chronic diseases.
The electronics industry is another significant end-user segment, with increasing adoption of nanoparticles in advanced electronic components and devices, contributing to approximately XX% of the market in 2025. Key drivers include the miniaturization trend in electronics and the demand for enhanced functionality.
Nanoparticles Industry Product Developments
Recent innovations in nanoparticle technology have focused on improving biocompatibility, enhancing targeting efficiency in drug delivery, and developing highly sensitive sensors. Companies are leveraging advancements in nanomaterials synthesis and surface functionalization to create tailored nanoparticles with specific properties for diverse applications. This includes the development of biodegradable nanoparticles for improved safety and reduced environmental impact. The market fit for these innovations is largely driven by the increasing demand for effective and safe solutions across various industries.
Report Scope & Segmentation Analysis
This report segments the nanoparticles market by application (Imaging, Targeted Drug Delivery, Sensors, In Vitro Diagnostics, Probes, Catalysis, Other Applications) and end-user industry (Electronics, Healthcare, Chemicals, Other End-user Industries). Each segment is analyzed in detail, providing insights into market size, growth projections, and competitive dynamics. For instance, the targeted drug delivery segment is projected to grow at a CAGR of XX% during the forecast period, driven by increasing demand for personalized medicine. Similarly, the electronics segment is expected to experience robust growth due to increasing demand for miniaturized and high-performance electronic devices.
Key Drivers of Nanoparticles Industry Growth
The nanoparticles industry is propelled by several key factors: Firstly, technological advancements in nanomaterial synthesis and functionalization are continuously expanding the range of applications. Secondly, increasing demand from healthcare, electronics, and chemical industries drives market expansion. Thirdly, supportive government regulations and funding for nanotechnology research accelerate innovation and market penetration.
Challenges in the Nanoparticles Industry Sector
The nanoparticles industry faces challenges including stringent regulatory requirements leading to high development costs and long approval times. Supply chain complexities and ensuring consistent nanoparticle quality pose additional challenges. Moreover, intense competition among numerous players necessitates continuous innovation and differentiation strategies. These factors collectively impact profitability and market expansion.
Emerging Opportunities in Nanoparticles Industry
Emerging opportunities lie in the development of novel nanoparticles for advanced applications such as personalized medicine, next-generation electronics, and environmental remediation. The growing demand for sustainable solutions also creates opportunities for eco-friendly nanoparticles and manufacturing processes. Further exploration of specific biomedical applications and industrial processes for energy storage is also showing significant potential.
Leading Players in the Nanoparticles Industry Market
- NANOPARTZ INC
- NanoHybrids
- Merck KGaA
- BBI Solutions
- TANAKA HOLDINGS Co Ltd
- Sona Nanotech
- Cline Scientific AB
- nanoComposix
- Aurion
- Meliorum Technologies Inc
- Cytodiagnostics Inc
Key Developments in Nanoparticles Industry Industry
- [Month, Year]: Company X launches a new line of biodegradable nanoparticles for targeted drug delivery.
- [Month, Year]: Regulatory approval granted for a novel nanoparticle-based diagnostic tool.
- [Month, Year]: Merger between Company Y and Company Z expands market reach and product portfolio.
- [Add more bullet points as needed with specific dates and company/product details.]
Strategic Outlook for Nanoparticles Industry Market
The future of the nanoparticles industry is bright, driven by ongoing technological innovations, increasing demand from various sectors, and supportive government initiatives. The market presents significant opportunities for companies to develop and commercialize novel nanoparticles for a wide array of applications. Continued investments in research and development, strategic partnerships, and expansion into new geographical markets will be crucial for success.
Nanoparticles Industry Segmentation
-
1. Application
- 1.1. Imaging
- 1.2. Targeted Drug Delivery
- 1.3. Sensors
- 1.4. In Vitro Diagnostics
- 1.5. Probes
- 1.6. Catalysis
- 1.7. Other Applications
-
2. End-user Industry
- 2.1. Electronics
- 2.2. Healthcare
- 2.3. Chemicals
- 2.4. Other End-user Industries
-
3. Product Type
- 3.1. Metal Nanoparticles
- 3.2. Ceramic Nanoparticles
- 3.3. Polymer Nanoparticles
Nanoparticles Industry Segmentation By Geography
-
1. Asia Pacific
- 1.1. China
- 1.2. India
- 1.3. Japan
- 1.4. South Korea
- 1.5. Rest of Asia Pacific
-
2. North America
- 2.1. United States
- 2.2. Canada
- 2.3. Mexico
-
3. Europe
- 3.1. Germany
- 3.2. United Kingdom
- 3.3. Italy
- 3.4. France
- 3.5. Rest of Europe
-
4. Rest of the World
- 4.1. South America
- 4.2. Middle East and Africa
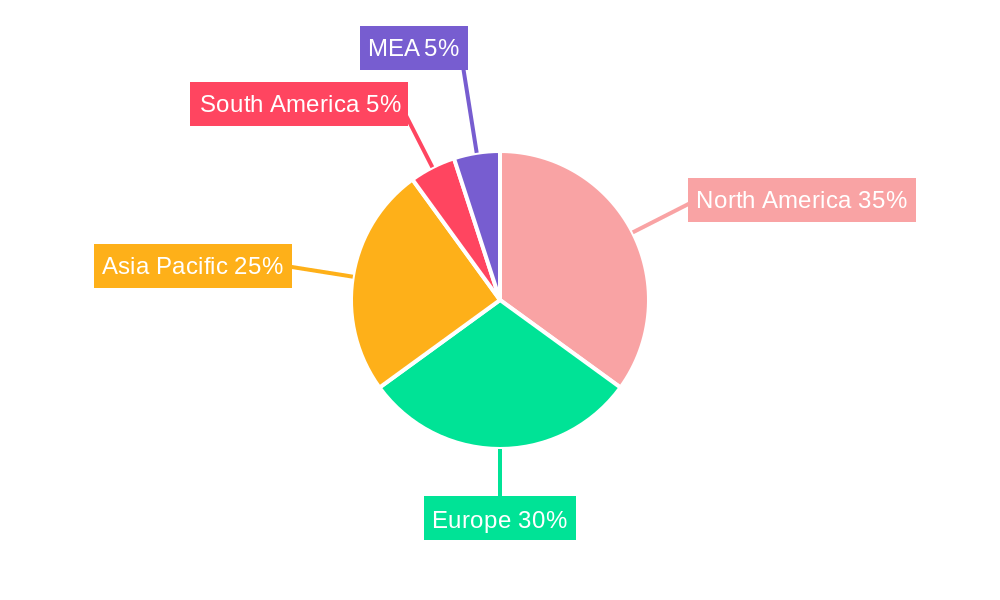
Nanoparticles Industry Regional Market Share
Geographic Coverage of Nanoparticles Industry
Nanoparticles Industry REPORT HIGHLIGHTS
| Aspects | Details |
|---|---|
| Study Period | 2020-2034 |
| Base Year | 2025 |
| Estimated Year | 2026 |
| Forecast Period | 2026-2034 |
| Historical Period | 2020-2025 |
| Growth Rate | CAGR of 8.07% from 2020-2034 |
| Segmentation |
|
Table of Contents
- 1. Introduction
- 1.1. Research Scope
- 1.2. Market Segmentation
- 1.3. Research Objective
- 1.4. Definitions and Assumptions
- 2. Executive Summary
- 2.1. Market Snapshot
- 3. Market Dynamics
- 3.1. Market Drivers
- 3.2. Market Restrains
- 3.3. Market Trends
- 3.4. Market Opportunities
- 4. Market Factor Analysis
- 4.1. Porters Five Forces
- 4.1.1. Bargaining Power of Suppliers
- 4.1.2. Bargaining Power of Buyers
- 4.1.3. Threat of New Entrants
- 4.1.4. Threat of Substitutes
- 4.1.5. Competitive Rivalry
- 4.2. PESTEL analysis
- 4.3. BCG Analysis
- 4.3.1. Stars (High Growth, High Market Share)
- 4.3.2. Cash Cows (Low Growth, High Market Share)
- 4.3.3. Question Mark (High Growth, Low Market Share)
- 4.3.4. Dogs (Low Growth, Low Market Share)
- 4.4. Ansoff Matrix Analysis
- 4.5. Supply Chain Analysis
- 4.6. Regulatory Landscape
- 4.7. Current Market Potential and Opportunity Assessment (TAM–SAM–SOM Framework)
- 4.8. RAX Analyst Note
- 4.1. Porters Five Forces
- 5. Market Analysis, Insights and Forecast 2021-2033
- 5.1. Market Analysis, Insights and Forecast - by Application
- 5.1.1. Imaging
- 5.1.2. Targeted Drug Delivery
- 5.1.3. Sensors
- 5.1.4. In Vitro Diagnostics
- 5.1.5. Probes
- 5.1.6. Catalysis
- 5.1.7. Other Applications
- 5.2. Market Analysis, Insights and Forecast - by End-user Industry
- 5.2.1. Electronics
- 5.2.2. Healthcare
- 5.2.3. Chemicals
- 5.2.4. Other End-user Industries
- 5.3. Market Analysis, Insights and Forecast - by Product Type
- 5.3.1. Metal Nanoparticles
- 5.3.2. Ceramic Nanoparticles
- 5.3.3. Polymer Nanoparticles
- 5.4. Market Analysis, Insights and Forecast - by Region
- 5.4.1. Asia Pacific
- 5.4.2. North America
- 5.4.3. Europe
- 5.4.4. Rest of the World
- 5.1. Market Analysis, Insights and Forecast - by Application
- 6. Global Nanoparticles Industry Analysis, Insights and Forecast, 2021-2033
- 6.1. Market Analysis, Insights and Forecast - by Application
- 6.1.1. Imaging
- 6.1.2. Targeted Drug Delivery
- 6.1.3. Sensors
- 6.1.4. In Vitro Diagnostics
- 6.1.5. Probes
- 6.1.6. Catalysis
- 6.1.7. Other Applications
- 6.2. Market Analysis, Insights and Forecast - by End-user Industry
- 6.2.1. Electronics
- 6.2.2. Healthcare
- 6.2.3. Chemicals
- 6.2.4. Other End-user Industries
- 6.3. Market Analysis, Insights and Forecast - by Product Type
- 6.3.1. Metal Nanoparticles
- 6.3.2. Ceramic Nanoparticles
- 6.3.3. Polymer Nanoparticles
- 6.1. Market Analysis, Insights and Forecast - by Application
- 7. Asia Pacific Nanoparticles Industry Analysis, Insights and Forecast, 2020-2032
- 7.1. Market Analysis, Insights and Forecast - by Application
- 7.1.1. Imaging
- 7.1.2. Targeted Drug Delivery
- 7.1.3. Sensors
- 7.1.4. In Vitro Diagnostics
- 7.1.5. Probes
- 7.1.6. Catalysis
- 7.1.7. Other Applications
- 7.2. Market Analysis, Insights and Forecast - by End-user Industry
- 7.2.1. Electronics
- 7.2.2. Healthcare
- 7.2.3. Chemicals
- 7.2.4. Other End-user Industries
- 7.3. Market Analysis, Insights and Forecast - by Product Type
- 7.3.1. Metal Nanoparticles
- 7.3.2. Ceramic Nanoparticles
- 7.3.3. Polymer Nanoparticles
- 7.1. Market Analysis, Insights and Forecast - by Application
- 8. North America Nanoparticles Industry Analysis, Insights and Forecast, 2020-2032
- 8.1. Market Analysis, Insights and Forecast - by Application
- 8.1.1. Imaging
- 8.1.2. Targeted Drug Delivery
- 8.1.3. Sensors
- 8.1.4. In Vitro Diagnostics
- 8.1.5. Probes
- 8.1.6. Catalysis
- 8.1.7. Other Applications
- 8.2. Market Analysis, Insights and Forecast - by End-user Industry
- 8.2.1. Electronics
- 8.2.2. Healthcare
- 8.2.3. Chemicals
- 8.2.4. Other End-user Industries
- 8.3. Market Analysis, Insights and Forecast - by Product Type
- 8.3.1. Metal Nanoparticles
- 8.3.2. Ceramic Nanoparticles
- 8.3.3. Polymer Nanoparticles
- 8.1. Market Analysis, Insights and Forecast - by Application
- 9. Europe Nanoparticles Industry Analysis, Insights and Forecast, 2020-2032
- 9.1. Market Analysis, Insights and Forecast - by Application
- 9.1.1. Imaging
- 9.1.2. Targeted Drug Delivery
- 9.1.3. Sensors
- 9.1.4. In Vitro Diagnostics
- 9.1.5. Probes
- 9.1.6. Catalysis
- 9.1.7. Other Applications
- 9.2. Market Analysis, Insights and Forecast - by End-user Industry
- 9.2.1. Electronics
- 9.2.2. Healthcare
- 9.2.3. Chemicals
- 9.2.4. Other End-user Industries
- 9.3. Market Analysis, Insights and Forecast - by Product Type
- 9.3.1. Metal Nanoparticles
- 9.3.2. Ceramic Nanoparticles
- 9.3.3. Polymer Nanoparticles
- 9.1. Market Analysis, Insights and Forecast - by Application
- 10. Rest of the World Nanoparticles Industry Analysis, Insights and Forecast, 2020-2032
- 10.1. Market Analysis, Insights and Forecast - by Application
- 10.1.1. Imaging
- 10.1.2. Targeted Drug Delivery
- 10.1.3. Sensors
- 10.1.4. In Vitro Diagnostics
- 10.1.5. Probes
- 10.1.6. Catalysis
- 10.1.7. Other Applications
- 10.2. Market Analysis, Insights and Forecast - by End-user Industry
- 10.2.1. Electronics
- 10.2.2. Healthcare
- 10.2.3. Chemicals
- 10.2.4. Other End-user Industries
- 10.3. Market Analysis, Insights and Forecast - by Product Type
- 10.3.1. Metal Nanoparticles
- 10.3.2. Ceramic Nanoparticles
- 10.3.3. Polymer Nanoparticles
- 10.1. Market Analysis, Insights and Forecast - by Application
- 11. Competitive Analysis
- 11.1. Company Profiles
- 11.1.1 NANOPARTZ INC
- 11.1.1.1. Company Overview
- 11.1.1.2. Products
- 11.1.1.3. Company Financials
- 11.1.1.4. SWOT Analysis
- 11.1.2 NanoHybrids
- 11.1.2.1. Company Overview
- 11.1.2.2. Products
- 11.1.2.3. Company Financials
- 11.1.2.4. SWOT Analysis
- 11.1.3 Merck KGaA
- 11.1.3.1. Company Overview
- 11.1.3.2. Products
- 11.1.3.3. Company Financials
- 11.1.3.4. SWOT Analysis
- 11.1.4 BBI Solutions
- 11.1.4.1. Company Overview
- 11.1.4.2. Products
- 11.1.4.3. Company Financials
- 11.1.4.4. SWOT Analysis
- 11.1.5 TANAKA HOLDINGS Co Ltd
- 11.1.5.1. Company Overview
- 11.1.5.2. Products
- 11.1.5.3. Company Financials
- 11.1.5.4. SWOT Analysis
- 11.1.6 Sona Nanotech
- 11.1.6.1. Company Overview
- 11.1.6.2. Products
- 11.1.6.3. Company Financials
- 11.1.6.4. SWOT Analysis
- 11.1.7 Cline Scientific AB
- 11.1.7.1. Company Overview
- 11.1.7.2. Products
- 11.1.7.3. Company Financials
- 11.1.7.4. SWOT Analysis
- 11.1.8 nanoComposix
- 11.1.8.1. Company Overview
- 11.1.8.2. Products
- 11.1.8.3. Company Financials
- 11.1.8.4. SWOT Analysis
- 11.1.9 Aurion
- 11.1.9.1. Company Overview
- 11.1.9.2. Products
- 11.1.9.3. Company Financials
- 11.1.9.4. SWOT Analysis
- 11.1.10 Meliorum Technologies Inc
- 11.1.10.1. Company Overview
- 11.1.10.2. Products
- 11.1.10.3. Company Financials
- 11.1.10.4. SWOT Analysis
- 11.1.11 Cytodiagnostics Inc
- 11.1.11.1. Company Overview
- 11.1.11.2. Products
- 11.1.11.3. Company Financials
- 11.1.11.4. SWOT Analysis
- 11.1.1 NANOPARTZ INC
- 11.2. Market Entropy
- 11.2.1 Company's Key Areas Served
- 11.2.2 Recent Developments
- 11.3. Company Market Share Analysis 2025
- 11.3.1 Top 5 Companies Market Share Analysis
- 11.3.2 Top 3 Companies Market Share Analysis
- 11.4. List of Potential Customers
- 12. Research Methodology
List of Figures
- Figure 1: Global Nanoparticles Industry Revenue Breakdown (billion, %) by Region 2025 & 2033
- Figure 2: Global Nanoparticles Industry Volume Breakdown (K Tons, %) by Region 2025 & 2033
- Figure 3: Asia Pacific Nanoparticles Industry Revenue (billion), by Application 2025 & 2033
- Figure 4: Asia Pacific Nanoparticles Industry Volume (K Tons), by Application 2025 & 2033
- Figure 5: Asia Pacific Nanoparticles Industry Revenue Share (%), by Application 2025 & 2033
- Figure 6: Asia Pacific Nanoparticles Industry Volume Share (%), by Application 2025 & 2033
- Figure 7: Asia Pacific Nanoparticles Industry Revenue (billion), by End-user Industry 2025 & 2033
- Figure 8: Asia Pacific Nanoparticles Industry Volume (K Tons), by End-user Industry 2025 & 2033
- Figure 9: Asia Pacific Nanoparticles Industry Revenue Share (%), by End-user Industry 2025 & 2033
- Figure 10: Asia Pacific Nanoparticles Industry Volume Share (%), by End-user Industry 2025 & 2033
- Figure 11: Asia Pacific Nanoparticles Industry Revenue (billion), by Product Type 2025 & 2033
- Figure 12: Asia Pacific Nanoparticles Industry Volume (K Tons), by Product Type 2025 & 2033
- Figure 13: Asia Pacific Nanoparticles Industry Revenue Share (%), by Product Type 2025 & 2033
- Figure 14: Asia Pacific Nanoparticles Industry Volume Share (%), by Product Type 2025 & 2033
- Figure 15: Asia Pacific Nanoparticles Industry Revenue (billion), by Country 2025 & 2033
- Figure 16: Asia Pacific Nanoparticles Industry Volume (K Tons), by Country 2025 & 2033
- Figure 17: Asia Pacific Nanoparticles Industry Revenue Share (%), by Country 2025 & 2033
- Figure 18: Asia Pacific Nanoparticles Industry Volume Share (%), by Country 2025 & 2033
- Figure 19: North America Nanoparticles Industry Revenue (billion), by Application 2025 & 2033
- Figure 20: North America Nanoparticles Industry Volume (K Tons), by Application 2025 & 2033
- Figure 21: North America Nanoparticles Industry Revenue Share (%), by Application 2025 & 2033
- Figure 22: North America Nanoparticles Industry Volume Share (%), by Application 2025 & 2033
- Figure 23: North America Nanoparticles Industry Revenue (billion), by End-user Industry 2025 & 2033
- Figure 24: North America Nanoparticles Industry Volume (K Tons), by End-user Industry 2025 & 2033
- Figure 25: North America Nanoparticles Industry Revenue Share (%), by End-user Industry 2025 & 2033
- Figure 26: North America Nanoparticles Industry Volume Share (%), by End-user Industry 2025 & 2033
- Figure 27: North America Nanoparticles Industry Revenue (billion), by Product Type 2025 & 2033
- Figure 28: North America Nanoparticles Industry Volume (K Tons), by Product Type 2025 & 2033
- Figure 29: North America Nanoparticles Industry Revenue Share (%), by Product Type 2025 & 2033
- Figure 30: North America Nanoparticles Industry Volume Share (%), by Product Type 2025 & 2033
- Figure 31: North America Nanoparticles Industry Revenue (billion), by Country 2025 & 2033
- Figure 32: North America Nanoparticles Industry Volume (K Tons), by Country 2025 & 2033
- Figure 33: North America Nanoparticles Industry Revenue Share (%), by Country 2025 & 2033
- Figure 34: North America Nanoparticles Industry Volume Share (%), by Country 2025 & 2033
- Figure 35: Europe Nanoparticles Industry Revenue (billion), by Application 2025 & 2033
- Figure 36: Europe Nanoparticles Industry Volume (K Tons), by Application 2025 & 2033
- Figure 37: Europe Nanoparticles Industry Revenue Share (%), by Application 2025 & 2033
- Figure 38: Europe Nanoparticles Industry Volume Share (%), by Application 2025 & 2033
- Figure 39: Europe Nanoparticles Industry Revenue (billion), by End-user Industry 2025 & 2033
- Figure 40: Europe Nanoparticles Industry Volume (K Tons), by End-user Industry 2025 & 2033
- Figure 41: Europe Nanoparticles Industry Revenue Share (%), by End-user Industry 2025 & 2033
- Figure 42: Europe Nanoparticles Industry Volume Share (%), by End-user Industry 2025 & 2033
- Figure 43: Europe Nanoparticles Industry Revenue (billion), by Product Type 2025 & 2033
- Figure 44: Europe Nanoparticles Industry Volume (K Tons), by Product Type 2025 & 2033
- Figure 45: Europe Nanoparticles Industry Revenue Share (%), by Product Type 2025 & 2033
- Figure 46: Europe Nanoparticles Industry Volume Share (%), by Product Type 2025 & 2033
- Figure 47: Europe Nanoparticles Industry Revenue (billion), by Country 2025 & 2033
- Figure 48: Europe Nanoparticles Industry Volume (K Tons), by Country 2025 & 2033
- Figure 49: Europe Nanoparticles Industry Revenue Share (%), by Country 2025 & 2033
- Figure 50: Europe Nanoparticles Industry Volume Share (%), by Country 2025 & 2033
- Figure 51: Rest of the World Nanoparticles Industry Revenue (billion), by Application 2025 & 2033
- Figure 52: Rest of the World Nanoparticles Industry Volume (K Tons), by Application 2025 & 2033
- Figure 53: Rest of the World Nanoparticles Industry Revenue Share (%), by Application 2025 & 2033
- Figure 54: Rest of the World Nanoparticles Industry Volume Share (%), by Application 2025 & 2033
- Figure 55: Rest of the World Nanoparticles Industry Revenue (billion), by End-user Industry 2025 & 2033
- Figure 56: Rest of the World Nanoparticles Industry Volume (K Tons), by End-user Industry 2025 & 2033
- Figure 57: Rest of the World Nanoparticles Industry Revenue Share (%), by End-user Industry 2025 & 2033
- Figure 58: Rest of the World Nanoparticles Industry Volume Share (%), by End-user Industry 2025 & 2033
- Figure 59: Rest of the World Nanoparticles Industry Revenue (billion), by Product Type 2025 & 2033
- Figure 60: Rest of the World Nanoparticles Industry Volume (K Tons), by Product Type 2025 & 2033
- Figure 61: Rest of the World Nanoparticles Industry Revenue Share (%), by Product Type 2025 & 2033
- Figure 62: Rest of the World Nanoparticles Industry Volume Share (%), by Product Type 2025 & 2033
- Figure 63: Rest of the World Nanoparticles Industry Revenue (billion), by Country 2025 & 2033
- Figure 64: Rest of the World Nanoparticles Industry Volume (K Tons), by Country 2025 & 2033
- Figure 65: Rest of the World Nanoparticles Industry Revenue Share (%), by Country 2025 & 2033
- Figure 66: Rest of the World Nanoparticles Industry Volume Share (%), by Country 2025 & 2033
List of Tables
- Table 1: Global Nanoparticles Industry Revenue billion Forecast, by Application 2020 & 2033
- Table 2: Global Nanoparticles Industry Volume K Tons Forecast, by Application 2020 & 2033
- Table 3: Global Nanoparticles Industry Revenue billion Forecast, by End-user Industry 2020 & 2033
- Table 4: Global Nanoparticles Industry Volume K Tons Forecast, by End-user Industry 2020 & 2033
- Table 5: Global Nanoparticles Industry Revenue billion Forecast, by Product Type 2020 & 2033
- Table 6: Global Nanoparticles Industry Volume K Tons Forecast, by Product Type 2020 & 2033
- Table 7: Global Nanoparticles Industry Revenue billion Forecast, by Region 2020 & 2033
- Table 8: Global Nanoparticles Industry Volume K Tons Forecast, by Region 2020 & 2033
- Table 9: Global Nanoparticles Industry Revenue billion Forecast, by Application 2020 & 2033
- Table 10: Global Nanoparticles Industry Volume K Tons Forecast, by Application 2020 & 2033
- Table 11: Global Nanoparticles Industry Revenue billion Forecast, by End-user Industry 2020 & 2033
- Table 12: Global Nanoparticles Industry Volume K Tons Forecast, by End-user Industry 2020 & 2033
- Table 13: Global Nanoparticles Industry Revenue billion Forecast, by Product Type 2020 & 2033
- Table 14: Global Nanoparticles Industry Volume K Tons Forecast, by Product Type 2020 & 2033
- Table 15: Global Nanoparticles Industry Revenue billion Forecast, by Country 2020 & 2033
- Table 16: Global Nanoparticles Industry Volume K Tons Forecast, by Country 2020 & 2033
- Table 17: China Nanoparticles Industry Revenue (billion) Forecast, by Application 2020 & 2033
- Table 18: China Nanoparticles Industry Volume (K Tons) Forecast, by Application 2020 & 2033
- Table 19: India Nanoparticles Industry Revenue (billion) Forecast, by Application 2020 & 2033
- Table 20: India Nanoparticles Industry Volume (K Tons) Forecast, by Application 2020 & 2033
- Table 21: Japan Nanoparticles Industry Revenue (billion) Forecast, by Application 2020 & 2033
- Table 22: Japan Nanoparticles Industry Volume (K Tons) Forecast, by Application 2020 & 2033
- Table 23: South Korea Nanoparticles Industry Revenue (billion) Forecast, by Application 2020 & 2033
- Table 24: South Korea Nanoparticles Industry Volume (K Tons) Forecast, by Application 2020 & 2033
- Table 25: Rest of Asia Pacific Nanoparticles Industry Revenue (billion) Forecast, by Application 2020 & 2033
- Table 26: Rest of Asia Pacific Nanoparticles Industry Volume (K Tons) Forecast, by Application 2020 & 2033
- Table 27: Global Nanoparticles Industry Revenue billion Forecast, by Application 2020 & 2033
- Table 28: Global Nanoparticles Industry Volume K Tons Forecast, by Application 2020 & 2033
- Table 29: Global Nanoparticles Industry Revenue billion Forecast, by End-user Industry 2020 & 2033
- Table 30: Global Nanoparticles Industry Volume K Tons Forecast, by End-user Industry 2020 & 2033
- Table 31: Global Nanoparticles Industry Revenue billion Forecast, by Product Type 2020 & 2033
- Table 32: Global Nanoparticles Industry Volume K Tons Forecast, by Product Type 2020 & 2033
- Table 33: Global Nanoparticles Industry Revenue billion Forecast, by Country 2020 & 2033
- Table 34: Global Nanoparticles Industry Volume K Tons Forecast, by Country 2020 & 2033
- Table 35: United States Nanoparticles Industry Revenue (billion) Forecast, by Application 2020 & 2033
- Table 36: United States Nanoparticles Industry Volume (K Tons) Forecast, by Application 2020 & 2033
- Table 37: Canada Nanoparticles Industry Revenue (billion) Forecast, by Application 2020 & 2033
- Table 38: Canada Nanoparticles Industry Volume (K Tons) Forecast, by Application 2020 & 2033
- Table 39: Mexico Nanoparticles Industry Revenue (billion) Forecast, by Application 2020 & 2033
- Table 40: Mexico Nanoparticles Industry Volume (K Tons) Forecast, by Application 2020 & 2033
- Table 41: Global Nanoparticles Industry Revenue billion Forecast, by Application 2020 & 2033
- Table 42: Global Nanoparticles Industry Volume K Tons Forecast, by Application 2020 & 2033
- Table 43: Global Nanoparticles Industry Revenue billion Forecast, by End-user Industry 2020 & 2033
- Table 44: Global Nanoparticles Industry Volume K Tons Forecast, by End-user Industry 2020 & 2033
- Table 45: Global Nanoparticles Industry Revenue billion Forecast, by Product Type 2020 & 2033
- Table 46: Global Nanoparticles Industry Volume K Tons Forecast, by Product Type 2020 & 2033
- Table 47: Global Nanoparticles Industry Revenue billion Forecast, by Country 2020 & 2033
- Table 48: Global Nanoparticles Industry Volume K Tons Forecast, by Country 2020 & 2033
- Table 49: Germany Nanoparticles Industry Revenue (billion) Forecast, by Application 2020 & 2033
- Table 50: Germany Nanoparticles Industry Volume (K Tons) Forecast, by Application 2020 & 2033
- Table 51: United Kingdom Nanoparticles Industry Revenue (billion) Forecast, by Application 2020 & 2033
- Table 52: United Kingdom Nanoparticles Industry Volume (K Tons) Forecast, by Application 2020 & 2033
- Table 53: Italy Nanoparticles Industry Revenue (billion) Forecast, by Application 2020 & 2033
- Table 54: Italy Nanoparticles Industry Volume (K Tons) Forecast, by Application 2020 & 2033
- Table 55: France Nanoparticles Industry Revenue (billion) Forecast, by Application 2020 & 2033
- Table 56: France Nanoparticles Industry Volume (K Tons) Forecast, by Application 2020 & 2033
- Table 57: Rest of Europe Nanoparticles Industry Revenue (billion) Forecast, by Application 2020 & 2033
- Table 58: Rest of Europe Nanoparticles Industry Volume (K Tons) Forecast, by Application 2020 & 2033
- Table 59: Global Nanoparticles Industry Revenue billion Forecast, by Application 2020 & 2033
- Table 60: Global Nanoparticles Industry Volume K Tons Forecast, by Application 2020 & 2033
- Table 61: Global Nanoparticles Industry Revenue billion Forecast, by End-user Industry 2020 & 2033
- Table 62: Global Nanoparticles Industry Volume K Tons Forecast, by End-user Industry 2020 & 2033
- Table 63: Global Nanoparticles Industry Revenue billion Forecast, by Product Type 2020 & 2033
- Table 64: Global Nanoparticles Industry Volume K Tons Forecast, by Product Type 2020 & 2033
- Table 65: Global Nanoparticles Industry Revenue billion Forecast, by Country 2020 & 2033
- Table 66: Global Nanoparticles Industry Volume K Tons Forecast, by Country 2020 & 2033
- Table 67: South America Nanoparticles Industry Revenue (billion) Forecast, by Application 2020 & 2033
- Table 68: South America Nanoparticles Industry Volume (K Tons) Forecast, by Application 2020 & 2033
- Table 69: Middle East and Africa Nanoparticles Industry Revenue (billion) Forecast, by Application 2020 & 2033
- Table 70: Middle East and Africa Nanoparticles Industry Volume (K Tons) Forecast, by Application 2020 & 2033
Frequently Asked Questions
1. What is the projected Compound Annual Growth Rate (CAGR) of the Nanoparticles Industry?
The projected CAGR is approximately 8.07%.
2. Which companies are prominent players in the Nanoparticles Industry?
Key companies in the market include NANOPARTZ INC, NanoHybrids, Merck KGaA, BBI Solutions, TANAKA HOLDINGS Co Ltd , Sona Nanotech, Cline Scientific AB, nanoComposix, Aurion, Meliorum Technologies Inc, Cytodiagnostics Inc.
3. What are the main segments of the Nanoparticles Industry?
The market segments include Application, End-user Industry, Product Type.
4. Can you provide details about the market size?
The market size is estimated to be USD 1.37 billion as of 2022.
5. What are some drivers contributing to market growth?
Rising Nanotechnology Applications in the Medical Industry; Rising Demand from the High-end Electronics Sector.
6. What are the notable trends driving market growth?
Targeted Drug Delivery to Dominate the Market.
7. Are there any restraints impacting market growth?
Volatility in Price of Gold.
8. Can you provide examples of recent developments in the market?
N/A
9. What pricing options are available for accessing the report?
Pricing options include single-user, multi-user, and enterprise licenses priced at USD 4750, USD 5250, and USD 8750 respectively.
10. Is the market size provided in terms of value or volume?
The market size is provided in terms of value, measured in billion and volume, measured in K Tons.
11. Are there any specific market keywords associated with the report?
Yes, the market keyword associated with the report is "Nanoparticles Industry," which aids in identifying and referencing the specific market segment covered.
12. How do I determine which pricing option suits my needs best?
The pricing options vary based on user requirements and access needs. Individual users may opt for single-user licenses, while businesses requiring broader access may choose multi-user or enterprise licenses for cost-effective access to the report.
13. Are there any additional resources or data provided in the Nanoparticles Industry report?
While the report offers comprehensive insights, it's advisable to review the specific contents or supplementary materials provided to ascertain if additional resources or data are available.
14. How can I stay updated on further developments or reports in the Nanoparticles Industry?
To stay informed about further developments, trends, and reports in the Nanoparticles Industry, consider subscribing to industry newsletters, following relevant companies and organizations, or regularly checking reputable industry news sources and publications.
Methodology
Step 1 - Identification of Relevant Samples Size from Population Database


Step 2 - Approaches for Defining Global Market Size (Value, Volume* & Price*)

Note*: In applicable scenarios
Step 3 - Data Sources
Primary Research
- Web Analytics
- Survey Reports
- Research Institute
- Latest Research Reports
- Opinion Leaders
Secondary Research
- Annual Reports
- White Paper
- Latest Press Release
- Industry Association
- Paid Database
- Investor Presentations

Step 4 - Data Triangulation
Involves using different sources of information in order to increase the validity of a study
These sources are likely to be stakeholders in a program - participants, other researchers, program staff, other community members, and so on.
Then we put all data in single framework & apply various statistical tools to find out the dynamic on the market.
During the analysis stage, feedback from the stakeholder groups would be compared to determine areas of agreement as well as areas of divergence

